Hayder A. Hasan*![]() | Zuhair Abd Hacheem
| Zuhair Abd Hacheem![]() | Alaa D. Almurshedi
| Alaa D. Almurshedi![]() | Hadi Khabbaz
| Hadi Khabbaz![]()
© 2023 IIETA. This article is published by IIETA and is licensed under the CC BY 4.0 license (http://creativecommons.org/licenses/by/4.0/).
OPEN ACCESS
Geotechnical engineers seek to improve the engineering performance of soil-cement mixtures by adding non-traditional materials as a supplementary additive. Emulsion polymers are widely used to develop cementitious composites by forming physical bonds. The aim of this study is to estimate the feasibility of utilizing Styrene Butadiene Latex (SBL) to increase the soil-cement mixtures strength. This study involved two parts. In the first one, the Unconfined Compressive Strength (UCS) tests were carried out on sandy soil blended with 8% cement and 0, 5, 7.5, and 10% SBL after 7 and 28 days of curing. The results of the UCS tests verified that the mixtures of sandy soil with 8% cement and 7.5% SBL were increased by 3% and 5% compared to soil - 8% cement after 7 and 28 curing days, respectively. In the second part of the study, Plaxis 3D software was used to evaluate the settlement of the raft foundation constructed above soil mixed columns (SMCs) using only 8% cement and 8% cement plus 7.5% SBL. The SMCs were designed under various compositions, lengths and floating or end bearing conditions depending on the location of rigid layer. The influence of adding 7.5% SBL to the composition of SMCs on the vertical stress was pragmatically increased by 5% and 4% when the SMCs were rested on a rigid layer at 5 and 10 m, respectively. The implications of the finding in design are also discussed.
soil stabilization, styrene butadiene latex, cement, soil mixed columns, Plaxis 3D
The construction of massive structures on weak soils is a challenging task in practical geotechnical projects. One of the effective methods to overcome the excessive settlement problem of construction of raft foundations on loses sandy soil is employing Soil Mixed Columns (SMCs) techniques. The SMCs method is commonly known as deep mixing soil in situ using a hardening agent such as cement or lime at depths using augers [1]. Obviously, the purpose of adding non-traditional material to soil-cement stabilization is to modify the geotechnical properties or to reduce the quantity of cement. Styrene Butadiene Latex (SBL), a synthetic emulsion polymer, combines styrene and butadiene monomers. According to Duprey [2], when the combination of monomers contains more than 45% of styrene on the basis of weight, the copolymer is known as styrene-butadiene latex (SBL). If the styrene content is higher, the plasticity (rigidity) will be greater.
Ateş [3] evaluated the effect of waterborne polymer on the strength of liquefiable sandy soil. The sand was mixed with various amounts of polymer and cement. The results of UCS test shown that the polymer significantly improved the strength of sandy soils. This may be attributed to the fact that the waterborne polymer functions by covering and linking soil particles through adhesion, thereby enhancing the connection between sand particles [4]. Rezaeimalek et al. [5] studied the effectiveness of a liquid-based polymer to stabilize various soils. One of them was a poorly-graded natural sand. The experimental observations revealed that the sequence of adding water and liquid polymer had insignificant influence on enhancing the UCS of treated soils. However, the sand samples indicated incremental increase in UCS when the samples were submerged in water for 4 days after 4 days of air curing. Xing et al. [6] recommended using polymers for soil stabilization due to their stable chemical properties and lower curing time. They evaluated the mechanical performance of different polymer-based stabilized sands. The analysis of the experimental tests illustrated that the strength of the stabilized soil was significantly increased under wet and dry conditions when using the polymer additives. Barreto et al. [7] studied the mechanical behaviour of butadiene-styrene rubber to reinforce sand specimens. Direct shear tests were performed using 10% moisture content and 50% relative density with different ratios of water-polymer (1:1, 1:2, and 1:4) at curing times 0, 48, 72, 96, 576, and 720 hours. The results indicated the improvement in the sand strength when adding styrene-butadiene rubber.
There are limited studies dealing with the effect of adding styrene-butadiene latex on sandy soil. A series of studies conducted by Baghini et al. [8-11] and Baghini and Ismail [12, 13] to investigate the effect of using different types and amounts of styrene-butadiene latex (5-10%) mixed with cement (0-6%) on the performance of soil-aggregate as a road base layer. All these studies confirmed that the results of adding 7 or 8% of SBL (depending on the type of SBL) and 4% cement are much better than samples treated only with 4% cement. For example, unconfined compressive strength, indirect tensile resilient modulus, indirect tensile strength, unsoaked California bearing ratio, and flexural strength tests were increased by 31, 32, 68, 26, and 49 %, respectively, when adding 7% styrene-butadiene latex and 4% cement as compared to using only 4% cement [11]. Moreover, the addition of 8% styrene-butadiene emulsion and 4% cement resulted in a decrease of 93% in weight changes and 87% in both water absorption and permeability relative to the addition of 4% cement after 12 wetting and drying cycles [8]. SBL was proven to be a favourable in the service life of pavements due to increase the strength and stiffness, improved the resistance to wetting and drying, and reduce the permanent deformation [10].
The ultimate bearing capacity of reinforced loose sand with a single soil mixed column (SMC) has been investigated by Sakr et al. [14]. A series of load tests were performed in the laboratory to examine the loaded behaviour of SMC. Tests were carried out on poorly graded sand with a relative density of 30 % and a column diameter of 70 mm to inspect the effect of the length (Lc) to diameter (dc) column ratio as an embedment ratio (Lc/dc) on the response of the footing load. It has been found that the ultimate bearing capacity was increased to 3.42, 4.46, 5.62, and 6.67 times of typical case without SMC when the embedment ratios (Lc/dc) was 1.5, 3, 4.5, and 6, respectively. In addition, the settlement percentage decreased to 30.43, 36.08, 42.61, and 50% for embedment ratios of 1.5, 3, 4.5, and 6, respectively, compared to testing without SMC.
To the best of authors’ knowledge, there have been no or limited studies that have examined the analysis of reinforcing sandy soil using SBL-cement as SMCs under raft foundation. The study aimed to investigate the influence of adding SBL to sandy soil treated with cement on vertical stress to reach a settlement not more than 25 mm. One of the important parameters required to calculate the maximum vertical stress in Plaxis 3D was selected the strength parameters. Therefore, a series of UCS tests were conducted on soil- 8% cement mixed with and without 5, 7.5, and 10% SBL. The best strength value was obtained by combining 7.5% SBL and 8% cement in the soil. When the 16th of SMCs with 800 mm diameter rested on a rigid layer at 5 m, the vertical stress increased by 5%.
The soil utilized in this study was classified as well-graded sand (WS) according to the Unified Soil Classification System (USCS). Based on the gradation curve illustrated in Figure 1, the uniformity coefficient (Cu) and the curvature coefficient (Cc) of sand particles were 2.75 and 1.01, respectively. The sand belongs to group A-3 (fine sand) based on the AASHTO soil classification. The geotechnical properties of the studied sandy soil are shown in Table 1. Basic tests such as sieve analysis, standard compaction, specific gravity, and direct shear tests have been carried out on the natural soil according to the ASTM standards to provide sensible information for predicting the soil behaviour.
In this study, a commercial ordinary Portland cement containing approximately SiO2 (19.34%), Al2O3 (4.32%), Fe2O3 (4.42%), and CaO (61.08%) on the basis of total weight was also used. Finally, the Styrene-Butadiene Latex (SBL), a synthetic polymer, is produced by Sika Ltd. under the commercial name "SikaLatex® SBR", adding to the mix of the soil and cement. The physical and chemical characteristics of this polymer are presented in Table 2.
Figure 1. The particle size disruption of the soil
Table 1. Geotechnical properties of the Sandy soil
|
Property |
Result |
ASTM standard |
|
Unified classification |
WS |
D-2487 |
|
Uniformity coefficient (Cu) |
2.75 |
|
|
Curvature coefficient (Cc) |
1.01 |
|
|
AASHTO classification |
A-3 |
D-3283 |
|
Specific gravity |
2.65 |
D-854 |
|
Standard compaction test |
|
D-698 |
|
Maximum dry density (kN/m3) |
18.6 |
|
|
Optimum moisture content (%) |
11.5 |
|
|
Direct shear test |
|
D-3080 |
|
Internal friction angle (ϕ)⁰ |
36.7 |
Table 2. The physical and chemical properties of SBL (Sika Ltd.)
|
Properties |
Result |
|
Chemical base |
Styrene butadiene rubber emulsion |
|
Appearance |
Liquid |
|
Colour |
White |
|
Density |
~ 1.02 kg/L at +27℃ |
|
pH-Value |
8 ± 1 |
|
Tensile adhesion strength |
≥ 1.5 N/mm2 (concrete failure) according to EN 1542 |
Laboratory experiment program was conducted to evaluate the influence of adding 5%, 7.5% and 10% of SBL on sandy soil mixed with 8% cement.
3.1 Standard compaction tests
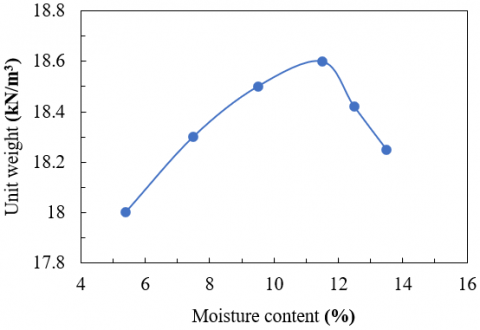
The soil used in the study was passed through sieve No. 4 (4.75 mm) after oven drying. The compaction test was performed to evaluate maximum dry density (MDD) and optimum moisture content (OMC) following ASTM D-698. Figure 2 shows the compaction curve of soil. The maximum dry density (MDD) was reached to 18.6 kN/m3 while the optimum moisture content (OMC) was found at 11.5%.
Figure 2. Relationship between moisture content and unit weight of sandy soil
3.2 Unconfined Compression Strength (UCS) tests
One of the trusted tests to verify the strength enhancement of stabilized soil is unconfined compression strength (UCS) test. The UCS tests were carried out according to ASTM D-2166. The soil samples with different stabilizer contents were prepared by tamping compaction at the optimum moisture content (OMC) and the maximum dry density (MDD) of natural soil. The tamping compaction was adopted in three layers under equal mass and height to keep the uniformity along the sample. Before adding the next layer, the top of the existing one was scratched to ensure proper bonding. The UCS tests were conducted with a 1 mm/min loading rate until samples failed. Figure 3 presents the equipment and apparatus used in study.
Figure 3. (a) Equipment used to prepare the UCS specimens, (b) Balance, and (c) Soil sample on the UCS apparatus
3.3 Preparation of the samples
The procedure of soil sample preparation has an important influence on the obtained result. In this study, the percentage of cement usage was 8%, depending on the soil-cement laboratory handbook [15]. This Handbook has presented information on how to estimate the cement requirements of different soils based on the AASHTO soil groups, the percentage of soil retained on NO. 4 sieve, the percentage of soil particle size smaller than 0.05 mm, and the maximum density of soil.
In general, the preparation of UCS test samples includes the following steps: Firstly, add 8% of cement to the soil based on the dry soil weight. Then, the required amount of emulsion polymer (0, 5, 7.5, and 10% on the basis of the dry weight of soil) was blended with water corresponding to OMC to prevent the formation of clumps when added to the soil-cement. The next step was to mix the contents until they obtained uniformity. Afterward, the samples were compacted at the MDD of soil using static methods. Finally, the samples were cured at the room temperature for 7 and 28 days after being covered with plastic wrap. To represent the construction of a soil-mixed column under the groundwater table, all samples were mixed with a water content equal to the OMC of untreated soil.
The primary objective of UCS test is to determine the variations in the compressive strength of the soil mixture due to changes in the cohesion value. The results of UCS test were based on the average value of three samples for each process condition. Figures 3 presents the results of the unconfined compression strength (UCS) of soil-cement treated with and without 5%, 7.5% and 10% SBL at 7 days curing. As seen in Figure 4, the UCS value of soil-cement without SBL was 2.53 MPa. However, when adding 5% of SBL to the soil-cement, the UCS value raised to 2.93 MPa. It was also observed that as the percentage of SBL increased up to 7.5%, the value of UCS increased to 3.27 MPa. In addition, with a further increase in SBL content, the UCS decreased to 3.06 MPa. This phenomenon could be attributed to the presence of flexible butadiene monomer and rigid styrene monomer in the chemical structure of polymer emulsion. The combination of these monomers provides a suitable mechanical bond between the soil-cement and SBL interface. However, when the concentration of SBL was greater than 7.5%, the UCS decreased due to the higher water content in the soil mixture provided by SBL [11, 12].
Figure 4. UCS of soil-cement treated with and without 5%, 7.5% and 10% SBL at 7 and 28
The effect of increasing curing time from 7 to 28 days on the UCS of soil-cement with and without 7.5% SBL have also been presented in Figure 4. It can be observed that the ratio of strength improvement due to increasing curing time from 7 to 28 days of soil-cement without SBL and with 7.5% SBL were 54% and 51%, respectively. In addition, it is noted that the addition of SBL played a significant role in enhancing the UCS value of the mixed soil-cement. The strength ratio increased to 27% when adding 7.5% SBL to the soil-cement mixture.
Based on the study conducted by Rutherford [16] at Texas A&M University. Briaud et al. [17] developed Eq. (1) to estimate the elastic modulus of the soil-cement mixture. It could be considered a conservative approach.
$E(k P a)=12900\left(q_u(k P a)\right)^{0.41}$ (1)
where, E is elastic modulus of soil-cement mixture and qu is the unconfined compressive strength.
Figure 5 presents the effect of adding different SBL on the elastic modulus of soil-cement at 7 and 28 days of curing. As shown in the Figure 5, the highest enhancement ratio of E with adding 7.5% SBL to soil-cement was 10% at 7 days of curing, while it was 24% for 28 days of curing. In addition, the E enhancement ratio was 19% after increasing the curing time from 7 to 28 days. This could be related to an increase in the formation of C-S-H due to the pozzolanic reaction [18].
Figure 5. The Elastic modulus of soil-cement with different SBL at 7 and 28 curing days
To examine the benefits of using SBL in soil-cement applications, the simulation model of Soil Mixing Columns (DMCs) under raft foundation was conducted to calculate the maximum vertical stress to reach 25mm of settlement based on Plaxis 3D.
5.1 Modelling
The model dimensions were 30 m by 30 m in the horizontal plane and 25 m in depth from the ground surface. The groundwater was located at a depth of 1 m below the surface. The geometry and dimensions of the raft foundation and DMCs used in the study have been presented in Figure 6. The foundation has a square size of 10 m and a thickness of 0.5 m. Also, DMCs were patterned in 4 by 4 rows with a spacing of 2.2 m. The diameter of DMCs was 80 mm, while the length was either 5 m or 10 m. Table 3 clarifies DMCs length with modelling as floating or end-bearing based on the location of the sandstone layer. Table 4 illustrates the material parameters used in the model. The elastic modulus (E) of sandy soil was assumed to increase by 5,000 kN/m2 per meter of depth from the ground surface down to the sandstone layer.
To calculate the maximum applied vertical load to reach 25 mm of settlement, the foundation has been assumed to be under the prescribed uniform displacement condition. The DMCs were modelled using the polycurve option and extruding vertically downward. The strength interface between the DMCc shaft and the soil was reduced to 0.9. The mesh was generated with a coarse element distribution.
The analysis was achieved, using three phases. The initial phase represented the effective soil stress in situ before starting the construction; the foundation and SMCs were activated in the second phase. In the third phase, the prescribed displacement was applied.
Table 3. Summary of cases analysed
|
Case |
SMCs length (m) |
||
|
(1) |
(2) |
(3) |
|
|
Foundation on soil only |
Non-SMCs |
Non-SMCs |
Non-SMCs |
|
Foundation on soil with SMCs (soil-cement) |
5 |
5 |
5 |
|
10 |
10 |
- |
|
|
Foundation on soil with SMCs (soil-cement-SBL) |
5 |
5 |
5 |
|
10 |
10 |
- |
|
Notes: (1) When the sandstone layer at -20 m; (2) When the sandstone layer at -10.5 m; (3) When the sandstone layer at -5.5 m.
Figure 6. The raft foundation and DMCs geometry and dimensions
5.2 Simulation results
In this study, the maximum vertical stress magnitudes were based on the variation of SMCs composition, lengths, floating or end bearing and location of rigid layer conditions. The SMCs length is considered one of the essential parameters in evaluating the settlement [1]. According to Han [1], the methods for estimating pile group settlement can also be used for SMCs due to the semi-rigid characteristics of the columns.
Table 4. Parameters of material used in the model
|
|
Soil |
Concrete# |
SMCs as (Soil-cement) |
SMCs as (Soil-cement-SBL) |
Sandstone● |
|
Material model |
Mohr-Coulomb |
Linear elastic |
Mohr-Coulomb |
Mohr-Coulomb |
Hoek-Brown |
|
γunsat (KN/m3) |
18.6 |
25 * |
18.6 |
18.6 |
24 |
|
γsat (KN/m3) |
20.7 |
|
20.7 |
20.7 |
24.5 |
|
Drainage condition |
Drainage |
Non-porous |
Undrained (B) |
Undrained (B) |
Drainage |
|
E (kPa) |
15×103 * |
30×106 * |
383×103 |
433×103 |
6×10⁶ |
|
Poisson’s ratio (υ) |
0.25 * |
0.2 * |
0.2 * |
0.2 * |
0.2 |
|
c or Su (kPa) |
|
|
1950 |
2470 |
|
|
ϕ° |
36.7 |
|
|
|
|
|
Rinter |
|
|
0.9 * |
0.9 * |
|
|
Compressive strength (MPa) |
|
|
|
|
25 |
|
Material constant |
|
|
|
|
17 |
|
Geological strength index, GSI |
|
|
|
|
70 |
*Assumed parameter value; # Concrete parameters modelled from Plaxis library; ● Sandstone depended on Bertuzzi [19] study
Figure 7 shows the effect of SMCs length on the vertical stress to reach 25 mm settlement. The SMCs were in floating condition due to a rigid layer (sandstone) located on -20 m. As you can see in the Figure 7, the vertical stress increased from 140 kPa when the soil was not treated with SMCs to 170 and 172 kPa when the soil was reinforced by 5 m length of SMCs as (soil-cement) and (soil-cement-SBL), respectively. The phenomenon of increased vertical stress capacity could be because increasing the affected area of raft foundation. In a floating condition, it is assumed that the effective area is transferred from the column tops to a depth equal to two-thirds of the length of the SMCs. This transfer occurs with a horizontal spread of one and a vertical spread of four [20].
In addition, when increasing the length of SMCs from 5 to 10 m, the increased ratio of the vertical stress was 15% and 16% with (Soil-cement) and (Soil-cement SBL), respectively. The stress enhancement ratio of adding SBL to the soil-cement mixture was 1.2% when the SMCs length was 5 m, while the ratio of increased stress was 2.3% with a 10 m length of SMCs. This could be because increasing the skin friction along the SMCs.
Figure 7. The effect of SMCs length on the vertical stress to reach 25 mm settlement when a rigid layer (sandstone) located on -20 m
Figure 8. The effect of SMCs length on the vertical stress to reach 25 mm settlement when a rigid layer (sandstone) located on -10.5 m
Figure 8 illustrates the effect of SMCs length on the vertical stress to reach 25 mm settlement when the rigid layer was located at -10.5 m. The SMCs classify in floating state when the length is 5 m. The vertical stress of soil without SMCs was 154 kPa while it was 140 kPa when sandstone layer was at -20. It is attributed to the elastic settlement affected by the location of a rigid layer. The vertical stress of 5 m length of SMCs was also greater than the vertical stress of 5 m length when the sandstone layer was at -20. The increment ratio of vertical stress was 13% for both (Soil-cement) and (Soil-cement-SBL).
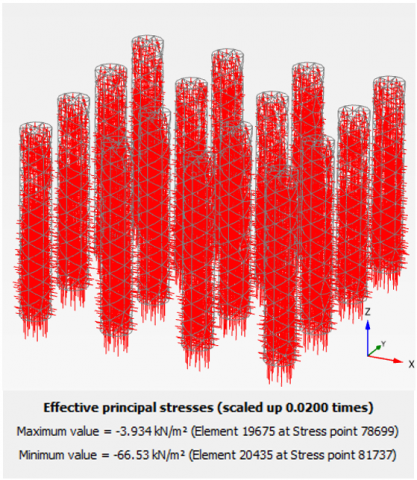
The effect of resting SMCs on the rock layer at -5.5 and -10.5 m are presented at Figure 9. In this case, the columns classified as end bearing. When the SMCs were rested on rock layer at -5.5 m, the vertical stress was 350 kPa with mixtures of soil and cement. However, it was recorded 365 kPa with mixtures of soil, cement and SBL. In addition, the stress of 5 m length SMCs as end bearing state is higher than that as floating state. The ratio increased by 83 and 89% for (Soil-cement) and (Soil-cement-SBL), respectively. This could be because the behaviour of SMCs considering as semirigid columns. As a results, the vertical stresses are transferred to the columns until the columns were reached the ultimate strength. The increased ratio of vertical stress from adding SBL to soil-cement mixture was 5%. However, the increased ratio was 4% when SMCs were rested on rock layer at -10.5 m. When the SMCs in end bearing condition, the greater the vertical stress, the smaller length of SMCs. The vertical displacement mesh of SMCs resting on a rigid layer at -5.5 m is presented in Figure 10. As you can see, the upper part of the SMCs is located under 25 mm of displacement (red colour). Moreover, the displacement gradually decreased until ending of SMCs to reached 0.6 mm (blue colour) of soil, cement and SBL mixture. Figures 11 and 12 present the maximum and minimum values of the effective cartesian stress and the effective principal stress, respectively, for SMCs resting on a rigid layer at -5.5 m after treating soil-cement by SBL in the vertical direction.
Figure 9. The effect of SMCs length on the vertical stress to reach 25 mm settlement when a rigid layer (sandstone) located on -5.5 and -10.5 m
Figure 10. The vertical displacement mesh of SMCs resting on a rigid layer at -5.5 m after treating soil-cement by SBL
Figure 11. The vertical cartesian effective stress of SMCs resting on a rigid layer at -5.5 m after treating soil-cement by SBL
Figure 12. The vertical effective principal stress of SMCs resting on a rigid layer at -5.5 m after treating soil-cement by SBL
This article aimed to study the enhancement of maximum vertical stress on a raft foundation constricting above sandy soil treated by Soil Mixed Columns (SMCs) approach. SMCs were modelled using Plaxis 3D. A series of UCS tests were carried out utilizing 5%, 7.5%, and 10% of Styrene Butadiene Latex (SBL) as a supplementary additive to soil plus 8% cement at 7 and 28 days of curing in order to select the proper strength parameters that were employed in the finite element analysis.
The UCS test results clarified that the strength increased from 2.53 MPa to 2.93 MPa with adding 5% of SBL to the soil-cement mixer after 7 curing days. In addition, the strength kept increasing by adding 7.5% SBL. It was recorded at 3.27 MPa. However, the UCS decreased to 3.06 MPa when adding 10% SBL. The reason for this behaviour is clarified in the Results and Discussion section. When the curing time was extended to 28 days, the compressive strength of the soil-cement mixer increased to 3.9 MPa. The enhancement ratio due to increased curing time was 54% compared to samples tested after 7 days. It is also explained in the Results and Discussion section.
The compressive strength was increased to 4.94 MPa by adding 7.5% of SBL to the soil-cement mixture. The enhancement ratio due to adding 7.5% SBL is 26% compared to soil-cement samples. In Plaxis, the SMCs were modelled with different compositions, lengths, and floating or end-bearing conditions depending on the rigid layer location. The maximum vertical stress on the raft foundation to reach 25 mm of settlement was increased when the composition of the mixture was 7.5% SBL and 8% cement in the soil. The vertical stress was 366 MPa when the location of a rigid layer was at 5 m, though it was 350 MPa, when mixing the soil with cement only.
[1] Han, J. (2015). Principles and Practice of Ground Improvement. John Wiley & Sons.
[2] Duprey, R.L. (1968). Compilation of air pollutant emission factors. US Department of Health, Education, and Welfare, Public Health Service, Bureau of Disease Prevention and Environmental Control, National Center for Air Pollution Control.
[3] Ateş, A. (2013). The effect of polymer-cement stabilization on the unconfined compressive strength of liquefiable soils. International Journal of Polymer Science, 2013: 356214. https://doi.org/10.1155/2013/356214
[4] Al-Khanbashi, A., Abdalla, S.W. (2006). Evaluation of three waterborne polymers as stabilizers for sandy soil. Geotechnical & Geological Engineering, 24(6): 1603-1625. https://doi.org/10.1007/s10706-005-4895-3
[5] Rezaeimalek, S., Nasouri, A., Huang, J., Bin-Shafique, S., Gilazghi, S.T. (2017). Comparison of short-term and long-term performances for polymer-stabilized sand and clay. Journal of Traffic and Transportation Engineering (English Edition), 4(2): 145-155. https://doi.org/10.1016/j.jtte.2017.01.003
[6] Xing, C., Liu, X., Anupam, K. (2018). Response of sandy soil stabilized by polymer additives. Open Access Journal of Environmental and Soil Sciences, 1(3): 64-71. https://doi.org/10.32474/oajess.2018.01.000112
[7] Barreto, T.M., Repsold, L.M., Silva, N.A.B.D.S., Casagrande, M.D.T. (2022). Influence of addition of butadiene copolymer and modified styrene on the mechanical behavior of a sand. Soils and Rocks, 45(2): e2022074521. https://doi.org/10.28927/SR.2022.074521
[8] Baghini, M.S., Ismail, A., Karim, M.R., Shokri, F., Firoozi, A.A. (2014). Effect of styrene–butadiene copolymer latex on properties and durability of road base stabilized with Portland cement additive. Construction and Building Materials, 68: 740-749. https://doi.org/10.1016/j.conbuildmat.2014.06.061
[9] Baghini, M.S., Ismail, A., Naseralavi, S.S., Firoozi, A.A. (2016). Freeze–thaw performance of base course treated with carboxylated styrene–butadiene emulsion–Portland cement. International Journal of Pavement Engineering, 19(12): 1087-1095. https://doi.org/10.1080/10298436.2016.1240561
[10] Baghini, M.S., Ismail, A., Naseralavi, S.S., Firoozi, A.A. (2016). Performance evaluation of road base stabilized with styrene–butadiene copolymer latex and Portland cement. International Journal of Pavement Research and Technology, 9(4): 321-336. https://doi.org/10.1016/j.ijprt.2016.08.006
[11] Baghini, M.S., Ismail, A., Firoozi, A.A. (2016). Physical and mechanical properties of carboxylated styrene-butadiene emulsion modified Portland cement used in road base construction. Journal of Applied Sciences, 16(8): 344-358. https://doi.org/10.3923/jas.2016.344.358
[12] Baghini, M.S., Ismail, A. (2015). Short-term effects of applying carboxylated styrene butadiene emulsion-Portland cement mixture on road base construction. Journal of Applied Sciences, 15(11): 1266-1277. https://doi.org/10.3923/jas.2015.1266.1277
[13] Baghini, M.S., Ismail, A. (2016). Application of carboxylated styrene–butadiene emulsion-Portland cement mixture as road base material. International Journal of Pavement Engineering, 18(12): 1070-1080. https://doi.org/10.1080/10298436.2016.1149834
[14] Sakr, M., Nazir, A., Azzam, W., Aamer, F.A. (2019). Model study of deep soil mixing in loose sand. Fifteenth International Conference on Structural and Geotechnical Engineering - Advances in Construction Techniques, Ain Shams University-Egypt.
[15] Portland Cement Association. (1992). Soil-cement Laboratory Handbook. Portland Cement Association.
[16] Rutherford, C.J. (2005). Design manual for excavation support using deep mixing technology. Doctoral dissertation, Texas A&M University.
[17] Briaud, J.L., Nicholson, P., Lee, J. (2000). Behavior of full-scale VERT wall in sand. Journal of Geotechnical and Geoenvironmental Engineering, 126(9): 808-818. https://doi.org/10.1061/(ASCE)1090-0241(2000)126:9(808)
[18] Athanasopoulou, A. (2016). The role of curing period on the engineering characteristics of a cement-stabilized soil. Romanian Journal of Transport Infrastructure, 5(1): 38-52. https://doi.org/10.1515/rjti-2016-0041
[19] Bertuzzi, R. (2014). Sydney sandstone and shale parameters for tunnel design. Australian Geomechanics. 49(2): 1-10.
[20] Smith, I. (2021). Smith's Elements of Soil Mechanics. John Wiley & Sons.