Riyadh Bouddou* | Farid Benhamida | Ismail Ziane | Amine Zeggai | Moussa Belgacem
© 2020 IIETA. This article is published by IIETA and is licensed under the CC BY 4.0 license (http://creativecommons.org/licenses/by/4.0/).
OPEN ACCESS
Electricity markets are open after the deregulation of power systems due to competition. An optimization problem based on dynamic economic dispatch has recently come up in the new context of deregulated power systems known as bid-based dynamic economic dispatch (BBDED). It is one of the major operations and control functions in the electricity markets used to determine the optimal operations of market participants with scheduled load demands during a specified period. BBDED involves power generation companies (GENCOs) and customers to submit energy and price bids to the independent system operator (ISO) in a day-ahead market. The ISO clears the market with the objective of social profit maximization. In this paper, a BBDED problem is solved using an improved simulated annealing algorithm (ISA), including system constraints with different periods under bidding strategies. The proposed ISA technique is implemented in MATLAB and applied on a 3-unit system, a 6-unit system, and a 40-unit large-scale system. The proposed ISA is evaluated by comparison with relevant methods available in the literature, to demonstrate and confirm its potential in terms of convergence, robustness, and effectiveness for solving the BBDED problem.
competitive electricity market, bid-based dynamic economic dispatch (BBDED), bidding strategy, improved simulated annealing algorithm (ISA)
In traditional power systems, the power supply is monopolized, where there is no competition. Suppliers try to reduce the estimated cost of production while ensuring sufficient security of supply for consumers who do not have the choice of their supplier. The power supply from production, transmission, distribution, and system operations are under the monopoly by a single utility known as the vertically integrated utility. The scheduling problem in these systems is known as the dynamic economic dispatch (DED), which has become a significant optimization problem. In DED, the objective is to schedule production units and dispatch power demand between them and find optimum production scenarios subject to minimize the overall generation and operating cost in a power system during a period taking into account various system constraints and satisfying hourly load demands [1, 2].
Quite recently, after the 1980s, the power industry has been moved from a monopoly model to a restructured model, which is characterized by unbundling electricity companies, open power grids, and competitive electricity markets in several countries. The objective of the restructuring is to improve the economic and technical performances of power systems by introducing the competition between suppliers, which leads to the opening of electricity markets, where the optimization problem is moved from cost optimization to profit maximization. Based on the microeconomic theory of perfect competition, all producers can maximize their profit by bidding energy at their marginal cost [3, 4]. The competition is generally based on the pool electricity market, which allows GENCOs and customers to submit their supply and demand bids for each trading period to the ISO. The ISO clears the electricity market by aggregating and matching these bids to determines the dispatched power of each GENCO, demand level of the customer, and the market-clearing price (MCP) [5]. GENCOs try to maximize the social profit by bidding energy at a minimum cost respecting constraint in their production units. These include equality and inequality constraints, production capacity limits, and ramp/rate limits, also load balance constraint and transmission losses. Customers try to increase their benefit, where they have the choice of their suppliers using a bidding strategy [6, 7]. ISO may perform a BBDED, to achieve the objective of GENCOs and customers, considering demand and supply bids over trading periods, including multiplayer bidding strategy.
Many researchers have proposed various methods such as efficient interior-point (IP) algorithm [8], particle swarm optimization (PSO), linear programming (LP) [9], isolation niche immune genetic algorithm (INIGA) [10], differential evolution (DE) [11], evolutionary algorithm (EA) [12], quadratic programming (QP) [13], symbiotic organisms search (SOS), [14] and multi-echelon (ME) [15] to solve various BBDED problems. In this paper, an improved simulated annealing (ISA) algorithm, which is a heuristic method, is presented and proposed for solving the BBDED problem. The power dispatch is made via a competitive pool power market where participants aim to achieve maximum social profit and benefit. Therefore, the proposed ISA is feasible to solve the BBDED problem if it provides optimal solutions using a probabilistic approach to accept candidate solutions with less computation time.
This paper is organized as follows: Section 2 introduces the mechanism of the competitive pool electricity market. In section 3, the BBDED problem is formulated and presented. Solution methodology is proposed and explained in section 4. The simulation study cases and the obtained results are presented and discussed in section 5. Section 6 despites a conclusion and future perspectives.
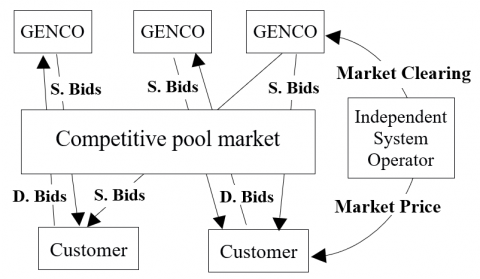
The bidding mechanism is studied in a day-ahead competitive pool market where the main market agents are GENCOs, customers, and ISO. When the pool market is operated centrally, an organization known as the independent system operator is created. This ISO has two essential roles. Firstly, it manages the market to facilitate commercial transactions between GENCOs and customers. Secondly, it improves the reliability of the transmission system. In this model, the MCP is set according to the interplay of participants as shown in Figure 1 [16].
Figure 1. Competitive pool electricity market structure
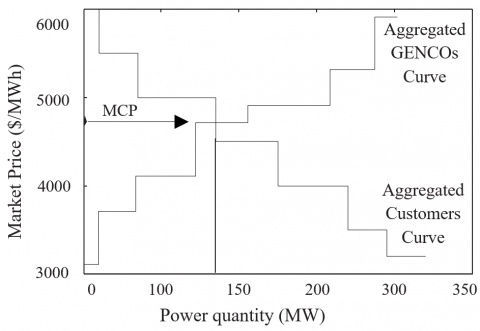
The market-clearing process is performed by ISO using an optimization dispatch approach considering the bids submitted by GENCOs and customers. GENCO’s supply bid is the minimal requested price that the GENCO would accept to supply a given amount of electrical energy. Likewise, the demand bid is the maximal price that the customer would agree to pay to consume a given amount of power, and then ISO. Based on the aggregation of the received bids, a graph is created, showing a cumulative function of energy and price of the offered quantity by GENCOs, as shown in Figure 2.
Figure 2. Electricity market clearing process
It is known as the supply-side curve of the electricity market. Moreover, the demand-side curve can be obtained by asking customers to bid the amount they request at the price of the power they are willing to pay. Therefore, unless the function of the demand-side is reduced, the price rises. The MCP is set by the intersection between these curves. The dispatch role is to clear the electricity market to determine supply and demand quantities, market price, the social profit of GENCOs, and the benefit of customers while minimizing the total cost of production at a given period [17, 18].
The optimization problem in the BBDED mathematical model is formulated as an objective function based on social profit maximization in a centralized electricity market considering the received bids from GENCOs and customers. The dispatching problem is performed based on these bids and defined as the customers' total benefit minus the total production cost of GENCOs, where the bid price of participants is therefore estimated with a quadratic function to simplify the computation.
3.1 Objective function
The objective function is expressed with the following equation:
$\text{Max(PF}{{\text{)}}_{{}}}=\sum\limits_{t=1}^{T}{\left[ \sum\limits_{j=1}^{Nc}{{{B}_{j}}({{D}_{j,t}})-\sum\limits_{i=1}^{Ng}{{{C}_{i}}(P{{g}_{i,t}})}} \right]}$ (1)
${{B}_{j}}\left( {{D}_{j,t}} \right)={{a}_{dj}}{{D}_{j,t}}^{2}+{{b}_{dj}}{{D}_{j,t}}+{{c}_{dj}}$ (2)
${{C}_{i}}\left( P{{g}_{i,t}} \right)={{a}_{gi}}P{{g}_{i,t}}^{2}+{{b}_{gi}}P{{g}_{i,t}}+{{c}_{gi}}$ (3)
where,
Bj(Dj,t): Benefit function of the customer j;
Ci(Pgi,t): Cost function of the generator i;
Dj,t: Demand bid quantity offered by customer j at period t;
Pgi,t : Supply bid quantity offered by generator i at period t;
Nc: Customers number;
Ng: Generators number;
adj, bdj, cdj: Benefit coefficients of customer j;
agi, bgi, cgi: Cost coefficients of generator i;
j: 1, 2, … Nc;
i: 1, 2, ... Ng;
t: 1, 2, …T: Period number.
The objective function is formulated with two functions. The first is the benefit function of customers. To maximize benefit, customers should develop their bidding strategies using price bidding coefficients (adj) and (bdj). These strategies are classed as high bidding, medium bidding, and low bidding according to each strategy bid price coefficients. The bidding strategy optimization model was carried out based on literature. It is demonstrated experimentally by authors that for high bidding, the customer's coefficient (adj)≥0.09, for medium bidding, the customer's coefficient (adj) is within a value of 0.05, and for low bidding, the customer's coefficient (adj)≤0.01. It is also proposed to formulate the customer bid price coefficient (bdj) according to the inequality 0<(bdj)<λm, where, (λm) is the energy clearing price [19]. The second term is the cost function of generators. GENCOs must act as price takers and bid energy at their marginal production cost to maximize the social profit and reach the objective function in the competitive market, as discussed in section 1, under the following equality, inequality, and ramp rate limit constraints.
3.2 Equality constraint
Equality constraint is formulated as follows:
$\sum\limits_{i=1}^{Ng}{P{{g}_{i,t}}=}\sum\limits_{j=1}^{Nc}{{{D}_{j,t}}}+{{P}_{L}}$ (4)
where, PL: Transmission losses are given with B-coefficients as follows:
${{P}_{L}}(P{{g}_{i,t}})=\sum\limits_{i=1}^{Ng}{\sum\limits_{j=1}^{Ng}{P{{g}_{i,t}}{{B}_{i,j}}}}P{{g}_{j,t}}+\sum\limits_{I=1}^{Ng}{{{B}_{i,0}}P{{g}_{i,t}}}+{{B}_{0,0}}$ (5)
3.3 Inequality constraint
The power output of the generator is between lower and upper limits. It is designed to produce power in a secure interval to avoid over or underproduction when meeting the load demand.
$P{{g}_{i,,t\min }}\le P{{g}_{i,t}}\le P{{g}_{i,t\max }}$ (6)
The bid quantity of a customer is defined between a maximum and minimum limit to maintain the equilibrium with the supply side.
${{D}_{j,t\min }}\le {{D}_{j,t}}\le {{D}_{j,t\max }}$ (7)
3.4 Ramp rate limit constraints
The power output of the generator is also limited within the ramp rate limit. It expresses the rate at which the production of a power unit is changed, either by increasing (increase) or decreasing (decrease). It is therefore expressed in a unit of power over time (MW per minute).
$D{{R}_{i}}\le P{{g}_{i,t}}-P{{g}_{i,(t-1)}}\le U{{R}_{i}}$ (8)
where, DRi: Maximum decrease power (ramp-down) of the generator i during a period; URi: Maximum increase power (ramp-up) of the generator i during a period.
4.1 Simulated annealing and optimization
The simulated annealing (SA) is a technique used in many optimization fields. It uses the similarity of the minimization process and molten metal cooling. It was proposed in 1953 by Metropolis to obtain the thermodynamic condition of an annealed system at a simulated temperature T [20]. It has the potential to find optimal global or near-global solutions. It is used to solve many power system problems. The SA method is based on a physical annealing process where T, known as temperature, is selected, and molten metal is slowly cooled from a higher temperature to a lower temperature until it solidifies. The iteration number of the optimization problem is identical to the level of the temperature in this technique. In every iteration tries, generating a candidate solution is carried out. If the solution generated is the better one, then a new candidate solution will be generated using this solution. If not, it is an unsuccessful solution. The acceptance of this solution will depend on an acceptance probability Pr (Δ) when it is higher than a number randomly selected in the interval of [0,1].
${{P}_{r}}\left( \Delta F \right)=1/\left[ 1+\exp \left( \Delta F/T \right) \right]$ (9)
where, (ΔF) is the level of degradation that occurs when the new solution is generated compared to the current solution. The term T represents the temperature level where the new solution is to be generating. When solutions are unsuccessful and accepted as described previously, this allows the simulated annealing to move away from the optimal local solution and search for the optimal global solution. Each of the accepted solutions will be utilized for generating a new candidate solution. The current one is affected by a certain probabilistic function with the repetition of a specific number of tries. Then, in the following iteration, the final successful candidate solution is considered the initial solution for generating the next candidate solution. The process continues, while the temperature is decreasing with the following iterations with a cooling factor as given in the expression.
${{T}^{k}}={{\alpha }_{{}}}{{T}_{0}}$ (10)
where, T0: Initial temperature; Tk: Temperature at iteration k; α: Temperature decrease factor.
Therefore, as T decreases, the value of Pr (Δ) decreases. This solution process remains until the maximal iteration number is achieved, or the optimum solution is obtained [21, 22]. The correspondence between the SA technique considering the metal annealing process and the solution process in the optimization problem is presented in Table 1.
Table 1. The simulated annealing implementation process for solving the optimization problem
|
SA process |
Solving process |
|
Metallurgical materials |
Optimization problem |
|
Energy |
Objective function |
|
Temperature |
Controlling parameter |
|
Materials states |
Solutions |
|
States of materials with a lower energy content |
Optimal solution |
4.2 Proposed ISA algorithm
The proposed ISA algorithm is implemented and modified to solve a BBDED problem. The ISA is applied to search and find the optimal solutions for different parameters like generation cost, customer benefit, and the social profit after the dispatching GENCOs power on customers' demand in the most economical operation, as described above, for the objective of social profit maximization. The solutions need to be generated in the neighborhood of current ones while the solution perturbation range decreases with temperature decrease. Hence, the algorithm can generate feasible solutions.
The proposed ISA algorithm is described using the flowchart shown in Figure 3 and given as pseudo-code in Algorithm 1.
Figure 3. The flowchart of the ISA algorithm
|
Algorithm 1. The proposed ISA algorithm |
|
1. Begin 2. Initialize (random solution S, initial temperature T0, global iteration count C) 3. S best$\longleftarrow$S current; 4. C$\longleftarrow$0; 5. T$\longleftarrow$T0; 6. Iterative Processes 7. NTiter$\longleftarrow$0; 8. While (NTiter < NTmax) 9. C$\longrightarrow$C+1; NTiter$\longleftarrow$NTiter+1; 10. Generate a neighbor random solution S’ $\in$N (S current) and compute objective function ‘MaxPF’ (PF) 11. If (PF(S’) > PF (S current); 12. S current$\longleftarrow$S’; 13. If (PF(S’) > PF (S best); 14. S best$\longleftarrow$S’; 15. Else 16. ΔPF$\longrightarrow$PF (S best) - (S current); 17. Prob (ΔPF, T)$\longleftarrow$exp (-ΔPF/T) 18. Randomize r in (0,1) 19. If r > exp(-ΔPF/T) 20. S current$\longrightarrow$S’; 21. If PF (S best) > (S current); 22. S best$\longleftarrow$S’; 23. End 24. Decrease temperature with a cooling coefficient 25. T = α T; (0 < α < 1); 26. End 27. End |
Each of the results discussed in this paper was obtained using the proposed improved simulated annealing algorithm to solve the bid-based dynamic economic dispatch problem. Bidding strategies are implemented to model the competitive electricity market in trading-periods and applied in three study cases. The ISA algorithm is developed in MATLAB environment and used to search for optimal solutions, which are the optimized values of the outputs after the market-clearing and dispatch the supplied power of GENCOs to the customers' demand. The iteration number is set to 300 iterations. Table 2 presents the parameters for the proposed ISA algorithm.
Table 2. Proposed ISA parameters
|
Initial temperature |
alpha |
Max tries |
Final temperature |
|
20℃ |
0.99 |
10 e3 |
0.1℃ |
5.1 Study case 1
In this case, a 5-bus power system with 3 GENCOs and 2 customers connected via 6 transmission lines is considered. For GENCOs, the fuel cost coefficients are taken as price bids to represent the producers' bidding strategy. For customers demand, bids are represented as a fixed bidding strategy and taken from the study [8] and given in Tables 3 and 4.
Table 3. Generators bid data for the 3-unit system
|
Gen |
agi ($/MWh2) |
bgi ($/MWh) |
cgi ($) |
Pmin (MW) |
Pmax (MW) |
URi (MW/h) |
DRi (MW/h) |
|
1 |
0.001562 |
7.92 |
560 |
0 |
600 |
20 |
20 |
|
2 |
0.00194 |
7.85 |
310 |
0 |
400 |
40 |
40 |
|
3 |
0.00482 |
7.97 |
78 |
0 |
200 |
20 |
20 |
Table 4. Customers bid data
|
|
Customer 1 |
Customer 2 |
|
adj ($/MWh2) |
-0.175 |
-0.150 |
|
bdj ($/MWh) |
100 |
110 |
|
Load demand at period 1 (Dmin to Dmax) (MW) |
400 to 650 |
200 to 350 |
|
Load demand at period 2 (Dmin to Dmax) (MW) |
200 to 300 |
300 to 400 |
Transmission line losses are considered in this case and represented by B-coefficients matrix as follow [23]:
${{B}_{ij}}={{1}_{{}}}{{e}^{-5}}\left[ \begin{align} & \begin{matrix} 3.00 & 0.00 & 0.00 \\ \end{matrix} \\ & \begin{matrix} 0.00 & 9.00 & 0.00 \\ \end{matrix} \\ & \begin{matrix} 0.00 & 0.00 & 12.0 \\ \end{matrix} \\ \end{align} \right]$
The bid data of GENCOs and customers and B-coefficients are taken as inputs in the proposed ISA algorithm. In this study, participant bid quantities are allocated optimally over two trading periods. The overall bid-based dispatch results are presented in Table 5 and Figure 4.
Table 5. Results of bid-based dispatch for 3-unit system
|
Outputs |
Period 1 |
Period 2 |
|
P1 (MW) |
261.7319 |
282.2205 |
|
P2 (MW) |
295.1013 |
239.4151 |
|
P3 (MW) |
176.7867 |
77.9605 |
|
Total generation (MW) |
733.6199 |
599.5961 |
|
D1 (MW) |
400 |
259.8537 |
|
D2 (MW) |
332.5900 |
338.9802 |
|
Total demand (MW) |
732.5931 |
598.8340 |
|
Total losses (MW) |
1.2067 |
0.7621 |
|
Generation cost ($) |
7173.0412 |
5948.8465 |
|
Customers benefit ($) |
31992.3593 |
34220.366 |
|
Social profit ($) |
24819.318 |
28271.5198 |
|
CPU Time/iteration (sec) |
0.0224 |
0.0123 |
|
Total Gen cost ($) |
13121.88 |
|
|
Total Customers benefit ($) |
66212.72 |
|
|
Total Social profit ($) |
53090.83 |
|
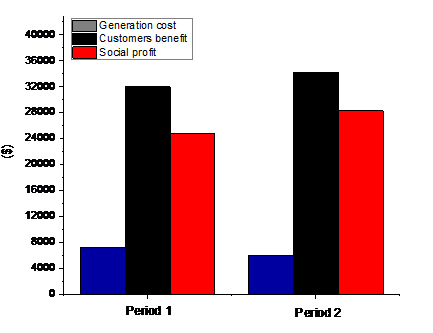
Figure 4. Outputs for two periods
It can be seen that all GENCOs and customers respect power limits (supply and demand). ISA has dispatched the three generating companies produced power with 733.6199 MW to satisfy a total demand of 732.5931 MW for the customer 1 and customer 2 in trading period 1. Similarly, in period 2, generating companies have supplied 599.5961 MW to customer 1 and customer 2 for a total demand of 598.8340 MW. From period 1 to period 2, social profit is maximized with 3452.2018 \$ (from 24819.318 \$ to 28271.5198 \$). The customers benefit also increased with 2228.0067 \$ (from 31992.3593 \$ to 34220.366 \$) due to the minimization of generation cost with 1224.1947 \$ (from 7173.0412 $ to 5948.8465 $). Total system losses are also dropped with 0.4446 MW (from 1.2067 MW to 0.7621 MW) when the demand is decreased.
Lin and Chen [8], and Zhao et al. [9] concluded that LP and PCIPQP had proven the effectiveness in providing better results in solving the BBDED problem. To verify and validate the potential of the proposed ISA algorithm, the bid-based dispatch results are compared to LP and PCIPQP approaches and presented in Table 6.
Table 6. Results comparison
|
Approach |
Total Gen cost ($) |
Total Customers benefit ($) |
Total Social profit ($) |
|
LP [9] |
13426 |
64372 |
50936 |
|
PCIPQP [8] |
13158 |
66246 |
53088 |
|
ISA |
13121.88 |
66212.72 |
53090.83 |
We have seen that PCIPQP has achieved total customers benefit of 66246 \$, which is higher than the proposed ISA and LP approaches with 33.28 \$ and 1874 \$, respectively.
The proposed ISA has performed better compared to other approaches by achieving a total social profit of 53090.83 \$ which is higher than the LP, and PCIPQP approaches with 2154.83 \$ and 2.83 \$ respectively due to the optimized cost obtained with 13121.88 \$ which is minimized than PCIPQP and LP with 36.12 \$ and 304.12 \$ respectively. The statistical and computational comparison indicates that the ISA approach is feasible for providing better solutions than the other methods.
Figure 5 shows the convergence curve of the proposed ISA algorithm for solving the BBDED problem of the 3-unit system.
Figure 5. Total social profit convergence characteristic of 3 unit-system
5.2 Study case 2
In the second case, a medium power system with 30-bus, including 6-GENCOs and 2 customers connected via 41 transmission lines, is used. GENCOs data are taken from Ref. [11] and given in Table 7.
Table 7. Generators bid data for the 6-unit system
|
Gen |
agi ($/MWh2) |
bgi ($/MWh) |
cgi ($) |
Pmin (MW) |
Pmax (MW) |
URi (MW/h) |
DRi (MW/h) |
|
1 |
0.00375 |
2.00 |
0 |
50 |
200 |
65 |
85 |
|
2 |
0.01750 |
1.75 |
0 |
20 |
80 |
12 |
22 |
|
3 |
0.00625 |
1.00 |
0 |
15 |
50 |
12 |
15 |
|
4 |
0.00834 |
3.25 |
0 |
10 |
35 |
08 |
16 |
|
5 |
0.02500 |
3.00 |
0 |
10 |
30 |
06 |
09 |
|
6 |
0.02500 |
3.00 |
0 |
12 |
40 |
08 |
16 |
The transmission line losses are considered and represented by B-coefficients matrix as follow [24]:
${{B}_{ij}}={{1}_{{}}}{{e}^{-4}}\left[ \begin{align} & \begin{matrix} \begin{matrix} \begin{matrix} \begin{matrix} \begin{matrix} 2.00 & 0.10 \\ \end{matrix} & 0.15 \\ \end{matrix} & 0.05 \\ \end{matrix} & 0.00 \\ \end{matrix} & -0.3 \\ \end{matrix} \\ & \begin{matrix} \begin{matrix} \begin{matrix} \begin{matrix} 0.10 & 3.00 \\ \end{matrix} & -0.2 & 0.01 \\ \end{matrix} & 0.12 \\ \end{matrix} & 0.10 \\ \end{matrix} \\ & \begin{matrix} 0.15 & -0.2 & 1.00 & \begin{matrix} \begin{matrix} -0.1 & 0.10 \\ \end{matrix} & 0.08 \\ \end{matrix} \\ \end{matrix} \\ & \begin{matrix} 0.05 & 0.01 & \begin{matrix} -0.1 & 1.50 & 0.06 & 0.50 \\ \end{matrix} \\ \end{matrix} \\ & \begin{matrix} 0.00 & 0.12 & 0.10 & \begin{matrix} \begin{matrix} 0.06 & 2.50 \\ \end{matrix} & 0.20 \\ \end{matrix} \\ \end{matrix} \\ & \begin{matrix} \begin{matrix} \begin{matrix} \begin{matrix} -0.3 & 0.10 \\ \end{matrix} & 0.08 \\ \end{matrix} & 0.50 \\ \end{matrix} & 0.20 & 2.10 \\ \end{matrix} \\ \end{align} \right]$
For the customers, bids are represented with low, medium, and high bidding strategies. The BBDED is solved under bidding strategies to study its impact on the market during two trading periods. The customers' data are taken from the study [11] and given in Table 8.
Table 8. Customers bid data
|
|
Customer 1 Low/Medium/High |
Customer 2 Low/Medium/High |
|
adj ($/MWh2) |
-0.06/ 0.07/ 0.1 |
-0.08/0.05/ 0.09 |
|
bdj ($/MWh) |
20 |
15 |
|
Load demand at period 1 (Dmin to Dmax) (MW) |
100 to 150 |
50 to 100 |
|
Load demand at period 2 (Dmin to Dmax) (MW) |
20 to 70 |
100 to 200 |
a) Low bidding strategy
In this case, the bid coefficient (adj) is taken for customer 1 and customer 2 to be -0.06 \$/MWh2 and -0.08 \$/MWh2, respectively. The bid coefficient (bdj) for customer 1 is assumed to be 20 \$/MWh, and for customer 2 is considered to be 15 \$/MWh. The energy clearing price is supposed to be 20 \$/h during the two periods. In the first period, customer 1 submit a bid of 100 MW at the minimum, and at maximum, a bid of 150 MW and customer 2 submit a bid of 50 MW at the minimum and, at maximum, a bid of 100 MW. Table 9 presents the results obtained under the low bidding strategy.
Table 9. Results of bid-based dispatch for low strategy
|
Outputs |
Period 1 |
Period 2 |
|
P1 (MW) |
88.8516 |
50.00 |
|
P2 (MW) |
58.5893 |
80.00 |
|
P3 (MW) |
38.2288 |
17.3817 |
|
P4 (MW) |
10.4977 |
10.0039 |
|
P5 (MW) |
10.1144 |
10.0101 |
|
P6 (MW) |
12.00 |
12.0068 |
|
Total generation (MW) |
218.282 |
179.4049 |
|
D1 (MW) |
132.157 |
70.00 |
|
D2 (MW) |
83.1840 |
106.8051 |
|
Total demand (MW) |
215.341 |
176.8051 |
|
Total losses (MW) |
2.94081 |
2.5998 |
|
Generation cost ($) |
501.814 |
486.1581 |
|
Customers benefit ($) |
2266.40 |
1849.1 |
|
Social profit ($) |
1764.59 |
1362.94 |
|
CPU Time/iteration (sec) |
0.0119 |
0.0184 |
|
Total Gen cost ($) |
987.97 |
|
|
Total Customers benefit ($) |
4115.50 |
|
|
Total Social profit ($) |
3127.54 |
|
After the BBDED dispatch, all GENCOs and customers have respected the power capacity limits. Participant bid quantities are allocated and dispatched optimally by the ISA algorithm over the two periods. The period 1 has shown that for a 215.341 MW of customers bid demand. GENCOs submit 218.282 MW. In period 2, the customers' bid demand is decreased to 176.8051 MW, which made GENCOs reduce its supply to 179.4049 MW. After the market-clearing, it can be seen that from period 1 to period 2, generation cost is decreased with 15.6559 \$ (from 501.814 \$ to 486.1581 \$), and the customers benefit also decreased with 417.3 \$ (from 2266.40 \$ to 1849.1 \$) which has led to the reduction of social profit with 401.65 \$ (from 1764.59 \$ to 1362.94 \$). Also, total system losses are dropped with 0.341 MW when the demand is decreased.
b) Medium bidding strategy
In this case, the bid coefficient (adj) is taken for customer 1 and customer 2 to be 0.07 \$/MWh2 and 0.05 \$/MWh2 respectively. The bid coefficient (bdj) and the power demand of customers are taken as in low bidding case during the two trading periods. The results obtained under the medium bidding strategy are presented in Table 10.
Table 10. Results of bid-based dispatch for medium strategy
|
Outputs |
Period 1 |
Period 2 |
|
P1 (MW) |
91.6388 |
112.5598 |
|
P2 (MW) |
80.00 |
80.00 |
|
P3 (MW) |
50.00 |
50.00 |
|
P4 (MW) |
10.0598 |
10.24595 |
|
P5 (MW) |
10.00 |
10.07445 |
|
P6 (MW) |
12.2890 |
12.07805 |
|
Total generation (MW) |
254.0519 |
274.9583 |
|
D1 (MW) |
150 |
70 |
|
D2 (MW) |
100 |
200 |
|
Total demand (MW) |
250 |
270 |
|
Total losses (MW) |
4.0519 |
4.95834 |
|
Generation cost ($) |
639.2998 |
695.072 |
|
Customers benefit ($) |
6575 |
6743 |
|
Social profit ($) |
5935.7 |
6047.92 |
|
CPU Time/iteration (sec) |
0.0117 |
0.0134 |
|
Total Gen cost ($) |
1334.37 |
|
|
Total Customers benefit ($) |
13318 |
|
|
Total Social profit ($) |
11983.62 |
|
In this case, the GENCOs have supplied a 254.0519 MW of power to customers for the demand of 250 MW in the period 1. For period 2, GENCOs have increased their supply with 274.9583 MW to meet the customers' demand with 270 MW. After the market-clearing, we have seen that from period 1 to period 2, social profit is maximized with 112.22 \$ (from 5935.7 $ to 6047.92 $) due to the higher received customers benefit which is also increased with 168 \$ (from 6575 \$ to 6743 \$). Moreover, total system losses are slightly augmented with 0.906 MW when the demand is increased.
c) High bidding strategy
The bid coefficient (adj) is taken as 0.1 \$/MWh2 for customer 1 and 0.09 \$/MWh2 for customer 2. The bid coefficient (bdj) and the power demand of customers are taken as in the previous cases during the two trading periods. The results obtained under the high bidding strategy are presented in Table 11.
Table 11. Results of bid-based dispatch for high strategy
|
Outputs |
Period 1 |
Period 2 |
|
P1 (MW) |
91.8134 |
112.6966 |
|
P2 (MW) |
80.00 |
80.00 |
|
P3 (MW) |
50.00 |
50.00 |
|
P4 (MW) |
10.0822 |
10.0657 |
|
P5 (MW) |
10.0441 |
10.0606 |
|
P6 (MW) |
12.1182 |
12.1409 |
|
Total generation (MW) |
254.0580 |
274.9640 |
|
D1 (MW) |
150 |
70 |
|
D2 (MW) |
100 |
200 |
|
Total demand (MW) |
250 |
270 |
|
Total losses (MW) |
4.0580 |
4.96402 |
|
Generation cost ($) |
638.99 |
696.99 |
|
Customers benefit ($) |
7650 |
8490 |
|
Social profit ($) |
7011.01 |
7793.01 |
|
CPU Time/iteration (sec) |
0.0164 |
0.0183 |
|
Total Gen cost ($) |
1335.98 |
|
|
Total Customers benefit ($) |
16140 |
|
|
Total Social profit ($) |
14804.02 |
|
Figure 6. Outputs comparison under bidding strategies
In this case, the customers' demand was the same as in the medium bidding strategy. GENCOs has supplied customers with 254.0580 MW for period 1 and with 274.9640 MW for period 2. Table 11 has shown that the generation cost of both periods remains nearly the same as in the medium bidding strategy case. The benefit of customers is increased with 840 \$ (from 7650 \$ to 8490 \$), which led to the maximization of social profit with 782 \$ (from 7011.01 \$ to 7793.01 \$). Total system losses are dropped with 0.906 MW.
Figure 6 shows the comparison between bidding strategies after the market-clearing for the two trading periods.
Therefore, it is concluded that in the high bidding strategy, the customers have received a total benefit with 16140 \$ which is higher compared to medium and low bidding strategies with 2822 \$ and 12024.5 \$ respectively, which has led the generating companies to obtain a maximal social profit for the high strategy with 14804.02 \$ which is higher than medium and low bidding strategies with 2820.58 \$ and 11676.66 \$ respectively.
The proposed ISA is evaluated by comparison with other approaches applied to the same power system as PSO, DE, and symbiotic organisms search (SOS) approaches and presented in Table 12.
From Table 12 it can be seen that the SOS has achieved a total social profit of 3199.60 \$ which is higher than the proposed ISA, DE, and PSO approaches with 72.06 \$, 88.1 \$, and 1566.8 \$ respectively, just in low bidding strategy with an optimized generation cost of 901.6 \$. In medium bidding strategy, ISA has performed better by achieving a total social profit of 11983.62 \$, which is higher than the SOS, DE, and PSO approaches with 35 \$, 97.12 \$, and 1770.62 \$ respectively with an optimized generation cost of 1334.37 \$. In the high bidding strategy, ISA has performed better than the other approaches by achieving a total social profit of 14804.02 \$, which is higher than the SOS, DE, and PSO approaches with 33.32 \$, 95.52 \$, and 1027.02 \$ respectively, with an optimized generation cost of 1335.98 \$. The received total customers benefit in low bidding strategy is higher and nearly equal of all approaches with 4101.5 \$ except for the PSO method, which is 3483.8 \$. In medium strategy, the customers' benefit is equal for DE, SOS, and the proposed ISA with 13318 \$ and lower for PSO with 12141 \$ and also the same for DE, SOS, and ISA with 16140 \$ and lower for PSO with 15570.5 \$ in high strategy. The comparative analysis has shown that the ISA approach can provide better solutions compared to other methods.
Table 12. Results comparison
|
Bidding Strategy |
Approach |
Total Gen cost ($) |
Total Customers benefit ($) |
Total Social profit ($) |
|
Low Bidding |
PSO [11] |
1851.0 |
3483.8 |
1632.80 |
|
DE [11] |
989.72 |
4101.3 |
3111.50 |
|
|
SOS [14] |
901.6 |
4101.3 |
3199.60 |
|
|
ISA |
987.97 |
4115.5 |
3127.54 |
|
|
Medium Bidding |
PSO [11] |
1928.2 |
12141 |
10213.00 |
|
DE [11] |
1431.5 |
13318 |
11886.50 |
|
|
SOS [14] |
1369.9 |
13318 |
11948.00 |
|
|
ISA |
1334.37 |
13318 |
11983.62 |
|
|
High Bidding |
PSO [11] |
1793.1 |
15570.5 |
13777 |
|
DE [11] |
1431.5 |
16140 |
14708.5 |
|
|
SOS [14] |
1369.2 |
16140 |
14770.7 |
|
|
ISA |
1335.98 |
16140 |
14804.02 |
The convergence curves of 6-unit systems for solving the BBDED problem using the proposed ISA with three bidding strategies are shown in Figure 7.
Figure 7. Total social profit convergence characteristic of 6 unit-system under bidding strategies
5.3 Study case 3
Presumably, the ISA algorithm has provided optimal solutions in solving the bid-based dispatch by providing solutions to the dispatched supply and demand power, the generation costs, the customers' benefits, and the social profits for the two previous studies cases that include medium power systems. In this case, the proposed ISA is performed on a large-scale power system with 40 GENCOs and 11 customers, to test its feasibility and robustness in solving the BBDED problem under high bidding strategy. To achieve a better overall performance of the proposed ISA for a larger system, the initial temperature, and maximum tries are increased to 30℃ and 15000 respectively. For GENCOs, bid price coefficients, limits of the bid quantities data are taken from [25]. For the customers, bid data are generated using the high bidding strategy with the authors' recommendations in ref. [12, 19] and given in Table 13. Total load demand, therefore, ranges from 10.360 MW to 14.060 MW for 6 periods and presented in Table 14. Transmission losses have been neglected because of the unavailability of relevant data for validation in the literature.
Table 13. Customers bid data
|
Customers |
D1 |
D2 |
D3 |
D4 |
D5 |
D6 |
D7 |
D8 |
D9 |
D10 |
D11 |
|
adj ($/MWh2) |
0.1 |
0.099 |
0.098 |
0.097 |
0.096 |
0.095 |
0.094 |
0.093 |
0.092 |
0.091 |
0.09 |
|
bdj ($/MWh) |
20 |
19 |
18 |
17 |
16 |
15 |
14 |
13 |
12 |
11 |
10 |
Table 14. Load demand for 6 period
|
Periods |
D1 (MW) |
D2 (MW) |
D3 (MW) |
D4 (MW) |
D5 (MW) |
D6 (MW) |
D7 (MW) |
D8 (MW) |
D9 (MW) |
D10 (MW) |
D11 (MW) |
Total (MW) |
|
1 |
1300 |
1000 |
1200 |
1100 |
1060 |
1100 |
1000 |
700 |
500 |
800 |
600 |
10360 |
|
2 |
1400 |
1300 |
1200 |
900 |
1000 |
1000 |
900 |
900 |
800 |
600 |
500 |
10500 |
|
3 |
1040 |
1300 |
1200 |
1400 |
900 |
1100 |
1200 |
1300 |
700 |
900 |
800 |
11840 |
|
4 |
1080 |
1300 |
1500 |
1400 |
900 |
1100 |
1200 |
1400 |
700 |
1000 |
1000 |
12580 |
|
5 |
1500 |
1100 |
1300 |
1220 |
1200 |
1400 |
1100 |
1200 |
1000 |
1200 |
1100 |
13320 |
|
6 |
1700 |
1800 |
1560 |
1200 |
1600 |
1500 |
1000 |
1000 |
1000 |
800 |
900 |
14060 |
Figure 8. Outputs under high bidding strategy
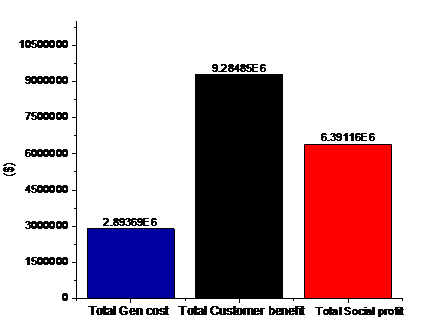
Figure 9. Total optimized bid-based
However, increasing initial temperature and maximum tries has made the convergence process slower but accurate. Figure 8 shows the overall bid-based dispatch results under the high bidding strategy during the 6-trading periods to evaluate the performance of the proposed ISA with the variation of demand bids of customers in a large power system.
It can be seen that the total social profit is maximized when the demand and customers benefit are increased, and the total generation cost is minimized over trading periods. In this situation, the total social profit is 1043977.95 \$ in period 1, which it is maximized over period 2, 3, 4, with 38553.66 \$, 262321.84 \$, and 401026.48 \$, respectively, due to the higher received customers benefit in these periods which was 1165175.6 \$ for period 1. It has been increased by 40534.4 \$, 284964.4 \$, and 458224.4 \$ for period 2, period 3, and period 4, respectively. But for periods 5 and 6, the total social profit is decreased with 76251.5 \$ and 498353.5 \$ due to the significant increase in generation cost.
Figure 9 shows the total optimized values of all trading periods. An optimized total generation cost of 2893688.47 \$, a total customer benefit of 9284853.2 \$, and a maximum total social profit of 6391164.68 \$ are obtained after the market-clearing.
The obtained results, in this case, have confirmed the feasibility of the proposed ISA to provide optimum solutions in solving the BBDED problem for a larger power system with the satisfaction of all mentioned constraints above.
In this paper, the BBDED problem is solved using an improved simulated annealing algorithm. The proposed ISA has been applied for two medium test systems and a large-scale power system. In the first part of this study, the proposed ISA was adopted to model an electricity market, enabling the customer to choose its generating company and studying the variation of load demand on trading mechanism. In the second part, bidding strategies are implemented, allowing generating companies and customers to select a bidding strategy in a double-sided electricity market. After analyzing the electricity market operation, it is proven that it can affect the market trading where the social profit is maximized when GENCOs and customers submit bids under a high bidding strategy. The method was successfully applied to solve the bid-based dispatch problem by searching and providing optimal solutions with short computation time for different parameters such as generation cost, customers benefit, and the calculation of social profit. The objective of determining and dispatching the economic generation and demand level of participants is carried out to achieve a maximum social profit while satisfying all operating constraints. In the third part, the method was applied and successfully tested on a large-scale power system to demonstrate and verify its optimality and robustness by balancing and dispatching the submitted bids in a larger electrical system. The numerical analysis and the comparison to other methods have shown the superiority of the proposed ISA for providing better results. Future work will involve and investigate the impact of emission constraints and renewable energy sources when solving the BBDED problem in a competitive electricity market.
[1] Ghazvini, M.A.F., Ramos, S., Soares, J., Castro, R., Vale, Z. (2019). Liberalization and customer behavior in the Portuguese residential retail electricity market. Utilities Policy, 59: 100919. https://doi.org/10.1016/j.jup.2019.05.005
[2] Mahmoud, K., Abdel-Nasser, M., Mustafa, E., Ali, Z.M. (2020). Improved salp–swarm optimizer and accurate forecasting model for dynamic economic dispatch in sustainable power systems. Sustainability, 12(2): 576. http://dx.doi.org/10.3390/su12020576
[3] Mathur, S.P., Arya, A., Dubey, M. (2017). Optimal bidding strategy for price takers and customers in a competitive electricity market. Cogent Engineering, 4(1): 1358545. http://dx.doi.org/10.1080/23311916.2017.1358545
[4] Ngadiron, Z., Radzi, N.H., Hassan, M.Y., Bansal, R.C. (2018). The economic benefits of generation revenue and demand payment assessment in pool-based market model: The case of Malaysia. Electric Power Components and Systems, 46(1): 56-68. http://dx.doi.org/10.1080/15325008.2018.1432724
[5] Lekshmi, R.R., Swathy, S., Lakshmi, B., Sai, N.V., Vijaykumar, V.S. (2018). Market clearing mechanism considering congestion under deregulated power system. Procedia Computer Science, 143: 686-693. https://doi.org/10.1016/j.procs.2018.10.447
[6] Khojasteh, M., Jadid, S. (2015). Decision-making framework for supplying electricity from distributed generation-owning retailers to price-sensitive customers. Utilities Policy, 37: 1-12. http://dx.doi.org/10.1016/j.jup.2015.03.002
[7] Goroohi Sardou, I., Ansari, M. (2020). Risk-constrained self-scheduling of a generation company considering natural gas flexibilities for wind energy integration. Journal of Renewable and Sustainable Energy, 12(1): 013301. http://dx.doi.org/10.1063/1.5119863
[8] Lin, W.M., Chen, S.J. (2002). Bid-based dynamic economic dispatch with an efficient interior point algorithm. International Journal of Electrical Power & Energy Systems, 24(1): 51-57. http://dx.doi.org/10.1016/S0142-0615(01)00007-2
[9] Zhao, B., Guo, C., Cao, Y. (2004). Dynamic economic dispatch in electricity market using particle swarm optimization algorithm. In IEEE Fifth World Congress on Intelligent Control and Automation, China, pp. 5050-5054. http://dx.doi.org/10.1109/WCICA.2004.1343679
[10] Liao, G.C. (2012). Integrated isolation niche and immune genetic algorithm for solving bid-based dynamic economic dispatch. International Journal of Electrical Power & Energy Systems, 42(1): 264-275. http://dx.doi.org/10.1016/j.ijepes.2012.03.005
[11] Rampriya, B., Mahadevan, K., Kannan, S. (2012). Application of differential evolution to dynamic economic dispatch problem with transmission losses under various bidding strategies in electricity markets. Journal of Electrical Engineering and Technology, 7(5): 681-688. http://dx.doi.org/10.5370/JEET.2012.7.5.681
[12] Orike, S., Corne, D. (2013). An evolutionary algorithm for bid-based dynamic economic load dispatch in a deregulated electricity market. In IEEE 2013 13th UK Workshop on Computational Intelligence, UK, pp. 313-320. http://dx.doi.org/10.1109/UKCI.2013.6651322
[13] Nwulu, N. (2017). Emission constrained bid based dynamic economic dispatch using quadratic programming. In IEEE 2017 International Conference on Energy, Communication, Data Analytics, and Soft Computing, India, pp. 213-216. http://dx.doi.org/10.1109/ICECDS.2017.8389806
[14] Tiwari, A., Pandit, M. (2016). Bid based economic load dispatch using symbiotic organisms search algorithm. In IEEE 2016 International Conference on Engineering and Technology, India, pp. 1073-1078. http://dx.doi.org/10.1109/ICETECH.2016.7569414
[15] Santosa, B., Rusdiansyah, A. (2018). Cost analysis of an electricity supply chain using modification of price based dynamic economic dispatch in wheeling transaction scheme. In IOP Conference Series: Materials Science and Engineering, 337(1): 012009. https://doi.org/10.1088/1757-899x/337/1/012009
[16] Kirschen, D.S., Strbac, G. (2018). Fundamentals of Power System Economics. John Wiley & Sons. http://dx.doi.org/10.1002/0470020598
[17] Prabavathi, M., Gnanadass, R. (2015). Energy bidding strategies for restructured electricity market. International Journal of Electrical Power & Energy Systems, 64: 956-966. http://dx.doi.org/10.1016/j.ijepes.2014.08.018
[18] Bouddou, R., Benhamida, F., Belgacem, M. (2019). Profit analysis and optimization in a deregulated electricity market using DCOPF based LMP. In IEEE 2019 International Conference on Applied Automation and Industrial Diagnostics, Turkey, pp. 1-6. http://dx.doi.org/10.1109/ICAAID.2019.8934977
[19] Zhang, D., Wang, Y., Luh, P.B. (2000). Optimization based bidding strategies in the deregulated market. IEEE Transactions on Power Systems, 15(3): 981. https://doi.org/10.1109/59.871722
[20] Metropolis, N., Rosenbluth, A., Rosenbluth, M., Teller, A., Teller, E. (1953). Equation of state calculations by fast computing machines. Journal of Chemical Physics, 21(161-162): 1087-1092. https://doi.org/10.1063/1.1699114
[21] Ziane, I., Benhamida, F., Graa, A. (2017). Simulated annealing algorithm for combined economic and emission power dispatch using max/max price penalty factor. Neural Computing and Applications, 28(1): 197-205. http://dx.doi.org/10.1007/s00521-016-2335-3
[22] Wong, S.Y.W. (1998). An enhanced simulated annealing approach to unit commitment. International Journal of Electrical Power & Energy Systems, 20(5): 359-368. https://doi.org/10.1016/s0142-0615(97)00062-8
[23] Frigura-Iliasa, M., Frigura-Iliasa, F.M., Balcu, F.I., Dolga, L., Filipescu, H., Musuroi, S. (2019). Algorithm for solving economical and environmental dispatch problems of thermal power plants. In IOP Conference Series: Earth and Environmental Science, 219(1): 012010. http://dx.doi.org/10.1088/1755-1315/219/1/012010
[24] Dhillon, J., Kumar, P., Jain, S.K. (2018). Optimal power dispatch solution through multi objective formulation. In IEEE International Conference on Intelligent Circuits and Systems, India, pp. 378-381. http://dx.doi.org/10.1109/ICICS.2018.00083
[25] Hagh, M.T., Kalajahi, S.M.S., Ghorbani, N. (2020). Solution to economic emission dispatch problem including wind farms using Exchange Market Algorithm Method. Applied Soft Computing, 88: 106044. http://dx.doi.org/10.1016/j.asoc.2019.106044