Radhouane Moghrani![]() | Zoubir Aoulmi
| Zoubir Aoulmi![]() | Moussa Attia*
| Moussa Attia*![]()
© 2023 IIETA. This article is published by IIETA and is licensed under the CC BY 4.0 license (http://creativecommons.org/licenses/by/4.0/).
OPEN ACCESS
Failure Modes and Effects Analysis (FMEA) is a widely-used technique for enhancing dependability by ranking failure modes according to their Risk Priority Number (RPN). However, RPN has limitations, such as non-injectivity, non-surjectivity, and difficulties in weighing risk variables. The Risk Prioritization Index (RPI) model offers an alternative, addressing some of these limitations and providing user-friendly prioritization of failure modes. This study proposes an integrated risk assessment model that combines the RPI model with Multiple Criteria Decision-Making (MCDM) methods, specifically the Technique for Order Preference by Similarity to Ideal Solution (TOPSIS). The first approach uses entropy, average weight, and scenarios to estimate the impact of risk variables and identify key elements. The second approach combines rankings of failure modes from five RPI models using the integrated MCDM-TOPSIS method. The proposed methods are applied to a case study of a belt conveyor system in a mining company in Bir El Ater, Algeria, demonstrating their effectiveness and dependability.
failure mode and effects analysis (FMEA), risk priority index function (RPI), risk priority number (RPN), multiple criteria decision making (MCDM), technique for order preference by similarity to ideal solution (TOPSIS), mining machine
Failure Mode and Effects Analysis (FMEA) is a structured technique used to identify potential failure modes, their impacts, causes, and associated risks in processes, products, or services. By systematically locating possible failure points and assessing risks, organizations can prioritize areas for improvement. FMEA involves the identification, analysis, and prioritization of risks that may lead to failures. It helps determine the causes of potential failures, their potential impacts, and the likelihood of occurrence. Subsequently, FMEA guides decision-making regarding necessary actions to address the identified risks [1-3].
FMEA promotes an interdisciplinary approach and assists in identifying design risks and potential issues related to processes or products. It enables the identification of risk areas and the development of preventive measures. The benefits of FMEA extend to the manufacturing process, as it allows for the recognition of potential issues and the formulation of plans to mitigate or eliminate risks.
In the field of product design, engineering, and activity planning, FMEA is commonly used to identify and analyze potential failure modes. The traditional FMEA evaluates each failure mode based on its Severity, Occurrence, and Detectability using rating scales. The Risk Priority Number (RPN), calculated using Eq. (1), is a widely adopted approach to rank failure modes based on their criticality within a given risk scenario.
$R P N=S \times O \times D$ (1)
Typically, the most critical failure modes with the highest RPN ratings are used to identify areas that require redesign or intervention [4, 5]. A plan of action and recommendations for management or improvement are then proposed. Engineers iteratively reassess the failure modes to guide them toward more reliable design solutions. Despite its widespread use, FMEA has well-known limitations, primarily related to the non-injective and non-surjective nature of the RPN function [6].
The prioritization of failure modes in FMEA can be uncertain due to the possibility of multiple failure modes receiving the same RPN rating, despite different Severity, Occurrence, and Detectability ratios. Additionally, certain RPN ratings, which range from 1 to 1000 in the conventional method, may never be achieved. The non-surjective nature of the RPN function arises from its non-injective behavior [4].
Several studies have emphasized the importance of considering the relative importance of risk variables in FMEA, as their significance can vary depending on the risk scenario and application field [7, 8]. However, the traditional RPN approach cannot accommodate scenarios where Occurrence is more critical than Severity or where Detectability is the most significant risk factor. The relative importance between the three variables remains fixed regardless of the situation [9, 10]. Furthermore, accurately assessing these risk variables can be challenging for FMEA teams. Current field data may not be suitable for determining risk variables using the RPN method, the team may lack the required expertise for quantitative or qualitative analysis, and field data may not be available to rank all risk factors. Additionally, different FMEA teams may generate different risk prioritizations even when using the qualitative method to rate risk variables, highlighting the limitations of the FMEA framework related to team experience and the team-dependent nature of the qualitative approach [11].
Numerous research studies have attempted to overcome the limitations of the standard RPN and have proposed alternative approaches to enhance the FMEA technique [12]. Liu [13] presented examples of how uncertainty theories and multi-criteria decision-making can improve conventional FMEA procedures. Wang et al. [14] introduced an FMEA model that prioritizes failure modes in the presence of uncertainty, ambiguity, and insufficient information. Zhao et al. [15] suggested a method to address subjective evaluations among FMEA team members. Liu et al. [16] presented a novel FMEA model that employs various techniques for risk prioritization. However, these alternative approaches require further research to address challenges associated with weighting risk variables.
In this study, we propose utilizing the modified Risk Priority Index (RPI) technique as a straightforward yet reasonable risk prioritization model for FMEA. The modified RPI technique aims to overcome the limitations of the standard RPN while preserving its simplicity. It addresses the non-injectivity and non-surjectivity problems and allows for distinct risk factors with varying relative importance. By offering a reliable and user-friendly tool for reliability analysis and prioritizing failure modes, the modified RPI technique contributes to the advancement of engineered systems design [17].
Overall, this introduction provides background information on the FMEA technique, highlights its limitations, and discusses various alternative approaches. It is organized to enhance coherence and readability, condensing the text by eliminating redundancies and focusing on relevant information. The citations have been formatted consistently and according to the journal's guidelines. Towards the end of the introduction, a brief summary of the main research gap and the specific contribution of the proposed method is provided to emphasize the novelty and relevance of the study [17].
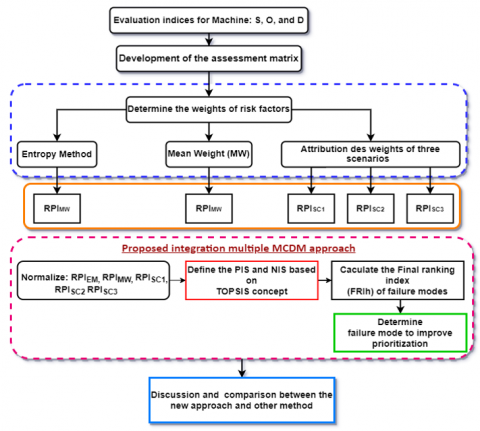
The model's architectural layout for evaluating the risk of a belt conveyor is depicted in Figure 1. The suggested model comprises three stages. The first stage involves identifying the failure modes and risk variables. Risk factors such as S, O, and D are developed as criteria in the FMEA. Engineers generally evaluate risks linked to possible failures or damages when conducting a risk assessment process. Input from professionals with expertise and training is sought to identify potential risks [18].
2.1 Identifying the weights that appear to have an impact
The relative importance of criteria is determined using their weights in the assessment scheme [19, 20]. In this study, two methods, namely the Entropy Method and Mean Weight (MW), are used to assign weights. Additionally, weights are assumed for proposed scenarios.
2.1.1 Entropy method
In a given scenario where a decision matrix involves a significant amount of data for a range of potential materials, the entropy method is utilized to allocate weights to the criteria. The entropy method functions based on a predetermined decision matrix. As per the information theory's principle, the level of uncertainty conveyed by a discrete probability distribution is proportional to the width of the distribution, where a wider distribution indicates higher uncertainty than a more concentrated one [21, 22]. The entropy approach utilizes the data for each criterion to determine its relative importance. The entropy of the set of normalized results for the jth criterion is calculated as follows:
Figure 1. The proposed RPI-MCDM-based FMEA model
$E_j=-\frac{\left[\sum_{i=1}^m P_{i j} \ln \left(P_{i j}\right)\right]}{\ln (m)}$ (2)
$\mathrm{j}=1,2 \ldots, \mathrm{n}$ and $\mathrm{i}=1,2 \ldots, \mathrm{m}$
The $P_{i j}$ is provided by the normalized decision matrix and is:
$E_j=-P_{i j}=\frac{r_{i j}}{\sum_i^m r_{i j}}$ (3)
where, $r_{i j}$ is an element of the decision matrix, $\mathrm{E}_{\mathrm{j}}$ as the information entropy value for $\mathrm{j}^{\text {th }}$ criteria. Hence, the criteria weights, $\mathrm{w}_{\mathrm{j}}$ is obtained using the following expression:
$\mathrm{W}_{\mathrm{j}}=\frac{1-E_j}{\sum\left(1-E_j\right)} ; j=1,2, \ldots, n$ (4)
where, $\left(1-E_j\right)$ is the degree of divers’ $\mathrm{i}^{\text {th }}$ of the information involved in the outcomes of the $\mathrm{j}^{\text {th }}$ criterion.
2.1.2 Mean Weight (MW)
The mean weight is a commonly used approach when there is a lack of input or insufficient information from the decision maker to make a decision [23]. It assumes that all criteria are equally important, and this can be calculated using Eq. (5).
$W_J=\frac{1}{n}$ (5)
where, n is the number of criteria.
2.2 Using the RPI method to obtain the rankings of the failure modes
In the RPI (risk priority index function) model [18], two functions are utilized to give priority to failure modes: the first is the risk isosurface function [RI], which prioritizes failure modes based on the importance of risk variables; the second is the risk priority index function [RPI], which considers the relative weight of variables to prioritize failure modes. The RI function is easy to use and understand, and often sufficient for prioritizing failure modes. However, if there is a need to account for varying relative weights of risk factors, the RPI function should be used, which requires following a set of specified actions.
The phases for the RPI model may be summed up as follows:
Step 1: The following equation may be used to calculate RI while taking into account that the order of significance of A > B > C is more logical:
$R I(A, B, C)_{A>B>C}=(1-A) \cdot \propto^2+B \propto+C-\propto$ (6)
where, $\mathrm{A}, \mathrm{B}, \mathrm{C}, \alpha \in \mathrm{N}$.
As an illustration, consider a risk scenario where risk factors are evaluated using a 10-point scale and prioritized in the order of S > O > D. In this case, the RI function can be expressed using Eq. (3).
$R I(S, O, D)_{S>O>D}=(1-S) \cdot 10^2+O \cdot 10+D-10$ (7)
Step 2: Assign the risk factors weights based on accepted expert reasoning to get a global failure mode risk value.
$\delta_A=\frac{R I(A, B, C)_{A>B>C_{R a n k}}\,\quad+R I(A, B, C)_{A>C>B\,_{\text {Rank }}}}{2}$ (8)
$\delta_B=\frac{R I(A, B, C)_{B>A>C_{\text {Rank }}}\,\quad+R I(A, B, C)_{B>C>A\,_{\text {Rank }}}}{2}$ (9)
$\delta_C=\frac{R I(A, B, C)_{C>A>B_{R a n k}}\,\quad+R I(A, B, C)_{C>B>A\,_{\text {Rank }}}}{2}$ (10)
The delta risk drivers, denoted as $\delta_{\mathrm{A}}, \delta_{\mathrm{B}}$, and $\delta_{\mathrm{C}}$, are calculated based on the delta values of the risk factors, $\delta_{\mathrm{S}}, \delta_{\mathrm{O}}$, and $\delta_D$. For example, if Severity, Occurrence, and Detectability are used as risk factors, then the delta values for these factors would be used to calculate the delta risk drivers.
$R P I=w_A \delta_A+w_B \delta_B+w_C \delta_C$ (11)
The following equation gives the failure mode RPI for the significance order $\mathrm{ws}_{\mathrm{S}}>\mathrm{w}_{\mathrm{O}}>\mathrm{w}_{\mathrm{D}}:$
$R P I=w_S \delta_S+w_O \delta_O+w_D \delta_D$ (12)
Step 3: Verification of by flowing inequality:
$w_S-w_O>\frac{1}{\varepsilon^2}-\frac{1}{\varepsilon^3}$ (13)
Formula (13) guarantees that the user's ranking of importance is preserved. For this to happen, there must be a difference of more than 0.009 percentage points between the highest and middle weights. Although this value is very small, it is crucial to maintain the user's desired ranking and has no practical use in real-world applications.
Step 4: Eq. (14) gives the RPI's final form:
$R P I=\left(\frac{w_A \,\,\varepsilon^3+1}{\varepsilon^3}\right) \delta_A+\left(\frac{w_B \,\,\varepsilon^2+1}{\varepsilon^2}\right) \delta_B+w_C \delta_C$ (14)
2.3 Hybrid RPI-MCDM based FMEA model
Various strategies can lead to different outcomes when sorting options for assessment or selection. It is uncommon for all alternative ranks to be the same across all ranking techniques, making decision-making more complex. Hybrid MCDM approaches, such as those mentioned in references [24-28], have been explored to address this issue.
This research employs a modified RPI approach with three alternative weighting strategies to rank failures. However, to calculate the ultimate utility degree for each option, an appropriate integration approach is necessary. The suggested integrated model can assist risk managers in making better-informed decisions regarding the prioritization of failure types. It emphasizes the necessity for them to combine multiple MCDM techniques to achieve a comprehensive result.
Various strategies can lead to different outcomes when sorting options for assessment or selection. It is uncommon for all alternative ranks to be the same across all ranking techniques, making decision-making more complex. Hybrid MCDM approaches, such as those mentioned in references [24-29], have been explored to address this issue.
The TOPSIS method, proposed by Hwang and Yoon [30], is a widely used MCDM technique due to its simplicity and programmability. It determines the shortest distance from the positive ideal solution and the farthest distance from the negative ideal solution [31]. This research employs a modified RPI approach with three alternative weighting strategies to rank failures. However, to calculate the ultimate utility degree for each option, an appropriate integration approach is necessary. The suggested integrated model can assist risk managers in making better-informed decisions regarding the prioritization of failure types. It emphasizes the necessity for them to combine multiple MCDM techniques, such as TOPSIS, to achieve a comprehensive result.
The comprehensive procedures for multiple integrated MCDM approaches, based on the TOPSIS idea, are utilized to combine evaluation scores and can be obtained as follows:
Step 1: The scores of the failure modes are transformed into an index that ranges from 0 to 1.
The ranking indexes of $\mathrm{RPI}_{\mathrm{EM}}, \mathrm{RPI}_{\mathrm{MW}}, \mathrm{VRPIs} \mathrm{c}_1, \mathrm{RPI}_{\mathrm{sc} 2}$, $\mathrm{RPI}_{\mathrm{sc} 3}$ are transformed by:
a. Create a Normalized Matrix.
$r_{i j}=\frac{x_{i j}}{\sqrt{\sum_{j=1}^m \,\,x_{i j}^2}}$ (15)
b. Determine the weighted Normalized Matrix.
$V_{i j}=r_{i j} \times W_j$ (16)
where, $\mathrm{W}_{\mathrm{j}}$ the weights of criteria and given by entropy method.
Step 2: Calculate (z+ and z- values, which represent the maximum and minimum scores for each column).
Get the highest and lowest scores (z+ and z-) for each method for each failure mode.
$\begin{gathered}Z^{+}=\underbrace{\max }_n\left\{R P I_{E M}, R P I_{M W}, R P I_{S C 1}, R P I_{S C 2}, R P I_{S C 3}\right\} \\ =\left\{Z_1^{+}, Z_2^{+}, Z_3^{+}, Z_4^{+}, Z_5^{-}\right\}\end{gathered}$ (17)
$\begin{gathered}Z^{-}=\underbrace{\max }_n\left\{R P I_{E M}, R P I_{M W}, R P I_{S C 1}, R P I_{S C 2}, R P I_{S C 3}\right\} \\ =\left\{Z_1^{-}, Z_2^{-}, Z_3^{-}, Z_4^{-}, Z_5^{-}\right\}\end{gathered}$ (18)
Step 3: Find the difference or distance between each failure mode and both the maximum and minimum scores, represented by z+ and z-.
It is possible to determine the distance between each failure mode and both the positive ideal solution (PIS) and negative ideal solution (NIS), which are represented by z+ and z-, respectively.
$\alpha_n^{+}=\sqrt{\begin{array}{c}\left(R P I_{E M}-Z_1^{+}\right)^2+\left(R P I_{M W}-Z_2^{+}\right)^{2^2} +\left(R P I_{S C 1}-Z_3^{+}\right)+\left(R P I_{S C 2}-Z_4^{+}\right)^2+\left(R P I_{S C 3}-Z_5^{+}\right)^2\end{array}}$ (19)
$\alpha_n^{-}=\sqrt{\begin{array}{c}\left(R P I_{E M}-Z_1^{-}\right)^2+\left(R P I_{M W}-Z_2^{-}\right)^{2^2}+\left(R P I_{S C 1}-Z_3^{-}\right) +\left(R P I_{S C 2}-Z_4^{-}\right)^2+\left(R P I_{S C 3}-Z_5^{-}\right)^2\end{array}}$ (20)
$n=1,2, \ldots, m$
Step 4: Create the final ranking index.
The Final Ranking Index (FRIn) is utilized as a reliable metric to establish the benchmark for the ultimate ranking [23]. In our proposed model, we employ the separation distance between the positive ideal solution and the negative ideal solution for MCDM approaches to calculate the ranking index, which is expressed as follows:
$F R I_n=\left(\frac{\alpha_n^{-}}{\sum_{n=1}^m \,\,\alpha_n^{-}}\right)-\left(\frac{\alpha_n^{+}}{\sum_{n=1}^m \,\,\alpha_n^{+}}\right)$ (21)
where: $-1 \leq F R I_n \leq 1$.
The current research was carried out at the open pit phosphate mine operated by Bir El Ater company in southeast Algeria. The ore is transferred from the loading hopper via the conveyor belt (Figure 2). The conveyor belt's statistical data has shown how successful the new hybrid FMEA model that has been developed is.
Figure 2. Belt Conveyor in Bir El Ater Mine, Algeria
The study analyzed three years of breakdown statistics for functional belt conveyors and identified 20 unique failure modes. Table 1 lists the corresponding Fi failure mechanisms for each failure mode. Table 2 presents linguistic terminology and values for S, O, and D. However, Table 3 shows that the failure modes F9 and F13, F2 and F18, F1 and F5, and F8 and F14 occupy the same rank position, highlighting a common limitation of using RPN to identify failure scenarios. The study's analysis also identifies the three most critical failure modes as F4, F3, and F9. A comparison of the values assigned to the risk variables for these three modes with their RPN rank reveals that the decrease in detectability score affected the classification of F9, despite high S and O values for the first two faults. These findings demonstrate how the conventional FMEA approach can impact the relative weighting of each risk indicator in an uncontrollable manner (See Table 4).
As a result, RPIMw, RPIENW, and RPIsc1 correspondingly prioritize the failure modes as F4, F9, and FM13. Table 5 shows that different RPI approaches produce different rankings for the failure types. This is a difficulty. It might be dangerous and biased to solve and evaluate a reality of the situation using only one approach. It is obvious that a complete answer cannot be found by applying one evaluation method.
Table 1. FMEA machine of belt conveyer
|
|
Fmea Machine – Analysis of Failure Modes, Their Effects and Their Criticality |
Failure Number |
|||||
|
System: Belt Conveyer |
|||||||
|
|
Element |
Function |
Failure Mode |
Causes of Failure |
Effect of Failure |
Detection |
|
|
Electric Motor
|
Fan
|
Keep the Motor temperature down |
Blocked fan |
Corrosion -Physical damage. -Foreign material build up -Bad maintenance -Aging |
Overheating and lead to expensive repair. |
Auditory |
F1
|
|
Bearing |
Reduce friction of the rotating shaft. Rotation guidance |
Destruction of engine components |
-Lack of lubrication -Improper lubrication or grease -Improper mounting -Shaft misalignment -Lack of maintenance |
Overload & overheat. Shaft damage. High repair cost |
Monitor vibration monthly |
F2
|
|
|
Stator Defect |
-Create a magnetic field -Carry current -Retain armature |
-Eccentricity -Broken winding insulation -Thermal stress |
-Wear -Aging -Lack of maintenance. -Shaft voltages due to asymmetric electrical circuits |
Motor inefficiency, high cost to repair |
Use vibration analyse & infrared thermograph analysis. |
F3 |
|
|
Rotor Defect |
The moving part of the motor |
-Eccentric rotor -Broken rotor bar - Voltages surge -Overheat
|
-Thermal stress -Imbalance -Assembly problem -Overloading or heavy starts maintenance -Aging |
Bearing damage motor Rebuild high repair cost |
Use vibration analysis to detect rotor defect |
F4
|
|
|
External Faults Mechanical |
Misalignment |
Coupling & shaft Transmit the movement |
- Movement abnormal and vibration and destruction of bearing |
Bad type material. -Bad maintenance -improper installation -improper manufact -corrosion |
Equipment shutdown to avoid bearing damage and expensive repairs |
F5 |
|
|
Reducer and its Components |
The Reservoir |
Keep enough oil |
- Lack of oil in the tank |
Insufficient oil level |
Bad drum training |
Vibration and abnormal heating of reducers |
F6 |
|
Bevel Pinion with Helical Teeth |
Transmit a rotational movement |
Degradation of teeth by breaking |
▪ Fatigue ▪ Defective quenching ▪ Bad load distribution |
Noise and vibration |
Analysis Vibratory |
F7 |
|
|
Pinion Toothed Helical
|
Transmit a rotational movement
|
Flaking |
insufficient thickness of the treated layer (poor surface hardening) |
Vibration
|
Analysis Vibratory |
F8 |
|
|
Seizure |
Lubrication conditions, the quality of the lubricant, its pollution or the efficiency of the cooling system - poor lubrication |
Noise and Vibration and increased temperature at the bearings |
Analysis Vibration and thermal analysis |
F9 |
|||
|
Pinion Shaft |
transmission of motion |
The shear failure |
- Fatigue failure of the shaft |
Reducer stop |
visual |
F10 |
|
|
Spherical Roller Bearing |
Provides rotational guidance |
Deformation plastic |
- preload overstress -non-compliance with assembly and handling instructions |
Shaft drive fault |
Analysis Vibratory |
F11 |
|
|
Rolling With Conical Rollers |
Provides rotational guidance |
Bearing seizure or fatigue |
Poor shaft guidance |
-Reduced bearing life. - Deterioration of the drive system |
Analysis Vibratory |
F12 |
|
|
Rolling Spherical on Rollers |
Provides rotational guidance |
The rupture of the outer ring |
-Misalignment -Strange body entered - Unsuitable tools |
Vibration
|
Analysis Vibratory |
F13 |
|
|
Shaft
|
Transmission of motion |
Bad transmission |
Shaft twist -Misalignmentof the shaft |
Vibration and rapid deterioration of the drive system. |
Analysis Vibratory |
F14 |
|
|
Keyway
|
Make the connection between the shaft and the coupling |
Matting
|
Misalignment of tha shaft |
Shaft drive fault |
Vibration Coupling noise |
F15 |
|
|
Drum |
Train the Band |
Presence of flat spots or cracks Lining wear |
Absence of friction coating Presence of foreign bodies between the belt and the drum |
Déport bande Usure bande Tape speed reduction Tape offset |
Visual inspection |
Presence of flat spots or cracks Lining wear |
F16 |
|
Bad connection with the key |
Usure rainure ou clavette |
Beat |
Visual inspection |
Bad connection with the key |
F17 |
||
|
Bands |
Receive the product and transport it |
Rupture (take off) |
Tape too offset. |
Production shutdown |
Visual inspection |
F18 |
|
|
Tension insuffisant |
Defective tensioning system: belt too long, significant expansion |
Dragline: reduced speed |
Visual inspection |
F19 |
|||
|
Roller Convoyer |
Center and guide the tape |
Blocking |
Defective bearing: presence of foreign bodies high friction |
Belt wear: flat on the rollers |
Visual inspection |
F20 |
|
Table 2. Linguistic terms and values for S, O, D
|
Linguistic Terms |
Score |
||
|
Severity (S) |
Occurrence (O) |
Detection (D) |
|
|
Very dangerous (VH) |
Failure is practically inevitable (FI) |
Absolute uncertainty (AU) |
10 |
|
Hazardous (H) |
Very high (VH) |
Very remote (VR) |
9 |
|
Extreme (E) |
Repeated failures |
Remote (R) |
8 |
|
Major (MA) |
High (H) |
Very low (RL) |
7 |
|
Significant (S) |
Moderately high (MH) |
Low (L) |
6 |
|
Moderate (MO) |
Moderate (M) |
Moderate (M) |
5 |
|
Low (L) |
Relatively low (RL) |
Moderately high (MH) |
4 |
|
Minor (MI) |
Low (L) |
High (H) |
3 |
|
Very minor (VM) |
Remote (R) |
Very high (VH) |
2 |
|
None (N) Almost |
Nearly impossible (NI) |
certain (AC) |
1 |
Table 3. The conventional FMEA ranking
|
Modes |
S |
O |
D |
RPN |
Priority |
|
F1 |
3 |
7 |
6 |
126 |
12 |
|
F2 |
3 |
8 |
9 |
216 |
7 |
|
F3 |
5 |
7 |
10 |
350 |
2 |
|
F4 |
7 |
7 |
10 |
490 |
1 |
|
F5 |
2 |
7 |
9 |
126 |
12 |
|
F6 |
3 |
3 |
8 |
72 |
19 |
|
F7 |
6 |
9 |
3 |
162 |
10 |
|
F8 |
4 |
10 |
3 |
120 |
15 |
|
F9 |
10 |
10 |
3 |
300 |
3 |
|
F10 |
6 |
10 |
3 |
180 |
9 |
|
F11 |
3 |
10 |
3 |
90 |
18 |
|
F12 |
10 |
9 |
3 |
270 |
6 |
|
F13 |
6 |
10 |
5 |
300 |
3 |
|
F14 |
3 |
10 |
4 |
120 |
15 |
|
F15 |
6 |
3 |
3 |
54 |
20 |
|
F16 |
3 |
6 |
7 |
126 |
12 |
|
F17 |
6 |
3 |
8 |
144 |
11 |
|
F18 |
6 |
6 |
6 |
216 |
7 |
|
F19 |
8 |
6 |
6 |
288 |
5 |
|
F20 |
3 |
6 |
6 |
108 |
17 |
In the RPIMw model, the ranking of failure modes is as follows for the top 3 positions: F4 (7-7-10) > F9 (10-10-3) > F13 (6-10-5). This indicates that the failure mode with a Severity score of (S=7), an Occurrence score of (O=7), and the highest Detectability score of (D=10) is considered the most crucial failure mode.
The RPIENW model determined that the top three critical failure modes were F4 (7-7-10), F9 (10-10-3), and F13 (6-10-5).
The weight (Table 4) is estimated with, we use two methods: Entropy Method, and Mean Weight (MW). Moreover, assuming weights with a proposed scenario.
Table 4. Different estimated weights
|
Entropy Method |
0.38857 |
0.230255 |
0.381175 |
|
Mean Weight Method |
0.3333 |
0,3333 |
0.3333 |
|
Scenario 1 |
0.5 |
0,2 |
0.3 |
|
Scenario 2 |
0.2 |
0,5 |
0.3 |
|
Scenario 3 |
0.2 |
0.3 |
0.5 |
Table 5. Rankings of the failure modes generated using various RPI methods
|
RPIEM |
RPIMW |
SC1 |
SC2 |
SC3 |
RANK |
|
F4 |
F4 |
F4 |
F9 |
F4 |
1 |
|
F9 |
F9 |
F9 |
F13 |
F3 |
2 |
|
F13 |
F13 |
F13 |
F4 |
F2 |
3 |
|
F3 |
F3 |
F19 |
F10 |
F13 |
4 |
|
F19 |
F12 |
F12 |
F2 |
F9 |
5 |
|
F12 |
F10 |
F3 |
F3 |
F19 |
6 |
|
F2 |
F2 |
F17 |
F14 |
F17 |
7 |
|
F17 |
F19 |
F10 |
F12 |
F5 |
8 |
|
F10 |
F17 |
F18 |
F8 |
F10 |
9 |
|
F18 |
F14 |
F2 |
F19 |
F14 |
10 |
|
F14 |
F18 |
F7 |
F7 |
F12 |
11 |
|
F7 |
F8 |
F8 |
F5 |
F18 |
12 |
|
F5 |
F7 |
F14 |
F11 |
F16 |
13 |
|
F8 |
F5 |
F16 |
F17 |
F1 |
14 |
|
F16 |
F1 |
F1 |
F18 |
F6 |
15 |
|
F1 |
F16 |
F5 |
F1 |
F8 |
16 |
|
F6 |
F11 |
F6 |
F16 |
F7 |
17 |
|
F11 |
F6 |
F15 |
F6 |
F20 |
18 |
|
F20 |
F20 |
F11 |
F20 |
F11 |
19 |
|
F15 |
F15 |
F20 |
F15 |
F15 |
20 |
The RPIsc1 model ranks the failure modes and the top 3 positions are as follows: F4 (7-7-10) > F9 (10-10-3) > F13 (6-10-5).
The RPIsc2 model ranks the failure modes in the following order for the top 3 positions: F9 (10-10-3) > F13 (6-10-5) > F4 (7-7-10).
The RPIsc3 model ranks the failure modes in the following order for the top three positions: F4 (7-7-10) > F3 (5-7-10) > F2 (3-8-9).
The application of RPI with 5 different weight conditions for the prioritization of failure modes resulted in inconsistencies, mainly due to changes in the order of significance that need to be established to reflect the intended risk scenario. The subsequent sections aim to illustrate and explain the implementation of the proposed risk prioritization approach in this study.
In this study, a reliable method was proposed by combining multiple MCDM values to obtain the final results. Table 6 shows the ultimate ranking of failure modes, which was evaluated using Eqs. (1)-(21). The results reveal that F4 is the most critical failure mode, followed by F9 and F13.
Table 6. Results of the proposed integrated ranking method
|
Modes F. |
αn- |
αn+ |
FRIn |
Rank |
|
F1 |
0.037926 |
0.071719 |
0.03147 |
15 |
|
F2 |
0.072872 |
0.03708 |
-0.03179 |
5 |
|
F3 |
0.078768 |
0.029649 |
-0.04392 |
4 |
|
F4 |
0.105819 |
0.00322 |
-0.09254 |
1 |
|
F5 |
0.043692 |
0.068921 |
0.023705 |
14 |
|
F6 |
0.026142 |
0.08359 |
0.052978 |
17 |
|
F7 |
0.045255 |
0.063251 |
0.0171 |
12 |
|
F8 |
0.04624 |
0.064528 |
0.017381 |
13 |
|
F9 |
0.096567 |
0.015069 |
-0.07334 |
2 |
|
F10 |
0.069489 |
0.039934 |
-0.02613 |
8 |
|
F11 |
0.028451 |
0.085908 |
0.053018 |
18 |
|
F12 |
0.071007 |
0.037886 |
-0.02937 |
7 |
|
F13 |
0.089423 |
0.021093 |
-0.06137 |
3 |
|
F14 |
0.0539 |
0.05876 |
0.005186 |
11 |
|
F15 |
0.003893 |
0.105439 |
0.093069 |
20 |
|
F16 |
0.036888 |
0.072408 |
0.033038 |
16 |
|
F17 |
0.0609 |
0.047235 |
-0.01169 |
9 |
|
F18 |
0.053396 |
0.054092 |
0.001364 |
10 |
|
F19 |
0.07183 |
0.036473 |
-0.03141 |
6 |
|
F20 |
0.01571 |
0.095452 |
0.073257 |
19 |
The proposed model is appropriate for the practical implementation of risk analysis and management. In the absence of any observed failure modes, expert judgment is relied upon to assess potential hazards. Based on evaluations of severity, likelihood of occurrence, and detectability, the top five fault modes are identified as F4>F9>F13>F3>F2, with significant attention given to noise-related problems such as the rotor fault (F4), seizing of pinion toothed Helical (F9), and rolling spherical on rollers (F13) which provide rotational guidance. The driving system has several critical flaws, including bearing damage, noise and vibration, and elevated bearing temperatures, which are the primary causes.
The RPI-MCDM based FMEA model proposed is a trustworthy source of information that can assist experts and decision makers in comprehending the severity of risk associated with failure modes. Among the identified failure modes, F4, F9, F13, and FM3 are considered high-risk and demand immediate attention from risk managers for developing improvement strategies. F19, F12, F10, F17, and F18 belong to a lower risk category and can be prioritized for enhancement if adequate financial resources are available.
This research proposes a more rigorous approach to determine the risk ranking of different failure types, which is an improvement over the traditional methods that relied on a single approach. The new method overcomes the issues of objectivity and subjectivity and results in a more suitable classification of risk. Figure 3 illustrates the rankings generated by the suggested approach and five other methods. The novel model identifies F4, F9, and F13 as the three critical failure modes, which differs from the outcomes of other models.
Figure 3. Failure mode ranking obtained using different methods
The suggested method is deemed more dependable than using a single approach to rate risks since it considers multiple factors. Although a few integrated methods have been developed, combining them all can provide a more comprehensive and practical usability ranking.
Table 6 compares the outcomes of the proposed method with two MCDM models, where F4 is the top-priority failure mode in all models. While VIKOR considers F3 as the second-highest priority failure mode, EDAS and the proposed model suggest FM9 as the second priority. The discrepancy is due to the similarity in severity levels of the two failure modes resulting in equivalent weightage being assigned to severity and detection. The relative severity of various failure modes could be lost if only the final rankings are considered. The results were shared with the experts of the case company who confirmed the proposed method's practicality compared to other methods.
The suggested model is capable of analyzing the influence relationships of risk parameters and prioritizing failure modes using the RPI-MCDM hybrid method. This approach overcomes the limitations of traditional FMEA methods.
Since the 1950s, FMEA has been developed as a technology to identify possible faults before they occur. However, traditional FMEA approaches have limitations in producing comprehensive and acceptable analytical results. This study proposes an evaluation model, which classifies failure modes of systems and machines, in order to enhance failure modes in the mining industry. A belt conveyor is used as a reference case, as it is a crucial continuous conveying equipment in the mining industry. The study finds that vibration, temperature, wear, and lack of tightness of equipment are the factors that cause the most critical failure modes. Different risk ranking methods have varying concepts and calculation procedures, thus multiple methods can ensure more stable and objective analysis results. The proposed methodology is feasible and can be applied to various classification domains.
The proposed model provides several contributions and conclusions, including:
• The use of ENTROPY to determine dominant weights and consider interaction among evaluation factors.
• The ability to overcome the limitations of FMEA by using RPI models with different scenarios and weights.
• The proposed method integrates multiple MCDM approaches, utilizing TOPSIS to define the PIS and NIS, and calculates the Final Ranking Index (FRIn) of failure modes.
• To enhance the quality of maintenance, identifying the most critical failure mode is essential. Although the proposed model has demonstrated improved results compared to prior methods, it still has some limitations.
The current approach for evaluating possible failure modes relies on expert interviews and historical machine data, and incorporating up-to-date data can improve the objectivity of the analysis. Additionally, expanding the RPI model with more variables and exploring other MCDM techniques can enhance the analysis further. Fuzzy set theory or fuzzy-MCDM can be used to account for data quality during the evaluation process. These improvements can lead to more accurate and reliable results in future studies.
The authors would like to express their sincere appreciation to all management professionals, employees, and miners at the Bir El Ater mine in Algeria for helping us by providing technical information we needed and giving opinions on the failure mechanisms for belt conveyors.
[1] Military, U.S. (1949). Procedure for performing a failure mode effect and criticality analysis. United States military procedure MIL-P-1629.
[2] Bejan, A. (2015). Constructal thermodynamics. Constructal Law & Second Law Conference, Parma, pp. S1-S8.
[3] Reiling, J.G., Knutzen, B.L., Stoecklein, M. (2003). FMEA-the cure for medical errors. Quality Progress, 36(8): 67-71.
[4] Lukas, L. (2014). Risk mapping for mobile communication. In 2014 International Conference on Mathematics and Computers in Sciences and in Industry, Varna, Bulgaria, pp. 1-5. https://doi.org/10.1109/MCSI.2014.59
[5] Teng, S.H., Ho, S.Y. (1996). Failure mode and effects analysis: An integrated approach for product design and process control. International Journal of Quality & Reliability Management, 13(5): 8-26. https://doi.org/10.1108/02656719610118151
[6] Chang, D.S., Paul Sun, K.L. (2009). Applying DEA to enhance assessment capability of FMEA. International Journal of Quality & Reliability Management, 26(6): 629-643. https://doi.org/10.1108/02656710910966165
[7] de Almada GarciaI, P.A., Leal Junior, I.C., Oliveira, M.A. (2013). A weight restricted DEA model for FMEA risk prioritization. Production, 23(3): 500-507. https://doi.org/10.1590/S0103-65132012005000092
[8] Zhang, Z., Chu, X. (2011). Risk prioritization in failure mode and effects analysis under uncertainty. Expert Systems with Applications, 38(1): 206-214. https://doi.org/10.1016/j.eswa.2010.06.046
[9] Chin, K.S., Wang, Y.M., Poon, G.K.K., Yang, J.B. (2009). Failure mode and effects analysis by data envelopment analysis. Decision Support Systems, 48(1): 246-256. https://doi.org/10.1016/j.dss.2009.08.005
[10] Abdelgawad, M., Fayek, A.R. (2010). Risk management in the construction industry using combined fuzzy FMEA and fuzzy AHP. Journal of Construction Engineering and Management, 136(9): 1028-1036. https://doi.org/10.1061/(ASCE)CO.1943-7862.0000210
[11] Yang, J., Huang, H.Z., He, L.P., Zhu, S.P., Wen, D. (2011). Risk evaluation in failure mode and effects analysis of aircraft turbine rotor blades using Dempster–Shafer evidence theory under uncertainty. Engineering Failure Analysis, 18(8): 2084-2092. https://doi.org/10.1016/j.engfailanal.2011.06.014
[12] Witcher, M.F. (2014). Failure mode and effect analysis (FMEA) as a quality by design (QbD) tool for managing biopharmaceutical product development and manufacturing risks. Bioprocessing Journal, 13(3).
[13] Liu, H.C. (2016). FMEA using uncertainty theories and MCDM methods. In: FMEA Using Uncertainty Theories and MCDM Methods. Springer Singapore. https://doi.org/10.1007/978-981-10-1466-6_2
[14] Wang, L.E., Liu, H.C., Quan, M.Y. (2016). Evaluating the risk of failure modes with a hybrid MCDM model under interval-valued intuitionistic fuzzy environments. Computers & Industrial Engineering, 102: 175-185. https://doi.org/10.1016/j.cie.2016.11.003
[15] Zhao, H., You, J.X., Liu, H.C. (2017). Failure mode and effect analysis using MULTIMOORA method with continuous weighted entropy under interval-valued intuitionistic fuzzy environment. Soft Computing, 21: 5355-5367. https://doi.org/10.1007/s00500-016-2118-x
[16] Liu, H.C., You, J.X., Chen, S., Chen, Y.Z. (2016). An integrated failure mode and effect analysis approach for accurate risk assessment under uncertainty. IIE Transactions, 48(11): 1027-1042. https://doi.org/10.1080/0740817X.2016.1172742
[17] Akbarzade Khorshidi, H., Gunawan, I., Ibrahim, M.Y. (2016). Applying UGF concept to enhance the assessment capability of FMEA. Quality and Reliability Engineering International, 32(3): 1085-1093. https://doi.org/10.1002/qre.1817
[18] Nguyen, T.L., Shu, M.H., Hsu, B.M. (2016). Extended FMEA for sustainable manufacturing: An empirical study in the non-woven fabrics industry. Sustainability, 8(9): 939. https://doi.org/10.3390/su8090939
[19] Anes, V., Henriques, E., Freitas, M., Reis, L. (2018). A new risk prioritization model for failure mode and effects analysis. Quality and Reliability Engineering International, 34(4): 516-528. https://doi.org/10.1002/qre.2269
[20] Zhou, F., Wang, X., Lim, M. K., He, Y., Li, L. (2018). Sustainable recycling partner selection using fuzzy DEMATEL-AEW-FVIKOR: A case study in small-and-medium enterprises (SMEs). Journal of Cleaner Production, 196: 489-504. https://doi.org/10.1016/j.jclepro.2018.05.247
[21] Gören, H.G. (2018). A decision framework for sustainable supplier selection and order allocation with lost sales. Journal of Cleaner Production, 183: 1156-1169. https://doi.org/10.1016/j.jclepro.2018.02.211
[22] Deng, H., Yeh, C., Willis, R.J. (2000). Inter-company comparison using modified TOPSIS with objective weights. Computers & Operations Research, 27(10): 963-973. http://dx.doi.org/10.1016/S0305-0548(99)00069-6
[23] Payton, E., Khubchandani, J., Thompson, A., Price, J.H. (2017). Parents’ expectations of high schools in firearm violence prevention. Journal of Community Health, 42: 1118-1126. https://doi.org/10.1007/s10900-017-0360-5
[24] Lo, H.W., Shiue, W., Liou, J.J., Tzeng, G.H. (2020). A hybrid MCDM-based FMEA model for identification of critical failure modes in manufacturing. Soft Computing, 24: 15733-15745. https://doi.org/10.1007/s00500-020-04903-x
[25] Ekmekçioğlu, M., Can Kutlu, A. (2012). A fuzzy hybrid approach for fuzzy process FMEA: An application to a spindle manufacturing process. International Journal of Computational Intelligence Systems, 5(4): 611-626. https://doi.org/10.1080/18756891.2012.718104
[26] Liu, H.C., You, J.X., You, X.Y. (2014). Evaluating the risk of healthcare failure modes using interval 2-tuple hybrid weighted distance measure. Computers & Industrial Engineering, 78: 249-258. https://doi.org/10.1016/j.cie.2014.07.018
[27] Liu, H.C., You, J.X., Ding, X.F., Su, Q. (2015). Improving risk evaluation in FMEA with a hybrid multiple criteria decision making method. International Journal of Quality & Reliability Management, 32(7): 763-782. https://doi.org/10.1108/IJQRM-10-2013-0169
[28] Liu, H.C., You, J.X., Shan, M.M., Shao, L.N. (2015). Failure mode and effects analysis using intuitionistic fuzzy hybrid TOPSIS approach. Soft Computing, 19: 1085-1098. https://doi.org/10.1007/s00500-014-1321-x
[29] Tsai, T.N., Yeh, J.H. (2015). Identification and risk assessment of soldering failure sources using a hybrid failure mode and effect analysis model and a fuzzy inference system. Journal of Intelligent & Fuzzy Systems, 28(6): 2771-2784. https://doi.org/10.3233/IFS-151556
[30] Hwang, C.L., Yoon, K. (1981). Multiple attributes decision making methods and applications. Part of the book series: Lecture Notes in Economics and Mathematical Systems (LNE, volume 186). Springer Berlin, Heidelberg. http://dx.doi.org/10.1007/978-3-642-48318-9
[31] Chen, S.J., Hwang, C.L. (1992). Fuzzy multiple attribute decision making methods and applications. Part of the book series: Lecture Notes in Economics and Mathematical Systems (LNE, volume 375). Springer Berlin, Heidelberg. http://dx.doi.org/10.1007/978-3-642-46768-4