Khaled M. Khaled![]() | Riham S. Hegazy*
| Riham S. Hegazy*![]()
© 2023 IIETA. This article is published by IIETA and is licensed under the CC BY 4.0 license (http://creativecommons.org/licenses/by/4.0/).
OPEN ACCESS
This article presents a proposed approach and mechanism for calibrating a spring hammer. The metrological characterization of the calibration results was discussed and the uncertainty of this measurement was evaluated. The proposed approach demonstrates a more applicable calibration method using a high accuracy force transducer to measure the spring force and a high-precision deflection measuring instrument to measure the corresponding deflection. Different relative errors are calculated to detect the applicability and accuracy of this approach. The overall relative expanded uncertainty is presented based on the introduced repeatability and reproducibility errors, side by side with the uncertainties of the reference force transducer and length measuring device used. The proposed calibration technique is used to calibrate both types of spring impact hammers; the multi-step hammer and the single-step hammer. Two examples for calibrating multi-step hammer and another single-step hammer are presented with relative expanded uncertainties from 0.36% up to 5.37%.
impact force, spring hammer, calibration, uncertainty, dynamic force
Dynamic load is defined as, load changes in magnitude, direction, and position with respect to time. Most of the force applications are dynamic. Dynamic forces and related instruments are nowadays a hot research topic due to their application and complexity [1]. The spring hammer is one of these applications, where dynamic force produced by compressed spring is used. A spring impact hammer is a practical technique for evaluating the impact energy of engineering materials. The spring impact hammer hits the particular position accurately, and the energy can be analyzed using mechanical energy equation. The main idea of the spring hammer is to transfer the ball drop test to impact energy, which is given by mechanical energy Eq. (1).
$E=m g h$ (1)
where, E is the impact energy of sample, m is the weight of ball, g is the gravity, and h is the height of dropping [2], refer to Figure 1 [3].
(1. Release cone 2. Cone spring 3. release bar 4. Release mechanism spring 5. Release jaw 6. Cocking knob 7. Hammer shaft, 8. Hammer spring 9. Hammer head)
Figure 1. Schematic for spring hammer [3]
The impact spring hammer is a widely used testing hand-held instrument in mechanical tests in different applications for modal tests (or modal experiments results analysis) of mechanical components and interconnected mechanical structures. The fundamental of hand-held hammers is an integrated spring to apply the dynamic force stimulus that excites the mechanical structure under testing [4].
The main purpose of impact tests applied by an impact hammer is to determine the test structure’s impulse responses, mode shapes, resonances, and damping by using acceleration sensors, which pick up the shock response at specific points of investigation [5].
One of the important usages of the spring impact hammer is to define the specifications of the impact test, such as: substrates, which have drawn significant importance in glass tools (such as covers, sensor, and display windows). Due to the brittleness of glass is the critical issue to restricting its application, several properties of glass strength can be determined by the spring impact hammer [6]. Most of the spring impact hammers test devices are designed according to IEC60068-2-75 standard, where after applying the impact with the hammer, the tested items are examined with accessibility probes to determine access to chock, energy, and injury hazards.
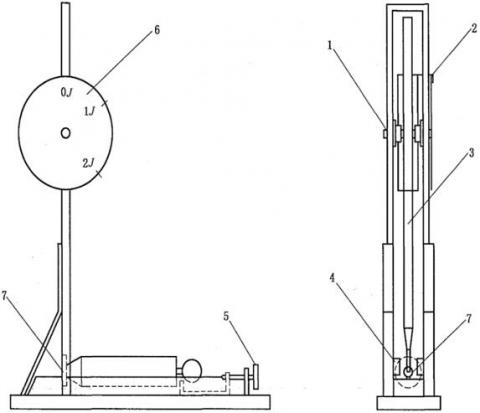
The metrological characterization and determining the uncertainty budget related to the calibration results of the spring hammers is an important topic to be considered. Factors affecting the impact hammer results have gained importance to satisfy measurement accuracy demands which meet the quality management requirements. Several researchers have investigated the calibration methodology of hammers. Most of these articles have discussed the calibration proceeding based on the methodology mentioned in IEC 60068-2-75 as a basic for evaluating the capabilities of a specific sample to resist a specified harshness of impact force [7]. It is used especially to demonstrate an allowable level of robustness when evaluating the safety of a particular product and is the foremost intended for the testing of technical items. It consists of a predetermined number of impacts in predetermined directions applying to the specimen defined by the energy of impact [8]. Another method was developed to focus on dynamic calibrations following primary methods for the traceable measurement of the hammer force pulse. The reference force is determined as the product of the mass and acceleration of the reaction mass body, with the mass value obtained by weighing, and the time-dependent acceleration determined by acceleration measurements [9, 10]. Figure 2 illustrates the principle of the dynamic impact hammer calibration.
1-bearing, 2-drag pointer, 3-pendulum, 4-release base, 5-release device, 6-scale plate, 7- impact point
(a)
(b)
Figure 2. (a). Schematic diagram for spring hammer calibration device using pendulum in accordance with IEC6006-2-75, (b). Photo for the spring hammer calibration device describing positioning of the spring hammer [7]
As the dynamic force testing is a complex testing activity, the presented approach introduces a simple procedure for calibration; it uses high accuracy reference force transducer and length measuring instrument embedded with a loading mechanism to provide traceable measurements. The principles of this procedure are to compare the energy generated by the spring hammer, which is complex to be measured directly, to the pendulum energy, calculated from its mass and falling heights. The calibration was affected by using striking element “3” taken from a spring hammer, as shown in Figure 2. Before conducting calibration, the releasing device is removed from the calibrating device.
Four threads are responsible for the suspension of the striking element at the point of suspension, which located over the contact point between the calibration striking element and the pendulum. The striking swings dynamically against contact point and the pendulum, point “7”, must be below the contact point (1 mm maximum). After this movement the points of the suspension are raised a distance equal to the difference between the two contact points. When the system of the suspension is stetted, the axis of the calibration striking element “3” shall be perpendicular to the surface of the impact. The calibration striking element shall be horizontal the impact time. To obtain reliable results, the device must be supported rigidly using weighty support, for example to a structural part of a building. The height of fall is measured at the center of gravity of the calibration striking element and the measurement can be facilitated by using a liquid level device [10].
The traceability of the applied load is achieved by traceability of the measured mass and acceleration amplitude. The masses application in the dynamic force calibration has to be calibrated at NMIs in accordance with national mass standard, which has traceability against the International Prototype Kilogram. The mass acceleration is comprised of a time interval measurement and a displacement measurement. The displacement is measured interferometrically relative to laser wavelength (for example), which is traceable to an iodine-stabilized He-Ne laser and is thereby traceable to the SI definition of the meter.
The following equations is required to give the traceability to the impact spring hummer when using dynamic force calibration.
A time domain analysis is an analysis of, mathematical functions, of data, with respect to time.
The frequency-domain l show how much of the signal lies within each given frequency band over a range of frequencies.
In general, when an analysis uses a unit of time, such as seconds or one of its multiples (minutes or hours) as a unit of measurement, then it is in the time domain. However, whenever an analysis concerns the units like Hertz, then it is in the frequency domain.
The Laplace transformation is an integral transformation which converts a function of a real variable in the time domain to a function of a complex variable s (frequency domain).
$v_{t s}=\int_0^t a_{t s}(\tau) f(t-\tau) d \tau$ (2)
where, ats is the function of impulses response of the transfer standard used which needed to be determined, vts is the measured output response, f is a known traceable force, and τ is the integration variable. Determining ats from vts and f, where the quantities are related through Eq. (2), is referred to as the deconvolution problem. Provided that ats is linear and time-invariant, the convolution given by Eq. (2) can be transformed into a multiplication in the Laplace domain with complex frequency s. In this work, lower case letters represent time domain quantities, while upper case letters denote their Laplace domain equivalents. For example, force is transformed as F(s) = L {f(t)}, where L is the Laplace operator [11]. The Laplace representation of Eq. (2) takes the form,
$V_{t s}=A_{t s}(s) F(s)$ (3)
Vts is the measured response obtained by applying traceable dynamic force to the impact hammer.
The quantity Ats(s), the Laplace transform of the time domain impulse response ats(τ), is called the transfer function or frequency domain response function of the transfer standard. Regarding the calibration, a force was applied by suspending mass with known, and gravitation field using a thin line, consequently the line is cut and a dynamic step force is applied to the transducer [12]. The applied step force takes the form.
$f(t)=\left\{\begin{array}{rl}-f_o, & t<0 \\ 0, & t \geq 0\end{array} \approx F(s)=\frac{f_o}{s}\right.$ (4)
where, s is complex frequency.
When the mass is suspended, the output voltage exponentially decays towards 0 V, whereupon the line is cut and the step load is applied. The negative sign in Eq. (4) is a matter of convention as the impact hammer is calibrated in compression. From Eq. (4), it follows that the transfer function may be obtained as [13];
$A_{t s}(s)=\frac{1}{f_o} s V_{t s}$ (5)
In Eq. (5), it is assumed that the form of the step in an infinite slope, and consequently and infinite bandwidth, of the applied force profile. In practice, the step force has a finite slope and an unknown shape, which will limit the calibration of the transducer and leads to an additional- uncertainty component related to the frequency [14]. For the applied step forces in this arrangement, $f_o$ = mg where m is the deadweight mass and g are the local gravity acceleration. Under the assumption of a linear, time-invariant system, the product sVts(s) can be considered one quantity, namely the Laplace transform of the time-derivative of the voltage signal dvts/dt. The time domain impulse response function ats is then determined using the inverse Laplace transformation of Eq. (6), which yields [15];
$a_{t s}(\tau)=\frac{1}{f_0} \frac{d v_{t s}}{d t}$ (6)
We derive the impulse response from numerical, time domain differentiation of the step response.
Summary of the calibration process
In order to determine an application transducer calibrated and traceable by utilizing the impact hammer, the following steps are followed:
Calibration of the transfer standard: Apply a known, traceable dynamic force F(s) to the impact hammer and measure its response Vts to determine Ats(s) [15]. Application of a common force: Use the impact hammer to apply a common force to the application transducer and the impact hammer, measure the responses of the application transducer and the impact hammer [15]. Calibration of the application transducer: Determine the impulse response function given the transfer standard impulse response Ats(s) [15].
From the previous equations, it was shown that the dynamic force calibration of the spring impact hummer is very complicated and hard way to give the traceability to the spring hummer. Based on this proceeding, the present work achieves the instrument traceability based on direct measurements to force transducer and length measuring instrument. Furthermore, it provides complete uncertainty calculations which help in the decision rules applied in customers’ fields.
The main idea of this approach is to use a force transducer to measure the force value generated by pressing the spring until the final limit to have potential energy. The upper wheel is used to generate compression force to the spring. This wheel is assembled to a guided power screw. Therefore, when the power screw rotates in a clockwise direction, the power screw moves vertically downwards and vice versa. The spring shall be pressed to reach the final position and the corresponding maximum force and deflection are measured by the force transducer and the precise digital dial indicator. All the components of this mechanical system are assembled in a fixation frame, as shown in Figure 3. The force transducer used is a GTM manufacturing gauge reference standard force transducer (Model: KTN-D) classified as 00 in accordance with ISO 376:2011 with relative expanded uncertainty of ±0.02%. A reading amplifier manufactured by AEP transducers (Model: MP10PLUS) with a resolution of 0.00001mV/V is used to display the resultant response. A digital indicator manufactured by Mitutoyo (Model: 543-854E) with a measuring range up to 50 mm and resolution of 0.001 mm is used to measure the spring’s deflected length.
Figure 3. Schematic of the calibration setup of the spring impact hammer
Based on this proceeding the instrument traceability will be easily achieved based on force (which is traceable to the primary force standard machines), and to the primary length standard at the National Institute of Standards.
Since the change of the potential energy of the movable hammer is equal to the work done, the elastic potential energy is equal to the kinetic impact energy introduced by the pressed spring. Therefore, the measurement of the force required to press the spring and measuring the corresponding elastic deflection could be used to calculate the spring impact hammer energy as shown in the following equation.
$Spring\,\, energy=0.5 \times l \times f$ (7)
where, l is the measured distance by the digital indicator. f is the force measured by the force transducer.
To investigate the reliability of the developed mechanism, the following calibration procedure was applied on different capacities spring impact hammers;
a. Choose proper capacity force transducer and, screw the connection rod and assemble this force transducer in the frame, then connect the measuring amplifier and switch it on for warming up.
b. Hold the calibrated spring impact hammer into the holding mechanism.
c. Move the wheel to make the calibrated impact hammer in contact to the connection rod and then adjust the digital indicator to be in contact with the upper ball of the calibrated spring hammer.
d. Adjust the calibrated device to its rated capacity.
e. Move the holding mechanism downwards gradually, by the power screw and the wheel, to bull the spring hammer to its rest position and record both the corresponding force transducer reading and the digital indicator reading.
f. Repeat step (e) three times as preload.
g. Adjust the calibrated device to its first calibration step, if any.
h. Repeat step (e) two times and record both the corresponding force transducer reading and the digital indicator reading.
i. Repeat step from (e) to for each calibration step in ascending order.
j. Rotate the calibrated device 180⁰ about its axis.
k. Repeat step (e) one more time for each calibration step in ascending order.
l. Record the temperature and humidity.
Two spring impact hammers are calibrated according to this proposed calibration procedure; the first one is a multi-step device with 1 J as the rated capacity and steps of (0.2, 0.35, 0.5, 0.7, 1) J, manufactured by PTL Dr. Grabenhorst GmbH and its model is F22.50, the second one is a single-step device with 0.5 J as a rated capacity, manufactured either by PTL Dr. Grabenhorst GmbH and its model is F22.16. Tables 1 and 2 show the calibration results of the first and the second spring impact hammers, respectively. A 100 N reference force transducer from GTM with 0.02% relative expanded uncertainty, and 30.4 mm measuring range digital indicator from Mitutoyo with maximum of 0.07% relative expanded uncertainty, are used.
Table 1. Calibration measurements of the 1 J spring impact hammer
|
|
Length (m) |
Force (N) |
||||
|
|
0° Orientation |
180° Orientation |
0° Orientation |
180° Orientation |
||
|
Nominal energy step (J) |
X1 |
X2 |
X3 |
X1 |
X2 |
X3 |
|
0.2 |
0.01105 |
0.01117 |
0.01108 |
40.278 |
41.933 |
43.414 |
|
0.35 |
0.01525 |
0.01571 |
0.01559 |
46.896 |
46.338 |
45.904 |
|
0.5 |
0.01872 |
0.01918 |
0.01904 |
57.006 |
57.880 |
58.414 |
|
0.7 |
0.02264 |
0.02307 |
0.02293 |
63.284 |
63.303 |
64.578 |
|
1 |
0.02749 |
0.02792 |
0.02780 |
77.024 |
80.906 |
77.799 |
Table 2. Calibration measurements of the 0.5 J spring impact hammer
|
|
Length (m) |
Force (N) |
|||||
|
|
0° Orientation |
180° Orientation |
0° Orientation |
180° Orientation |
|||
|
Nominal energy step (J) |
X1 |
X2 |
X3 |
X1 |
x2 |
X3 |
|
|
0.5 |
0.01496 |
0.01494 |
0.01495 |
68.100 |
67.871 |
67.881 |
|
4.1 Metrological characterization and analysis of the calibration results
4.1.1 Calculation of the actual energy value
The actual average energy value ($\bar{X}_i$) is calculated for each energy calibration step from the average calculated actual energies X1i, X2i, X3i using the following formulas:
$\bar{X}_i=\frac{X_{1_i}+X_{2_i}+X_{3_i}}{3}$ (8)
where,
X1i and X2i are the actual calculated energies at the 0⁰ orientation according to Eq. (7) (J), The subscription i indicates the calibration step.
X3i is the actual calculated energy at the 180° orientation according to Eq. (7) (J).
4.1.2 Calculation of the relative error
The relative error (as) is calculated for each calibration step using the following formula:
$a_s=\frac{\left(X n_I-\bar{X}_I\right) \times 100}{\bar{X}_I}$ (9)
where,
as is the calculated relative error (%).
Xni is the hammer’s nominal energy step (J).
4.2 Uncertainty sources
4.2.1 Standard uncertainty associated with the calibration force and length (w1)
w1 is the standard uncertainty of the reference force and length measuring device used. This value should be obtained from the calibration certificates of both reference force measuring device and length measuring device. w1 is calculated using the following formula:
$w_1=\sqrt{\left(\frac{W_{1 \text { force }}}{2}\right)^2+\left(\frac{W_{1 \text { length }}}{2}\right)^2}$ (10)
where,
w1 is standard uncertainty of the calibration machine (%).
W1force and W1length are the relative expanded uncertainty of the reference force measuring device and the length measuring device, respectively (%).
4.2.2 Uncertainty due to reproducibility (wR1)
This uncertainty source represents the influence of changing the orientation of the calibrated spring impact hammer around its axis. For each value of incremental steps, calculate the reproducibility of the actual energy from the first series at each orientation. The uncertainty due to the relative reproducibility variation is calculated using the following formulas:
$w_{R 1}=\frac{0.5 R_1}{\sqrt{3}}$ (11)
$R_1=\left|\frac{X_{1_i}-X_{3_i}}{\bar{X}_{13_i}}\right| \times 100$ (12)
where,
wR1 is the uncertainty due to reproducibility variation (%).
R1 is the relative reproducibility variation (%).
$\bar{X}_{13_i}$ is the calculated actual energy from series 1 (first series in the 0° orientation) and 3 (first series in the 180° orientation) (J).
4.2.3 Uncertainty due to repeatability (wR2)
The influence of repeatability should be calculated for each calibration step, from the first and second series at the 0° orientation. The uncertainty due to the relative repeatability variation is calculated using the following formulas:
$w_{R 2}=\frac{0.5 R_2}{\sqrt{3}}$ (13)
$R_2=\left|\frac{X_{1_i}-X_{2_i}}{\bar{X}_{12_i}}\right| \times 100$ (14)
where,
wR2 is the uncertainty due to repeatability variation (%).
R2 is the relative repeatability variation (%).
$\bar{X}_{12_i}$ is the calculated actual energy from series 1 and 2 at the 0° orientation (J).
Tables 3 and 4 show the calibration results of the 1 J spring impact hammer and the calculated errors and uncertainty sources.
Table 3. Analysis of the calibration results of the 1 J spring impact hammer
|
|
Actual Energy (J) |
|
||||
|
|
0° Orientation |
180° Orientation |
||||
|
Nominal Energy Step (J) |
X1 |
X2 |
X3 |
Actual Average Energy Value $\bar{X}_i$ (J) |
Relative Error as (%) |
Relative Expanded Uncertainty W (%) |
|
0.2 |
0.223 |
0.234 |
0.241 |
0.232 |
-13.9 |
5.37 |
|
0.35 |
0.358 |
0.364 |
0.358 |
0.360 |
-2.7 |
1.03 |
|
0.5 |
0.534 |
0.555 |
0.556 |
0.548 |
-8.8 |
3.30 |
|
0.7 |
0.716 |
0.730 |
0.740 |
0.729 |
-4.0 |
2.20 |
|
1 |
1.059 |
1.129 |
1.081 |
1.090 |
-8.2 |
3.93 |
Table 4. Calculated errors and uncertainties of the 1 J spring impact hammer
|
|
Relative Error of |
Relative Uncertainty of |
|||
|
Nominal Energy Step (J) |
Reproducibility R1 (%) |
Repeatability R2 (%) |
Reference Force and Length Devices w1 (%) |
Reproducibility w2 (%) |
Repeatability w3 (%) |
|
0.2 |
-7.77 |
-5.10 |
0.04 |
2.24 |
1.47 |
|
0.35 |
-0.07 |
-1.77 |
0.04 |
0.02 |
0.51 |
|
0.5 |
-4.13 |
-3.95 |
0.04 |
1.19 |
1.14 |
|
0.7 |
-3.30 |
-1.91 |
0.04 |
0.95 |
0.55 |
|
1 |
-2.12 |
-6.47 |
0.04 |
0.61 |
1.87 |
The absolute relative errors are ranging from less than 14% at the first calibration step up to less than 3%. The most relative errors are less than 10% with relative expanded uncertainty about 5%. These values are important for conformity statements in many applications which specify error of less than 10% taking into consideration the decision rule and the risk level. The main uncertainty sources in multi-step impact hammer are: the reproducibility and repeatability errors which may be caused by the adjusting mechanism and the rate of force application. Ensuring the alignment of the measurement setup and constant force application rate could improve the reproducibility and repeatability errors, respectively. The calibration results are in line with the results which could be obtained from different calibration techniques. Tables 5 and 6 show the calibration results of the 0.5 J spring impact hammer and the calculated errors and uncertainty sources.
The absolute relative error for the single-step impact hammer is less than 2% with a relative expanded uncertainty of less than 0.5%. The calibration results are in line with the results that could be obtained from different calibration techniques. The 10% error limit is also applied here for the conformity statement before put the impact hammer into service. Moreover, ensuring the alignment of the measurement setup and constant force application rate could improve the reproducibility and repeatability errors, respectively.
Table 5. Analysis of the calibration results of the 0.5 J spring impact hammer
|
|
Actual Energy (J) |
|
||||
|
|
0° Orientation |
180° Orientation |
||||
|
Nominal Energy Step (J) |
X1 |
X2 |
X3 |
Actual Average Energy Value $\bar{X}_i$ (J) |
Relative Error as (%) |
Relative Expanded Uncertainty W (%) |
|
0.5 |
0.509 |
0.507 |
0.507 |
0.508 |
-1.6 |
0.36 |
Table 6. Calculated errors and uncertainties of the 0.5 J spring impact hammer
|
|
Relative Error of |
Relative Uncertainty of |
|||
|
Nominal Energy Step (J) |
Reproducibility R1 (%) |
Repeatability R2 (%) |
Reference Force and Length Devices w1 (%) |
Reproducibility w2 (%) |
Repeatability w3 (%) |
|
0.5 |
0.39 |
0.47 |
0.04 |
0.11 |
0.14 |
New simple calibration technique with a proposed calibration procedure is introduced. The introduced work proposes a calibration procedure enhanced by experimental and analytical calculations for a commonly used spring impact hammer, either a single step or multistep device, based on the measurements of the spring compression force and the corresponding travelled distance. The proposed approach demonstrates an easy and applicable calibration scheme with the uncertainty analysis. The calibration procedure specifies three measurement series in two orientations with calibration steps in ascending order. Equations used to calculate the relative errors due to reproducibility and repeatability are presented. The overall relative expanded uncertainty including introduced error, the uncertainties of the reference force transducer and length measuring device used is presented. Two examples for calibrating a multi-step hammer and another single step hammer are presented with relative expanded uncertainties from 0.36% up to 5.37%.
The proposed mechanism shows an accurate and reliable procedure for calibrating the spring hammer rather than using pendulum impact calibration technique. Also, the benefit of this proposed approach is to easily achieve the traceability using direct realization of force and dimension measurement.
The influences of both the alignment of the measurement setup and rate of force application are considered for future investigation.
|
E |
the impact energy |
|
m |
weight of ball |
|
g |
gravitational acceleration, m.s-2 |
|
ats |
function of impulses response of the transfer standard |
|
vts |
measured output respon |
|
L |
laplace operator |
|
Vts |
measured response obtained by applying traceable dynamic force to the impact hammer |
|
Ats |
transfer function of the application transducer |
|
F |
applied dynamic force |
|
l |
measured distance by the digital indicator |
[1] Vlajic, N., Chijioke, A. (2016). Traceable dynamic calibration of force transducers by primary means. Metrologia. 53(4): S136. https://doi.org/10.1088/0026-1394/53/4/S136
[2] Khaled, K.M., Mahmoud, G. (2019). Modelling of the influence of tensile test speed on the fracture load. ASM Science Journal Open Access, 12: 1-12.
[3] International Electrotechnical Commission. (2014). Environmental testing – Part 2-75: Tests – Test Eh: Hammer tests (No.IEC 60068-2-75:2014). https://webstore.iec.ch/publication/558, accessed on Jul. 14, 2023.
[4] Schlegel, C., Kieckenap, G., Glockner, B., Buk, A., Kumme. R. (2012). Traceable periodic force calibration. Metrologia. 49(3): 224. https://doi.org/10.1088/0026-1394/49/3/224
[5] Mee, D.J. (2003). Dynamic calibration of force balances for impulse hypersonic facilities. Shock Waves, 12: 443-455. https://doi.org/10.1007/s00193-003-0181-6
[6] Chang, K.-C, Huang, B.-C., Chiu, C.-Y, Liu, Y.-C. (2014). A study of spring impact hammer to define the specification of impact test. Conference: IDW'14, the 21ST international display workshops.
[7] Gelany, S.A., Mahmoud, G. (2021). An investigation on using the falling mass technique for dynamic force calibrations. Metrology and Measurement Systems, 28(3): 455-463. https://doi.org/10.24425/mms.2021.137127
[8] Szilllgyi, K., Borosny, A., Zsigovics, I. (2011). Rebound surface hardness of concrete: Introduction to an empirical constitutive model. Construction and Building Materials, 25(5): 2480-2487. https://doi.org/10.1016/j.conbuildmat.2010.11.070
[9] Kobusch, M., Klaus, L. (2020). In-situ dynamic force calibration using impact hammers. ACTA IMEKO, 9(5): 118-123. https://doi.org/10.21014/acta_imeko.v9i5.952
[10] Kheder, G.F. (1999). A two stage procedure for assessment of in situ concrete strength using combined non-destructive testing. Materials and Structures, 32: 410-417. https://doi.org/10.1007/BF02482712
[11] Hobbs, B., Kebir, M.T. (2007). Non-destructive testing techniques for the forensic engineering investigation of reinforced concrete buildings. Forensic Science International, 167(2-3): 167-172. https://doi.org/10.1016/j.forsciint.2006.06.065
[12] Fujii, Y. (2006). Dynamic calibration methods for force transducers. In XVIII IMEKO World Congress: Metrology for a Sustainable Development, Rio de Janeiro, Brazil, pp. 17-22.
[13] European Standard. (2014). BS EN 1992-1-1:2004+A1:2014. Design of concrete structures- General rules and rules for buildings (No. BS EN 1992-1-1:2004+A1:2014).
[14] Fujii, Y., Fujimoto, H. (1999). Proposal for an impulse response evaluation method for force transducers. Measurement Science and Technology, 10(4): N31-33. https://doi.org/10.1088/0957-0233/10/4/006
[15] Vlajic, N., Chijioke, A. (2017). Traceable calibration and demonstration of a portable dynamic force transfer standard. Metrologia, 54(4): S83-S98. https://doi.org/10.1088/1681-7575/aa75da