Balasubramanian Sreedevi*![]() | George Suresh
| George Suresh![]() | Azath Mubarakali
| Azath Mubarakali![]() | Kalaichelvan Lalitha
| Kalaichelvan Lalitha![]()
© 2023 IIETA. This article is published by IIETA and is licensed under the CC BY 4.0 license (http://creativecommons.org/licenses/by/4.0/).
OPEN ACCESS
The early detection of abnormal changes in the Optic Disc (OD) and optic cup in the retina is a highly challenging task since there are no initial signs when glaucoma develops. The primary indicator for glaucoma is the ratio between the optic cup and OD. To compute the cup-to-disc ratio, the localization of OD is very important. This paper presents an approach for Optic Disc Localization (ODL) using semantic classification by deep learning. A computerized intact ODL system is developed by integrating the following two important modules; Preprocessing and localization modules. The initial area of interest around the OD is selected in the former module. Then, OD-DeepNet is specially designed to classify the pixels in the OD region by semantic approach. The dilated convolutions are recently gaining more attention in the field of image segmentation, and thus the proposed OD-DeepNet uses dilated convolutions with different dilation rates (4, 8, and 16). The analysis of the ODL system is performed on DRISHTI-GS1 (101 images) and RIM-ONE (169 images) database fundus images with nested (double) k-fold validation. The localized OD is evaluated in terms of accuracy, Dice coefficient, and Jaccard index. The OD-DeepNet provides 93.25% of average accuracy with a Dice coefficient of 0.921 and Jaccard index of 0.919. It is also observed that applying batch normalization with a batch size of 32 during training provides promising results.
Optic Disc, semantic classification, deep learning, glaucoma diagnosis, fundus images
Glaucoma is a sight-threatening condition due to the increase in intraocular pressure. The national glaucoma research states that over three million Americans aged 40 and above are affected by glaucoma and 80 million people worldwide. It will increase to 111 million by 2040. The changes in the Optic Cup (OC) require immediate medical attention. The primary indicator for glaucoma diagnosis is Cup-to-Disc Ratio (CDR). To compute CDR, the Optic Disc Localization (ODL) is very important before segmenting the OC. To compute CDR, the Optic Disc Localization (ODL) is very important before segmenting the OC. The imaging modalities such as fundus, fluorescein angiography, optical coherence tomography, magnetic resonance and ophthalmic ultrasound imaging are used for diagnosing glaucoma.
Much research on the localization of Optic Disc (OD) from fundus images has focused on developing automated tools without manual interaction. Because fundus images give high contrast characteristics than others, particularly it provides different colors from the red background of the retina. Researchers from all around the globe have come up with a variety of ways on fundus image categorization for glaucoma diagnosis. Some of the latest approaches are discussed in section 2.
A regression model is discussed in study [1] for ODL with fovea centers. At first, a heat map is generated using the available information in the ground truth data using a two-dimension Gaussian equation. The designed model can transform single-pixel values into feature space for ODL. Features from different scales are aggregated for glaucoma diagnosis in study [2]. It bridges the gap between localization and semantic information using multi-layer average pooling.
A Generative Adversarial Network (GAN) based ODL is described in study [3]. The fusion of low and high-level features is obtained by skip connection, and the cross-entropy loss function is used for the segmentation. Also, it uses data augmentation and transfer learning to overcome overfitting problems during training. A region-based approach is discussed in study [4] for OD and OC segmentation. Two networks are designed to segment OD and OC independently. A disc attention module connects the two networks. The segmentation of OD using attention gates is described in study [5] with Condition Random Fields (CRFs). The conventional architectures such as U-net and DeepLab are modified for effective segmentation by integrating attention modules connected between the encoder and decoder. Also, the fully connected layer is supported with CRFs for better performance.
A multi-label deep network is described in study [6] for OD segmentation by polar transformation. A one-stage system labels the OD and OC pixels using a U-shape deep network. A multi-label loss function is also developed for effective training. The polar transformed image is fed to the network instead of the original fundus image. Glaucoma diagnosis with vertical CDR is discussed in study [7]. The OD is segmented out using shifted filter responses. The responses from bright circular regions and divergent points of vessel trees are combined for the segmentation. Then matrix learning vector quantization is employed to segment OD and OC.
A patch-based GAN system is discussed in study [8] for OD and OC segmentation. AT first, a lightweight network is designed, and then a morphology-aware segmentation loss function is developed for smooth and accurate segmentation. The patch-based system discriminates the OD pixels more effectively than the convention system with an adversarial loss function. A joint OD and OC segmentation is described in study [9] using an encoder and decoder network. The segmentation is considered a pixel-wise labeling system with preprocessing and post-processing to reduce the complexity. A fuzzy broad learning approach is discussed in study [10] for glaucoma diagnosis. Two individual learning systems are developed using green and red channel images. At first, the region of interest is extracted, then data augmentation is employed to increase the samples.
Semi-supervised learning is implemented in study [11] for glaucoma diagnosis. It involves a two-stage cascaded approach with feature representation by a deep learning approach and CDR by random forest regressor. A disc-aware network is designed in study [12] for glaucoma screening with an ensemble approach. It integrates the local information of the OD region with the in-depth features from the original fundus image. The final result is obtained from the fusion of probabilities of different streams. Multi-view in formation based glaucoma screening is described in study [13]. The conventional Active Contour Model (ACM) is modified with the help of shape and appearance details.
The locally statistically ACM addresses the in homogeneity phenomenon. Structure learning is introduced in study [14] for locating the OD region. The edge map of OD is obtained via the classifier model based on the structure learning followed by thresholding. Then, the OD boundary is obtained by the circular Hough transform. Linear vector quantization is employed in study [15] for glaucoma diagnosis. At first, OD is extracted from the green channel image, and five spatial filters are utilized to extract micro statistical features. Recent deep learning and machine learning based systems to diagnose glaucoma are reported in studies [16-18].
The quality of the features and classifiers used in standard classification systems is directly related to the performance of these systems. It's possible for an excellent classifier to provide poor results if the characteristics it uses to make decisions lack discriminating power, and vice versa. Additionally, in order to extract characteristics, one has to have enough understanding of the domain. Recent developments in Deep Learning (DL) employing CNN have allowed for the creation of several computerized diagnostic systems in the medical field that do not need a separate phase for feature extraction. In order to use deep learning of fundus images for ODL for glaucoma diagnosis, OD-DeepNet model is constructed in this work and then examined using two distinct databases such as DRISHTI-GS1 [19] and RIM-ONE [20].
This paper presents an efficient ODL system using deep learning based semantic classification. The proposed ODL system is attractive as it eliminates operator-dependent variability. The rest of the paper is as follows: Section 2 presents the ODL system using fundus images through semantic classification. Section 3 describes the performances of the ODL system on DRISHTI-GS1, and RIM-ONE database images. The proposed ODL system and the results are summarized in the last section with the conclusions.
The computation of CDR for diagnosing glaucoma requires the region of OD to be identified from the fundus images, which involves localization or segmentation. Image segmentation can be classified into two types: low-level segmentation and model-based segmentation. The former analyzes the low-level features such as intensity, shape, colour, and texture for the segmentation. In contrast, the model-based systems utilize the object's structure, such as global shape and semantic concept. The aim of this approach is to transform a pixel p of an image in the DataBase (DB) into one of the two classes (c), either normal or abnormal. It can be defined by
$A_{D B}: p \rightarrow c \quad$ or $\quad c=A_{D B}(p)$ (1)
where, $A_{D B}$ is the approach (semantic classification) that predict p into one of c classes using DB. Figure 1 shows the proposed ODL system using fundus images.
It consists of preprocessing and semantic classification modules. The integration of these modules generates a computerized intact ODL system. In the preprocessing stage, an initial OD region is extracted to reduce the computational complexity of semantic classification module. When examining the fundus image via the green channel, the OD appears the brightest area. Thus, the initial region is extracted from the green channel and then superimposed with the original image to get the OD regions in colour domain. The discriminating information for characterizing OD are obtained by utilizing the atrous convolution by the proposed OD-DeepNet architecture.
Figure 1. Proposed ODL approach using OD- DeepNet
3.1 Preprocessing
The accuracy and speed of any segmentation system depend on the size of the local area over which the system is operated. Thus, in this stage, the local area around the OD region is segmented by utilizing the property of OD [21]. In the fundus image, the brightest intensities belong to the OD region. Hence, the brightest pixels are searched at first. Then, the area around those pixels is segmented. This preprocessing step is applied to the DRISHTI-GS1 images only as the RIM-ONE images are already cropped from the original images. Figure 2 (a) shows the original DRISHTI-GS1 images, and Figure 2 (b) shows the area around that consists of OD. The size of the extracted OD is 600×600 pixels.
Figure 2. (a) Original DRISHTI-GS1 images (b) Initial OD region
3.2 Semantic classification
Once the fundus image has been preprocessed, the exact OD region is segmented using the proposed OD-DeepNet architecture. Figure 3 shows the OD-DeepNet architecture.
The proposed OD-DeepNet uses dilated convolutions with different Dilation Rates (DRs), representing the spacing between the kernel's values. It is well known that dilated convolutions are recently gaining more attention in image segmentation [22, 23]. From the preprocessed image, only the OD region is cropped by morphological operations and then fed to the proposed system for faster segmentation using semantic classification.
The atrous convolution in the proposed OD-DeepNet enlarges the kernel's field of view. The capabilities of traditional convolutional processes can be expanded using atrous convolution, also known as dilated convolution. It involves inserting gaps (dilations) between the kernel parts. A normal convolutional operation involves applying a kernel to a receptive field, which is a localized portion of the input data. The process of producing a single output value involves multiplying each element of the kernel by the matching element in the receptive field, and then adding the products of these multiplications together. In order to create a feature map, this procedure must be carried out throughout the whole of the input. The idea of dilatation is brought into the kernel by the use of atrous convolution. The term "dilation" refers to the distance between each constituent of the kernel. When performing a conventional convolution, the value of the dilation parameter is always set to 1, which indicates that neighboring components in the kernel are utilized for calculation. However, with atrous convolution, the dilation may be more than 1, which enables the incorporation of gaps between the kernel parts. This is accomplished using a process known as atrous convolution.
Atrous convolution is a technique that may effectively extend the receptive field of a convolutional layer without increasing the number of parameters or the amount of work that must be done computationally. This is accomplished by utilizing greater dilations. This increased receptive field allows the network to acquire more contextual information, which is especially helpful for tasks that require the fine-grained processing of pictures, such as object segmentation or detection. The technique of atrous convolution has seen widespread use in the designs of deep learning systems, particularly in the area of semantic segmentation. The dilation rate is a hyper parameter that regulates the spacing between the kernel components. This hyperparameter may be modified based on the particular needs of the job as well as the desired size of the receptive field. For a one-dimensional signal x, the atrous convolution with kernel w of size k is defined as:
$\operatorname{atrous}[i]=\sum_{j=1}^k x[i+D R \cdot j] w[j]$ (2)
Different DR produces different atrous convolution. For DR=1, Eq. (2) becomes standard convolution. The proposed OD-DeepNet uses Spatial Pyramid Pooling (SPP) [24], which segments the OD at multiple scales. As the size of the OD region is different, the SPP is employed, which removes the fixed-size constraint. It produces outputs with a fixed length, preventing initial cropping. In SPP, the in-depth features on a single-scale are rescaled to an arbitrary scale. This approach helps to classify the regions than single scale features accurately. The proposed OD-DeepNet uses multiple atrous convolutions in parallel with different DRs (4, 8, and 16). Further processing is applied to the extracted features to locate the final OD by fusing the features.
The proposed OD-DeepNet uses Visual Geometry Group (VGG)-16 network weights [25], with two targets (OD and non-OD pixels) to reduce the computation complexity. VGG-16 is a popular object recognition deep learning architecture that provides better results for detecting 1000 objects. The proposed system uses the ImageNet pre-trained weights of VGG-16, and the classification layer is only modified to segment the OD region with the help of transfer learning. The cross-entropy loss from each spatial position is summed up (overall loss) while training, and the weights are optimized using the stochastic gradient descent procedure. The cross-entropy loss is defined by:
Loss $=-\sum_{j=1}^c t_j \log \left(p_j\right)$ (3)
where, truth label is tj and the probability for the jth class is pj. The system uses batch normalization to standardize the inputs and accelerates the training for better classification. The proposed system uses a batch size of 32. The rectified linear activation function is used in the hidden layers for simplicity. Though different activation functions (linear, sigmoid, and softmax) can be used at the output layer, the sigmoid function is employed in this work as it uses probability distributions for the classification. It is defined by:
soft_max $(\mathrm{i})=\frac{\mathrm{e}^{\mathrm{X}_{\mathrm{i}}}}{\sum_{j=1}^{\mathrm{N}} \mathrm{e}^{\mathrm{x}_{\mathrm{j}}}}$ (4)
Figure 3. Proposed OD-DeepNet architecture
where, Xi is the output value of ith layer and N is the number of output layer. Figure 4 shows the softmax function used before the score map.
Figure 4. Softmax function
The performances of the proposed ODL system are discussed in this section. When considering supervised classification, the system must be trained to make the correct classification. To train the network, a large number of samples whose classification is known a priori are prepared.
4.1 Database
The proposed ODL system uses samples from two databases; DRISHTI-GS1 [19] and RIM-ONE [20]. For each fundus image, the location of OD is also given, which is used to evaluate the proposed ODL system. Figure 5 shows sample images in these two databases.
Figure 5. Database images
4.2 Validation method
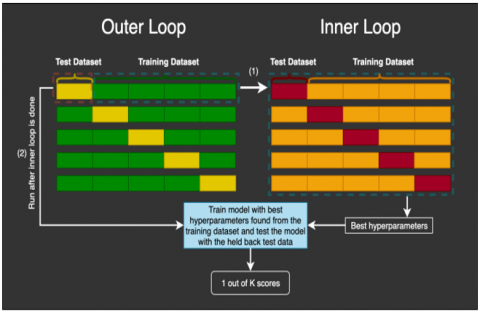
Figure 6. Nested k-fold validation scheme
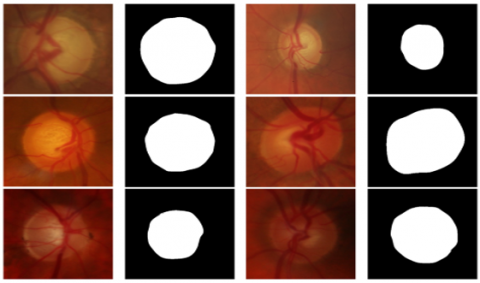
The DRISHTI-GS1 and RIM-ONE databases contain a total of 101 images (31 normal and 70 glaucoma images) with a resolution of 2896×1944 pixels and 169 images (92 normal, 39 glaucoma, and 38 suspicious images) with a resolution of 2144×1424 pixels respectively. For the evaluation, nested k-fold cross-validation is used. The outer loop uses 10-fold, and the inner loop uses 3-fold cross-validation. It is shown in Figure 6. The validation scheme optimizes the hyper-parameter under the model selection. It is also called double cross-validation. It can also reduce the bias between the model selection and the hyper-parameter tuning. The ground truth data of the testing samples is not supplied to the classifier and is used only for the ODL system evaluation. Figure 7 shows the ground truth images.
Figure 7. Ground truth image (a) DRISHTI-GS1 (b) RIM-ONE
4.3 Performance metrics
The performance of the ODL system is validated using the measures shown in Table 1. In Table 1, T represents True (correct), F represent False (incorrect), P represents Positive (OD pixels) and N represents Negative (non OD pixels). The accuracy in image segmentation approach refers to the degree of correctness or precision in the process of segmenting an image into meaningful and semantically coherent regions or segments. It is typically measured by comparing the segmentation results against ground truth annotations. In this study, pixel accuracy is employed for the accuracy calculation. It measures the percentage of correctly classified pixels in the segmentation output compared to the ground truth. This metric does not take into account the spatial extent or shape of the segmented regions. A value of 100% indicates a perfect segmentation.
Dice coefficient measures the similarity between the predicted and ground truth segments. It is calculated as twice the intersection divided by the sum of areas of predicted and ground truth regions. A value of 1 indicates a perfect segmentation. Jaccard Index calculates the overlap between the predicted segmentation and the ground truth. It is computed by dividing the area of intersection by the area of union between the predicted and ground truth regions. A higher Jaccard Index indicates a more accurate segmentation.
Table 1. Performance measures of PODL approach
|
Measure (%) |
Formula |
|
Accuracy [26] |
$\frac{T P+T N}{T P+T N+F P+F N}$ |
|
Dice coefficient [27] |
$\frac{2 \times T P}{(2 \times T P)+F P+F N}$ |
|
Jaccard index [27] |
$\frac{T P}{T P+F P+F N}$ |
4.4 Performance evaluation
The proposed ODL system is evaluated using four different inputs to the OD-DeepNet; Red (R), Green (G) and Blue (B) channel of the initial OD segmented image and the original colour image of the initial OD segmented image. Figure 8 shows the inputs to the OD-DeepNet system for ODL. Figure 9 shows the output of the OD-DeepNet and Table 2 shows the average performance measures of the OD-DeepNet system for different inputs.
Figure 8. Different inputs to the OD-DeepNet system for ODL
Figure 9. Segmentation results of the OD-DeepNet using R channel image
Table 2. Average performance measures of the OD-DeepNet system for different inputs
|
Measure (%) |
R |
G |
B |
Color |
|
Accuracy |
93.25% |
90.11% |
84.32% |
91.44% |
|
Dice coefficient |
0.921 |
0.890 |
0.815 |
0.909 |
|
Jaccard index |
0.919 |
0.887 |
0.807 |
0.897 |
Figure 10. OD-DeepNet performance comparison with BN
It can be seen from Table 2 that the OD-DeepNet provides 93.25% average accuracy for locating the OD while using the R channel of the initial segmented output from the preprocessing module. The colour RGB OD image provides 91.44% of average accuracy. It is observed from Figure 8 that the worst performer is the B channel, as the OD is not visible in that channel. The R channel image obtains a maximum of 0.921(Dice coefficient) and 0.919 (Jaccard index). Figure 10 shows the performance comparison of OD-DeepNet with batch normalization (BN) and without BN. It is inferred from Figure 9 that the OD-DeepNet provides better results when using BN to train the network.
It can be seen from Figure 10 that the OD-DeepNet provides promising results with BN with an accuracy of 93.25%, whereas it is 89.25% without BN. It is noted that a 2% improvement in the Dice measure is observed when using BN, and a 2.7% improvement is observed in the Jaccard index measure. The proposed OD-DeepNet is compared with other techniques in the literature to show its effectiveness. Table 3 shows the comparative analysis of the OD-DeepNet system.
Table 3. Comparative analysis of the OD-DeepNet system
|
Measure (%) |
[15] |
[18] |
OD-DeepNet |
|
Accuracy |
90.25% |
91.58% |
93.25% |
|
Dice coefficient |
0.897 |
0.914 |
0.921 |
|
Jaccard index |
0.892 |
0.902 |
0.919 |
In this work, the proposed semantic classification is applied to the problem of detecting OD in digital fundus images of the retina. To overcome the large inter and intra-observer variability of manual OD segmentation, a fully automated ODL system has been developed that segments OD directly from the fundus images. An initial OD region is cropped around the brightest intensity region in the fundus image. Then, the proposed OD-DeepNet architecture is employed for accurate ODL. It uses multiple atrous convolutions in parallel with different DRs and SPP for the segmentation. The proposed system is trained on the training set from two databases, DRISHTI-GS1 and RIM-ONE and then tested against the test set. The proposed system is tested on these databases independently. Results show that the proposed ODL system is an attractive alternative that improves the reliability of fully automated segmentation systems to reduce the inaccuracies of manual segmentation and the stress on ophthalmologists. It is concluded that the development of the ODL system is justified as it provides promising results in terms of the Dice coefficient and accuracy of the segmented OD region.
This research is done with the financial support by the Deanship of Scientific Research at King Khalid University (Grant No.: R.G.P.2/338/44).
[1] Bhatkalkar, B.J., Nayak, S.V., Shenoy, S.V., Arjunan, R.V. (2021). FundusPosNet: A deep learning driven heatmap regression model for the joint localization of optic disc and fovea centers in color fundus images. IEEE Access, 9: 159071-159080. https://doi.org/10.1109/ACCESS.2021.3127280
[2] Liao, W., Zou, B., Zhao, R., Chen, Y., He, Z., Zhou, M. (2019). Clinical interpretable deep learning model for glaucoma diagnosis. IEEE Journal of Biomedical and Health Informatics, 24(5): 1405-1412. https://doi.org/10.1109/JBHI.2019.2949075
[3] Jiang, Y., Tan, N., Peng, T. (2019). Optic disc and cup segmentation based on deep convolutional generative adversarial networks. IEEE Access, 7: 64483-64493. https://doi.org/10.1109/ACCESS.2019.2917508
[4] Jiang, Y., Duan, L., Cheng, J., Gu, Z., Xia, H., Fu, H., Li, C., Liu, J. (2019). JointRCNN: A region-based convolutional neural network for optic disc and cup segmentation. IEEE Transactions on Biomedical Engineering, 67(2): 335-343. https://doi.org/10.1109/TBME.2019.2913211
[5] Bhatkalkar, B.J., Reddy, D.R., Prabhu, S., Bhandary, S.V. (2020). Improving the performance of convolutional neural network for the segmentation of optic disc in fundus images using attention gates and conditional random fields. IEEE Access, 8: 29299-29310. https://doi.org/10.1109/ACCESS.2020.2972318
[6] Fu, H., Cheng, J., Xu, Y., Wong, D.W.K., Liu, J., Cao, X. (2018). Joint optic disc and cup segmentation based on multi-label deep network and polar transformation. IEEE Transactions on Medical Imaging, 37(7): 1597-1605. https://doi.org/10.1109/TMI.2018.2791488
[7] Guo, J., Azzopardi, G., Shi, C., Jansonius, N.M., Petkov, N. (2019). Automatic determination of vertical cup-to-disc ratio in retinal fundus images for glaucoma screening. IEEE Access, 7: 8527-8541. https://doi.org/10.1109/ACCESS.2018.2890544
[8] Wang, S., Yu, L., Yang, X., Fu, C.W., Heng, P.A. (2019). Patch-based output space adversarial learning for joint optic disc and cup segmentation. IEEE Transactions on Medical Imaging, 38(11): 2485-2495. https://doi.org/10.1109/TMI.2019.2899910
[9] Tabassum, M., Khan, T.M., Arsalan, M., Naqvi, S.S., Ahmed, M., Madni, H.A., Mirza, J. (2020). CDED-Net: Joint segmentation of optic disc and optic cup for glaucoma screening. IEEE Access, 8: 102733-102747. https://doi.org/10.1109/ACCESS.2020.2998635
[10] Ali, R., Sheng, B., Li, P., Chen, Y., Li, H., Yang, P., Jung, Y., Kim, J., Chen, C.L.P. (2020). Optic disk and cup segmentation through fuzzy broad learning system for glaucoma screening. IEEE Transactions on Industrial Informatics, 17(4): 2476-2487. https://doi.org/10.1109/TII.2020.3000204
[11] Zhao, R., Chen, X., Liu, X., Chen, Z., Guo, F., Li, S. (2019). Direct cup-to-disc ratio estimation for glaucoma screening via semi-supervised learning. IEEE Journal of Biomedical and Health Informatics, 24(4): 1104-1113. https://doi.org/10.1109/JBHI.2019.2934477
[12] Fu, H., Cheng, J., Xu, Y., Zhang, C., Wong, D.W.K., Liu, J., Cao, X. (2018). Disc-aware ensemble network for glaucoma screening from fundus image. IEEE Transactions on Medical Imaging, 37(11): 2493-2501. https://doi.org/10.1109/TMI.2018.2837012
[13] Gao, Y., Yu, X., Wu, C., Zhou, W., Wang, X., Chu, H. (2019). Accurate and efficient segmentation of optic disc and optic cup in retinal images integrating multi-view information. IEEE Access, 7: 148183-148197. https://doi.org/10.1109/ACCESS.2019.2946374
[14] Fan, Z., Rong, Y., Cai, X., Lu, J., Li, W., Lin, H., Chen, X. (2017). Optic disk detection in fundus image based on structured learning. IEEE Journal of Biomedical and Health Informatics, 22(1): 224-234. https://doi.org/10.1109/JBHI.2017.2723678
[15] Alagirisamy, M. (2021). Micro statistical descriptors for glaucoma diagnosis using neural networks. International Journal of Advances in Signal and Image Sciences, 7(1): 1-10. https://doi.org/10.29284/ijasis.7.1.2021.1-10
[16] Geetha, A., Prakash, N.B. (2022). Classification of glaucoma in retinal images using efficientnetB4 deep learning model. Computer Systems Science and Engineering, 43(3): 1041-1055. http://doi.org/10.32604/csse.2022.023680
[17] Rebinth, A., Kumar, S.M. (2022). Soft computing based discriminator model for glaucoma diagnosis. Computer Systems Science & Engineering, 42(3): 867-880. http://doi.org/10.32604/csse.2022.022955
[18] David, D.S., Selvi, S., Sivaprakash, S., Raja, P.V., Sharma, D.K., Dadheech, P., Sengan, S. (2022). Enhanced detection of glaucoma on ensemble convolutional neural network for clinical informatics. Computers, Materials & Continua, 70(2): 2563-2579. https://doi.org/10.32604/cmc.2022.020059
[19] Sivaswamy, J., Krishnadas, S.R., Joshi, G.D., Jain, M., Tabish, A.U.S. (2014). Drishti-GS: Retinal image dataset for optic nerve head (ONH) segmentation. In 2014 IEEE 11th International Symposium on Biomedical Imaging (ISBI), Beijing, China, pp. 53-56. https://doi.org/10.1109/ISBI.2014.6867807
[20] Fumero, F., Alayón, S., Sanchez, J.L., Sigut, J., Gonzalez-Hernandez, M. (2011). RIM-ONE: An open retinal image database for optic nerve evaluation. In 2011 24th International Symposium on Computer-Based Medical Systems (CBMS). Bristol, UK, pp. 1-6. https://doi.org/10.1109/CBMS.2011.5999143
[21] Ganeshbabu, T.R. (2015). Computer aided diagnosis of glaucoma detection using digital fundus image. International Journal of Advances in Signal and Image Sciences, 1(1): 1-11. https://doi.org/10.29284/ijasis.1.1.2015.1-11
[22] Gao, Y., Chen, X., Liu, A., Liang, D., Wu, L., Qian, R., Xie, H., Zhang, Y. (2022). Pediatric seizure prediction in scalp EEG using a multi-scale neural network with dilated convolutions. IEEE Journal of Translational Engineering in Health and Medicine, 10: 1-9. https://doi.org/10.1109/JTEHM.2022.3144037
[23] Liu, R., Cai, W., Li, G., Ning, X., Jiang, Y. (2021). Hybrid dilated convolution guided feature filtering and enhancement strategy for hyperspectral image classification. IEEE Geoscience and Remote Sensing Letters, 19: 1-5. https://doi.org/10.1109/LGRS.2021.3100407
[24] He, K., Zhang, X., Ren, S., Sun, J. (2015). Spatial pyramid pooling in deep convolutional networks for visual recognition. IEEE Transactions on Pattern Analysis and Machine Intelligence, 37(9): 1904-1916. https://doi.org/10.1109/TPAMI.2015.2389824
[25] Simonyan, K., Zisserman, A. (2014). Very deep convolutional networks for large-scale image recognition. arXiv Preprint arXiv: 1409.1556. https://doi.org/10.48550/arXiv.1409.1556
[26] Jacob, S., Rosita, J.D. (2021). Fractal model for skin cancer diagnosis using probabilistic classifiers. International Journal of Advances in Signal and Image Sciences, 7(1): 21-29. https://doi.org/10.29284/ijasis.7.1.2021.21-29
[27] Justin, S., Pattnaik, M. (2020). Skin lesion segmentation by pixel by pixel approach using deep learning. International Journal of Advances in Signal and Image Sciences, 6(1): 12-20. https://doi.org/10.29284/ijasis.6.1.2020.12-20