Rama Vasantha Adiraju*![]() | Susan Elias
| Susan Elias![]()
© 2023 IIETA. This article is published by IIETA and is licensed under the CC BY 4.0 license (http://creativecommons.org/licenses/by/4.0/).
OPEN ACCESS
The main aim of our study is to estimate the temporal stability and assess the prognostic performance of radiomic features extracted from lung computer tomography (CT) images. We have considered the Lung CT diagnosis dataset for our work which contains 61 patients identified with lung adenocarcinoma cases. In this work, we have segmented 284 nodules by applying the random walk ensemble segmentation technique, and thirty- eight radiomic features were extracted from the segmented nodule region. These features include 19 gray-level co-occurrence (GLCM)-based features and 7 gray-level run length matrix (GLRLM)-based features, 12 histogram-based features. Later, the temporal stability was explored by considering Intra-class correlation coefficients (ICC) between features extracted from segmented nodule regions using our proposed segmentation technique and the segmented ground truth images provided by radiologists in the LungCT-Diagnosis dataset publicly available in The Cancer Imaging Archive (TCIA). The prognosis performance of features with temporal stability was assessed based on the Kaplan-Meier survival analysis. It has been observed that 16 radiomic features exhibited temporal stability, and seven temporally stable features have a statistically strong prognostic association with patient survival. This work explores the temporal stability and prognostic power of radiomic features using survival analysis to achieve optimum treatment planning at an early stage of diagnosis in lung adenocarcinoma cases.
temporal stability of radiomic features, lung nodule segmentation, survival analysis, radiomic features, computer tomography, prognostic power, Kaplan-Meier survival curve
1.1 Lung cancer and its impact
Lung cancer is the most dangerous cancer in the world. According to the International Agency for Research on Cancer 2020, lung cancer is the primary cause of death related to cancer worldwide [1]. It has been observed that most causes of death in the United States of America are due to lung cancer. Figure 1 shows the cancer statistics reported by the mortality rates of lung cancer compared to other cancers [2].
The main goal of lung cancer therapy is to provide optimal personalized treatment for a patient based on the behavioral changes of their disease. Accurate radiological assessment is an essential outcome in clinical practices and treatment planning. The primary indication of lung cancer is a nodule or tumor located inside or attached to the pleural wall of the lung. This infected region may have uneven growth, and there might be a chance of an increase in its size. Even though various treatment options are available, such as chemotherapy, surgery, and radiotherapy, the 5-year survival rate is relatively low [5].
1.2 Image modalities for lung cancer diagnosis
Over a few decades, extensive utilization of non-invasive process that involves imaging tools which have played a vital role in diagnosing various diseases, and different modalities were developed, such as Computer Tomography (CT), Magnetic resonance imaging (MRI), and positron emission tomography (PET) to help the radiologist in diagnosing lung cancer at its early stage. Out of these modalities, CT has been identified as a standard modality in detecting lung cancer at an early stage
1.3 Radiomics in lung cancer research
Most of the research has been carried out in detecting and classifying lung tumors using image processing; on the other hand, many researchers have focused on developing CT-based quantitative prognostic image biomarkers derived from segmented regions of the tumor. These works have identified that these quantitative features have great potential for predicting survival outcomes of patients with lung cancer [6-9] and can build a powerful prognosis in designing an optimal decision system for treatment planning which may not be obtained from visual interpretation alone. According to the survey [10], most studies were conducted on detecting and classifying lung nodules rather than predicting a patient’s survival. However, many approaches have been developed for quantitative imaging biomarkers to predict survival analysis. Hawkins et al. [11] extracted 2D and 3D features from the region growing segmentation technique and predicted the survival analysis using the Kaplan Meier plot (KM plot) with a p-value of 0.0219. This basic region-growing segmentation fails to segment the nodules attached to the lung’s pleural wall. Then Grove et al. [12] have done survival analysis by developing two CT quantitative descriptors, such as convexity and entropy, using single click ensemble segmentation [13] using a KM plot with a p-value of 0.0080 and 0.0404, respectively. However, one must ensure the proper pre-processing step; otherwise, it may result in improper extraction of the nodule region. Later, Paul et al. [14] predicted long-term and short-term survival by integrating five standard features with five deep-neural networks and followed Hawkins et al. [11] in extracting traditional features using the region-growing features segmentation method. The studies discussed have used a common dataset, i.e., the LungCT-diagnosis dataset, where all the patients were diagnosed with lung adenocarcinoma.
On the other hand, radiomic techniques played an essential role in extracting quantitative features from medical images and were termed radiomic features [15, 16]. These radiomic features were first proposed in 2012 and have experienced exponential growth in highlighting the tissue characteristics in the nodule when compared to a clinician. The main applications of radiomic feature extraction are prognostics and classification. The classification is mainly used to determine the malignancy and segmentation of lung diseases, whereas prognostic deals with treatment response and survival analysis. Ge and Zhang [17] have identified that there was a tremendous increase in the applications of radiomic techniques associated with lung CT images over the past decades and found that most of the research has been carried out on radiomic feature extraction associated with classification [18-23] rather than prognostic [24-26] illustrated in the Figure 2 a)-b).
1.4 Current limitations and the scope of this study
The following limitations were identified in the previous studies:
Figure 1. Global Cancer Statistics - estimated new cases and deaths [2]
Figure 2a). Depicts the growth of the radiomics studies in CT images associated to lung cancer has been increasing gradually past 7 years
Figure 2b). Represents number of research articles published on classification and prognostic studies in lung cancer + CT + radiomics [16]
We have addressed and overcome the limitations mentioned above. Our study focused on prognostic studies by examining the prognostic power and temporal stability of radiomic features extracted from nodule-segmented regions of lung CT images. As discussed earlier in the previous session regarding the importance of radiomics, the prognostics study of the radiomic features using survival analysis can build personalized decision-making for better treatment planning. We have also proposed a novel semi-automatic hybrid segmentation model that can efficiently segment different lung nodules, mainly juxta-pleural nodules, and we have chosen the Lung CT-Diagnosis dataset from TCIA, which consists of ground-truth segmentation annotations. Our study mainly focused on prognostic studies by examining the prognostic power and temporal stability of radiomic features extracted from nodule-segmented regions of lung CT images.
2.1 Overall process
The overall process of the proposed workflow is illustrated in Figure 3, where we have estimated the stability of radiomic features and assessed the prognostic power based on survival analysis. In this work, to estimate the temporal stability, the intra-class correlation coefficient (ICC) values were considered between the radiomic features extracted from nodule segmented region using our proposed segmentation technique and the ground-truth segmented nodules available in the Lung CT-Diagnosis dataset. We have proposed a random-walk ensemble segmentation technique which is a new approach and can be able to segment all the different types of nodules, whereas the ground-truth segmented regions were obtained from the region-growing algorithm, which was applied under the supervision of radiologists. Once the temporally stable features were selected using ICC analysis, the prognostic power of these features was analyzed using a Kaplan-Meier survival plot based on the p-value of patient survival.
2.2 Study population
The Lung CT-Diagnosis dataset is used in this work, which is publicly available in The Cancer Imaging Archive (TCIA) and maintained by the Moffitt cancer centre [27]. The CT images were acquired by standard-of-care, contrast-enhanced CT scans among patients with non-small cell cancer with biopsy-verified adenocarcinoma with 2 years of follow-up. This dataset provides 4,682 lung CT images of 61 patients diagnosed with lung adenocarcinoma and clinical information such as TNM staging, mortality status, and patient survival time. These pretreatment CT scans were acquired between 2006 and 2009 and were represented as DICOM (Digital Imaging Communication Medicine) with a slice thickness of 3 mm to 6 mm. Out of 4,682 CT images, we have identified nearly 284 CT images containing nodules using metadata of all patients and extracted these CT images using ITK-Snap. ITK-Snap tool is a freeware and interactive tool that plays a vital role in the medical imaging community (http://itksnap.org) [28]. ITK - SNAP default navigation window is illustrated in Figure 4. The series of CT image slices of each patient containing lung nodules are identified using the axial view shown in Figure 4. Then we converted the DICOM format of each CT slice, i.e., dcm, to png format, i.e., png. Next, we extracted lung nodules using the segmentation technique from these CT images, explained in the below section.
Figure 3. The overall process to assess the prognostic power of radiomic features is based on survival analysis
Figure 4. ITK-SNAP navigation windows
2.3 Random walk - ensemble segmentation
Segmentation is a primary step to extract the nodule or infection region from lung CT images. As discussed in the earlier section 1.2, most of the researchers have applied basic segmentation techniques, where we have observed that these techniques failed in the case of juxta-pleural nodules, i.e., these lung nodules were extracted along with the other parts of the lung. This improper segmentation may affect further steps, such as feature extraction, which can be used in classification, detection, and prognostic studies. Even though distinct segmentation techniques were proposed to segment juxta-pleural and juxta-vascular individually [29], it is still challenging.
Here, we have proposed a novel method to segment all the different types of nodules. In this approach, we have integrated a random-walk algorithm with an ensemble process in a single-click ensemble segmentation technique. We have optimized the initialization of seed point selection through the ensembling method. In this method, the initialization is done with two data points: 1) A foreground data point should be selected inside the tumor region, and 2) A background data point should be selected healthy region of the lung. The implementation of lung nodule segmentation using a Random-walk (RW)-ensemble approach is better explained with the help an algorithm 1.
|
Algorithm 1: Nodule segmentation using the RW-ensemble approach |
|
Input: Lung CT images with nodules The implementation process of the proposed model: 01: Start # Load the dataset 02: Consider the number of patients (P) in the dataset 03: For each patient (P) in the dataset 04: Count the number of CT images (N) of a patient P 05: Initialize a temporary variable $\rightarrow$ temp_out = zeros(size(N)) # Nodule Segmentation 06: For each N of a patient P 07: Choose (x1,y1): foreground seed point inside the nodule region 08: Choose (x2,y2): background seed point exterior region of the nodule 09: Apply Random-walk algorithm on the each CT image N $\rightarrow$ seg_out= random-walk (N, (x1,y1),(x2,y2)) 10: Obtain segmented mask by the process of thresholding 11: Consider (i, j) = size(seg_out) 12: For Each value of (i, j) 13: If seg_out (i, j)>= threshold value 14: Assign $\rightarrow$ seg_mask (i, j) = 1; 15: Else 16: Assign $\rightarrow$ seg_mask (i, j) = 0; 17: End If 18: End For # Ensembling Process 19: The obtained segmented mask is ensembled with the temp_out $\rightarrow$ temp_out= seg_mask ∩ temp_out 20: End For 21: Thus, the temp_out represents the final segmented output, obtained by ensembling N segmented masks of a patient P 22: End For 23: Stop |
|
Output: Lung nodule segmented region |
2.4 Radiomic feature extraction
The thirty-eight radiomic features were extracted from the segmented nodule output, out of which 26 texture features were extracted and 12 histogram-based features were extracted using MATLAB. Gray Level Co-occurrence Matrix (GLCM) and Gray Level Run Length Matrix (GLRLM) are two commonly used methods for extracting texture features from images where 19 GLCM-based features and 11 GLRLM-based features were computed with the help of formulas defined in studies [30, 31]. We have computed these features using radiomic tools in MATLAB software [32]. The radiomic features considered in this work are mentioned in Figure 5. Each feature was calculated by taking the average of all CT slices that contain extracted nodules of a particular patient.
2.4.1 Temporal stability
The temporal stability of the radiomic features is calculated and validated by using Intra-Class Correlation Coefficient (ICC) [33, 34] between the features obtained from segmented nodules using random walk-ensemble segmentation technique and the ground truth segmented nodules provided by the LungCT-Diagnosis dataset [27]. The ground-truth segmented nodules were obtained from a region-growing algorithm where radiologists chose the seed points. ICC is estimated by considering a 95% confidence interval, which defines low stability features when the value is less than 0.5, defines good stability features when the value is between 0.5 and 0.75, and indicates good stability when the value greater than 0.75 depicts high stability features [35, 36].
2.4.2 Prognostic power estimation of features
The prognostic power of radiomic features was estimated based on the significance of patient survival analysis. The survival analysis was obtained from the Kaplan-Meier plot with a log-rank test [37]. Here we have investigated the prognostic power of each feature by considering the p-value between the patient groups, which were separated employing Median Absolute Deviation (MAD) [38], which can give by the formula, i.e.
$M A D_j=\sum_{i=1}^n x_{i, j}-\overline{x_j}$
where, ‘i’ represents the number of patients (n) and ‘j’ represents a radiomic feature and $\bar{x}$ represents the median value of a feature.
The features which produce significant survival probability p-value, i.e., p<0.05 between two groups, were considered to have good predictive prognostic power. The Kaplan-Meier plot can be obtained by using KMWin software [39].
Figure 5. Types of radiomic features [36]
The Table 1 illustrates the ICC values of the features with their respective stability status, such as high, good, and low. Here the ICC was computed among the radiomic features extracted from the nodule-segmented region obtained from the random-walk ensemble segmentation technique and the ground truth nodules segmented under the radiologists’ supervision.
We have noticed that sixteen radiomic features exhibit good to high temporal stability contrast (contr_glcm), convexity (conv_glcm), energy (ener_glcm), entropy (entro_glcm), information measure of correlation2 (imc2_glcm), maximum probability (max_prob_glcm), autocorrelation that is associated with GLCM-based features exhibited high temporal stability with ICC values, and difference entropy (denth_glcm), inverse difference moment normalized (idmn_glcm) illustrated in Figure 6. The remaining features of GLCM-based features comes under the category of low temporal stability.
When it comes to the GLRLM-based features: gray level non-uniformity (gln_glrlm), long gray level run emphasis (lgre_glrlm), high gray level run emphasis (hgre_glrlm) show high temporal stability, and all remaining other features show low temporal stability. Two histogram-based radiomic features indicated high temporal stability, such as entropy (entro_hist) and energy (ener_hist). The skewness (skew_hist) and kurtosis (kurt_hist) were reported as good temporal stability features. The ICC values of each feature are represented in the Table 1. we have identified 12 features with high temporal stability and 3 with good temporal stability. Later, the prognostic performance of these 16 features was assessed by survival analysis using a Kaplan-Meier plot based on survival time.
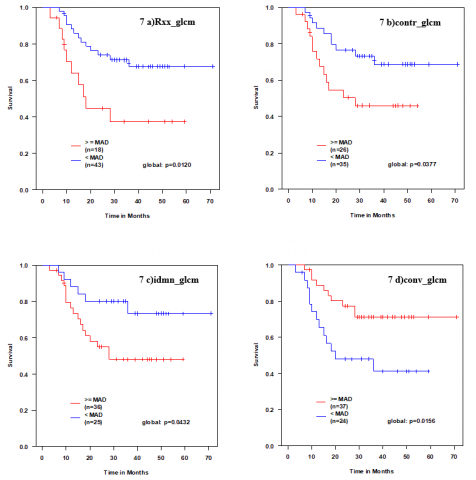
Figures 7-10 represent Kaplan-Meier plots of 16 temporally stable features and weak and robust prognosis performance. The survival probability is considered with respect to time in months to plot the Kaplan-Meier curve, and the two curves were obtained by classifying the features into two groups or classes depending on the median absolute deviation (MAD). We have obtained survival analysis from the Kaplan-Meier plot using the KMWin v1.53 version [38], an open-access software.
Figure 7 a)-d) illustrates the four GLCM-based features with strong prognostic power using Kaplan-Meier plots. Figure 7 a)-d) represents autocorrelation (Rxx_glcm) with p-value 0.0120, contrast (contr_glcm) with p-value 0.0377, inverse difference moment normalized (idmn_glcm) with p-value 0.0432, and convexity (conv_glcm) with p-value 0.0156.
Figure 8 a)-e) illustrates the Kaplan-Meier plots of the GLCM-based features, which exhibited weak prognostic power: energy (ener_glcm), entropy (entro_glcm), and maximum probability (max_prob_glcm) reported similar p-value 0.2433, whereas information measure of correlation2 (imc2_glcm) reported 0.6410 p-values. Figure 8e) shows the Kaplan-Meier plot of difference entropy (denth_glcm) with a p-value of 0.8527, demonstrating a weak prognosis.
Table 1. The ICC values and stability status of radiomic features
|
Radiomic Features |
ICC |
Temporal Stability |
||
|
High |
Good |
Low |
||
|
GLCM-based Features |
||||
|
contr_glcm |
0.786 |
|
|
|
|
conv_glcm |
0.986 |
|||
|
corr_glcm |
0.456 |
|
|
|
|
denth_glcm |
0.532 |
|||
|
dissi_glcm |
0.32 |
|
|
|
|
ener_glcm |
0.95 |
|||
|
entro_glcm |
0.926 |
|
|
|
|
homog_glcm |
0.353 |
|||
|
Idmn_glcm |
0.669 |
|
|
|
|
imc1_glcm |
0.397 |
|||
|
imc2_glcm |
0.906 |
|
|
|
|
max_prob_glcm |
0.951 |
|||
|
Rxx_glcm |
0.775 |
|
|
|
|
GLRLM-based Features |
||||
|
gln_glrlm |
0.832 |
|
|
|
|
hgre_glrlm |
0.832 |
|||
|
lgre_glrlm |
0.943 |
|
|
|
|
lre_glrlm |
0.321 |
|||
|
rln_glrlm |
0.04 |
|
|
|
|
rp_glrlm |
0.027 |
|||
|
sre_glrlm |
0.193 |
|
|
|
|
Histogram-based Features |
||||
|
ener_hist |
0.864 |
|
|
|
|
entro_hist |
0.905 |
|||
|
kurr_hist |
0.549 |
|
||
|
skew_hist |
0.519 |
|||
Figure 6. Intra-class correlation coefficient values of radiomic features
Figure 7 a)-d). Kaplan-Meier survival plots of GLCM based features (Rxx_glcm: autocorrelation, contr_glcm: contrast, idmn_glcm: inverse difference moment normalized, conv_glcm: convexity) representing strong prognostic power (p <0.05; log-rank test)
Figure 8 a)-d). Kaplan-Meier survival plots of GLCM-based features (energy: ener_glcm, entropy: entro_glcm, information measure of correlation2: imc2_glcm, max_prob_glcm) which exhibits weak prognostic power (p>0.05)
Figure 8 e) & Figure 9 a). Kaplan-Meier survival plots of difference in entropy: denth_glcm, which belongs to the GLCM-based feature and Low gray level run emphasis: lgre_glrlm belongs to GLRLM-based feature representing strong prognostic power (p <0.05) respectively
Figure 9b) & 9c). Kaplan-Meier survival plots of GLRLM-based features (gray-level non-uniformity: gln_glrlm, high gray-level run emphasis: (hgre_glrlm))) with weak prognostic power (p >0.05)
Figure 9 a)-c) represents Kaplan-Meier curves of temporally stable GLRLM-based features with a prognostic solid performance with a p-value of 0.0182, such as Low gray level run emphasis: (lgre_glrlm) and Figure 8 a) & b) depicts the weak prognostic performance of GLRLM based features: gray level non-uniformity: (gln_glrlm), high gray level run emphasis (hgre_glrlm) with exact p-value 0.7180 using Kaplan-Meier plot.
Figure 10a) & b) represents Kaplan-Meier plot of histogram-based radiomic features: energy (ener_hist) and entropy (entro_hist). These two features exhibit strong prognostic power with (p-value< 0.05) p-value 0.004545 and 0.03448, respectively, whereas we have observed that Kaplan-Meier plot of histogram-based radiomic features skewness (skew_hist) and kurtosis (kurt_hist) have weak prognostic power with p-value >0.05 shown in the Figure 10 c) & d). The prognostic power of these temporally stable radiomic features is summarized in the Table 2. The Table 2 represents the prognostic status of radiomic features, such as strong or weak with p-values.
Figure 10a) & b). Kaplan-Meier survival plots of two histogram-based features (Energy: Ener_hist, Entropy: Entro_hist) indicating strong prognostic performance (p<0.05)
The main aim of this study is to assess the prognostic power of temporally stable radiomic features associated with patient survival. The traditional radiology practice involves visualization and qualitative analysis of the size and volume of lung nodules. Even though the tumors have histopathological similarities among the patients, it is challenging to suggest precision medicine with this traditional radiology practice. It is necessary to extract meaningful hidden objective data to achieve precision medicine for better treatment [40]. Radiomics features are the best way to meet the above criteria by characterizing the intra-tumor heterogeneity. The Sintra-tumor heterogeneity depicts the spatial relationship and inhomogeneous distribution among the pixels of a specified area which aids in the therapeutic response of lung cancer patients [41]. Thus, it is required to estimate the potentiality of features associated with the prognostic prediction of lung cancer.
Recently, most researchers have developed significant amounts of quantitative features from CT images [42, 43]. Most of these studies involve feature selection, and a question arises about whether features have any observed association with lung cancer survival.
Assessing the association of these features with lung cancer survival is still a significant challenge. We classify our work into four parts 1) nodule segmentation, 2) radiomic feature extraction, 3) estimating the temporal stability, and 4) assessing the prognostic power using survival analysis. In our study, first, we concentrated on the primary step, accurate segmentation, which was one of the critical problems addressed by the study [44]. However, the basic semi-automatic segmentation techniques may lead to inaccurate segmentation due to inter-observer variability and include the surrounding region of the lung parenchyma; mainly, it has been observed in the case of juxta-pleural nodules. Then there might be the chance to extract incorrect radiomic features, leading to the wrong survival analysis. Here, we have proposed a new novel segmentation method named random-walk ensemble segmentation which we have observed an accurate segmentation of all lung nodules, including juxta-pleural nodules. Here, we have proposed a new novel segmentation method named random-walk ensemble segmentation which we have observed an accurate segmentation of all lung nodules, including juxta-pleural nodules.
We have implemented this method on the Lung CT- diagnosis dataset of 61 patients and 284 segmented lung nodules. Then, in the second step, we extracted thirty-eight radiomic features, such as 19 features from the gray-level covariance matrix, 7 features from the gray-level run length matrix, and 12 features from the histogram. However, we have considered 13 GLCM-based and 7 GLRLM-based features, mainly highlighting the tumour region's homogeneity and heterogeneity. In contrast, the four histogram features highlight texture and volumetric measurements. Most of the researchers identified that some of these features have high repeatability and reproducibility [36, 45], and the other reason is to select only these features mentioned in the Table 1 to avoid data sparsity.
Table 2. Summary of prognostic status of temporally stable radiomic features
|
Temporally Stable Radiomic Features |
P-Value |
Prognostic Status |
|
|
GLCM-based Features |
|
Strong |
Weak |
|
Contrast: contr_glcm |
0.0377 |
√ |
|
|
Convolution: conv_glcm |
0.0156 |
√ |
|
|
difference Entropy: denth_glcm |
0.8527 |
|
√ |
|
Energy: ener_glcm |
0.2433 |
|
√ |
|
Entropy: entro_glcm |
0.2433 |
|
√ |
|
Information Measurement of Correlation2: imc2_glcm |
0.6140 |
|
√ |
|
Maximum probability: max_prob_glcm |
0.2433 |
|
√ |
|
Autocorrelation |
0.0120 |
√ |
|
|
GLRLM-based Features |
|
|
|
|
Gray level non-uniformity: gln_glrlm |
0.7180 |
|
√ |
|
High gray level emphasis: hgre_glrlm |
0.7180 |
|
√ |
|
Low gray level emphasis: lgre_glrlm |
0.0182 |
√ |
|
|
Histogram-based Features |
|
|
|
|
Energy: ener_hist |
0.0455 |
√ |
|
|
Entropy: entro_hist |
0.0355 |
√ |
|
|
Kurtosis: kurr_hist |
0.8812 |
|
√ |
|
Skewness: skew_hist |
0.9009 |
|
$\bf \sqrt { }$ |
In the next step, the stability of these features was explored based on the internal correlation coefficient (ICC). Here we have calculated temporal stability between segmented nodules obtained from the proposed method, and the ground truth segmented nodule annotations under the supervision of radiologists available in the Lung CT-Diagnosis dataset [35]. Temporal stability is categorized into high, good, and low (Table 1). We have identified 16 radiomic features with high and good temporally stable features. We have reported topmost radiomic features with high temporal stability based on ICC value are convexity (conv_glcm:0.986), maximum probability (max_prob_glcm:0.951), low gray-level run emphasis (lgre_glcm:0.943), entropy (entro_glcm:0.926), and information measure of correaltion2 (imc2:0.906).
Finally, we have assessed the prognostic performance of these 16 radiomic features, which were temporally stable with the help of survival analysis using the Kaplan-Meier curves with log-rank test illustrated in Figures 7-10. Out of 16 temporally stable features, seven radiomic features such as energy (ener_hist), entropy (entro_hist), convexity (conv_glcm), contrast (contr_glcm), information measure of correlation 2 (imoc2_glcm), autocorrelation (Rxx_glcm), low grey-level run emphasis (lgre_glrlm) represents strong prognostic power with p-value<0.05.
Our study also emphasizes the importance of the convexity score, which exhibits a high temporally stable and robust prognostic significance associated with survival. High convexity scores were reported for the regular shape of the nodules, which can be treated as a good survival, and low convexity scores were reported for irregular shapes, which can be treated as worse survival [12].
Even though most researchers have estimated the prognostic power of temporally stable radiomic features on different types of images, such as electronic portal imaging device images [36], cone-beam CT images [46], and lung CT images. We have identified some drawbacks from the previous studies: 1) the limited number of cases considered for their studies [36], 2) the extraction of more radiomic features, which may cause the data sparsity problem [47], 3) the images were generally acquired from different imaging principles or from different acquisition devices where the features extracted from these images might exhibit distinct feature values, and finally 4) No validation of nodule segmentation results concerning segmentation annotations represented by nodules. Prognostic power with the increased number of cases in the dataset validated our work with ground-truth values.
We have addressed the above problems by proposing a new approach to select the stable features that reduce data sparsity and estimate their prognostic power with increased cases in the dataset, and validated our work with ground-truth values.
The significant contributions of our work are as follows: 1) our proposed hybrid RW-ensemble nodule segmentation method works efficiently for juxta-pleural nodules, 2) We have chosen an appropriate Lung CT-Diagnosis dataset provides annotations defined by radiologists that aid for validation, 3) The extracted radiomic features reported with consistent values as the dataset considered is device independent which mean that these feature values were independent with reference to the acquisition process, 4) Finally, we estimated the prognostic potentiality of temporally stable radiomic features using survival analysis.
Even though we have selected an appropriate dataset for our study, we have limited our work to the lung adenocarcinoma cases. We have extracted only radiomic features instead of radiomic with genomic features.
4.1 Future scope
The dataset may practically contain images acquired from different devices with different modalities. In such cases, the radiomic feature values are represented in different scale values, which may produce incorrect results and affect treatment planning. It is necessary to normalize the values of the radiomic features by proper scaling processes in the future. In future work, the radiomic features can be combined with genomic features to improve individualized therapy planning. As there is an advancement in machine learning and deep learning techniques, one can use these techniques to extract radiomic features to address larger datasets.
The main aim of our work is to investigate the prognostic power of temporal stability of radiomic features in lung CT images. We have proposed a novel random-walk (RW) ensemble segmentation technique to segment all nodules, including juxta-pleural ones. We have processed 284 CT images of 61 patients diagnosed with lung adenocarcinoma cases and extracted 38 radiomic features, of which 16 features reported good to high temporal stability using the internal correlation coefficient (ICC). Out of these, 16 temporally stable radiomic features, seven features such as 4 gray level co-occurrence (GLCM)- based features and one gray level run length matrix (GLRLM)- based features, and 2 histogram-based features exhibited strong prognosis performance in association with the survival analysis of patients using Kaplan-Meier curves.
The potential application of estimating the prognostic potentiality of radiomic features is to improve the effectiveness of medical imaging, which can interpret the behavior changes of the lung nodule. It aids radiologists in better treatment planning, aiming toward optimal therapy. Finally, we reported that convexity has a powerful prognostic power with an excellent significant association with survival analysis.
Our work can also be extended to the other types of lung cancer as we have concentrated only on lung adenocarcinoma in the future. In future work, one can validate their results on larger datasets using different learning techniques to investigate the prognostic power of radiomic features in combination with other clinical or genomic markers.
|
CT |
Computer Tomography |
|
GLCM |
Gray level co-occurrence matrix |
|
GLRLM |
Gray level run-length matrix |
|
ICC |
Intra-class correlation coefficient |
|
ITK |
Imaging tool kit |
|
MAD |
Median Average Deviation |
|
NSCLC |
Non-small cell lung cancer |
|
TCIA |
The cancer imaging archive |
|
MRI |
Magnetic resonance imaging |
|
PET |
Positron emission tomography |
[1] CANCER TODAY. https://gco.iarc.fr/today/home, accessed on 10 July 2023.
[2] Siegel, R.L., Miller, K.D., Fuchs, H.E., Jemal, A. (2022). Cancer statistics, 2022. CA: A Cancer Journal for Clinicians, 72(1): 7-33. https://doi.org/10.3322/caac.21708
[3] Araujo, L.H., Horn, L., Merritt, R.E., Shilo, K., Xu-Welliver, M., Carbone, D.P. (2020). Cancer of the lung: non–small cell lung cancer and small cell lung cancer. Abeloff's Clinical Oncology (Sixth Edition), Elsevier Inc. https://doi.org/10.1016/B978-0-323-47674-4.00069-4
[4] Noguchi, M., Morikawa, A., Kawasaki, M., Matsuno, Y., Yamada, T., Hirohashi, S., Kondo, H., Shimosato, Y. (1995). Small adenocarcinoma of the lung. Histologic characteristics and prognosis. Cancer, 75(12): 2844-2852. https://doi.org/10.1002/1097-0142(19950615)75:12<2844::AID-CNCR2820751209>3.0.CO;2-%23
[5] Bremnes, R. M., Sundstrom, S., Aasebø, U., Kaasa, S., Hatlevoll, R., Aamdal, S., Norwegian Lung Cancer Study Group. (2003). The value of prognostic factors in small cell lung cancer: Results from a randomised multicenter study with minimum 5 year follow-up. Lung Cancer, 39(3): 303-313. https://doi.org/10.1016/S0169-5002(02)00508-1
[6] Ganeshan, B., Panayiotou, E., Burnand, K., Dizdarevic, S., Miles, K. (2012). Tumour heterogeneity in non-small cell lung carcinoma assessed by CT texture analysis: A potential marker of survival. European Radiology, 22: 796-802. https://doi.org/10.1007/s00330-011-2319-8
[7] Jaffe, C.C. (2012). Imaging and genomics: Is there a synergy? Radiology, 264(2): 329-331. https://doi.org/10.1148/radiol.12120871
[8] Gatenby, R.A., Grove, O., Gillies, R.J. (2013). Quantitative imaging in cancer evolution and ecology. Radiology, 269(1): 8-14. https://doi.org/10.1148/radiol.13122697
[9] Chaddad, A., Desrosiers, C., Toews, M., Abdulkarim, B. (2017). Predicting survival time of lung cancer patients using radiomic analysis. Oncotarget, 8(61): 104393. https://doi.org/10.18632/oncotarget.22251
[10] Adiraju, R.V., Elias, S. (2021). A survey on lung CT datasets and research trends. Research on Biomedical Engineering, 37(2): 403-418. https://doi.org/10.1007/s42600-021-00138-3
[11] Hawkins, S.H., Korecki, J.N., Balagurunathan, Y., Gu, Y., Kumar, V., Basu, S., Hall, L.O., Goldgof, D.B., Gatenby, R.A., Gillies, R.J. (2014). Predicting outcomes of nonsmall cell lung cancer using CT image features. IEEE Access, 2: 1418-1426. https://doi.org/10.1109/ACCESS.2014.2373335
[12] Grove, O., Berglund, A.E., Schabath, M.B., Aerts, H.J., Dekker, A., Wang, H., Velazquez, E.R., Lambin, P., Gu, Y., Balagurunathan, Y., Eikman, E., Gatenby, R.A., Eschrich, S., Gillies, R.J. (2015). Quantitative computed tomographic descriptors associate tumor shape complexity and intratumor heterogeneity with prognosis in lung adenocarcinoma. PloS One, 10(3): e0118261. https://doi.org/10.1371/journal.pone.0118261
[13] Gu, Y., Kumar, V., Hall, L.O., Goldgof, D.B., Li, C.Y., Korn, R., Bendtsen, C., Velazquez, E.R., Dekker, A., Aerts, H., Lambin, P., Li, X., Tian, J., Gatenby, R.A., Gillies, R. J. (2013). Automated delineation of lung tumors from CT images using a single click ensemble segmentation approach. Pattern Recognition, 46(3): 692-702. https://doi.org/10.1016/j.patcog.2012.10.005
[14] Paul, R., Hawkins, S.H., Balagurunathan, Y., Schabath, M., Gillies, R.J., Hall, L.O., Goldgof, D.B. (2016). Deep feature transfer learning in combination with traditional features predicts survival among patients with lung adenocarcinoma. Tomography, 2(4): 388-395. https://doi.org/10.18383/j.tom.2016.00211
[15] Lambin, P., Rios-Velazquez, E., Leijenaar, R., Carvalho, S., Van Stiphout, R.G., Granton, P., Zegers, C.M.L., Gillies, R., Boellard, R., Dekker, A., Aerts, H.J. (2012). Radiomics: Extracting more information from medical images using advanced feature analysis. European Journal of Cancer, 48(4): 441-446. https://doi.org/10.1016/j.ejca.2011.11.036
[16] O'Connor, J.P., Rose, C.J., Waterton, J.C., Carano, R.A., Parker, G.J., Jackson, A. (2015). Imaging intratumor heterogeneity: Role in therapy response, resistance, and clinical outcome. Clinical Cancer Research, 21(2): 249-257. https://doi.org/10.1158/1078-0432.CCR-14-0990
[17] Ge, G., Zhang, J. (2023). Feature selection methods and predictive models in CT lung cancer radiomics. Journal of Applied Clinical Medical Physics, 24(1): e13869. https://doi.org/10.1002/acm2.13869
[18] Lee, S.H., Cho, H.H., Lee, H.Y., Park, H. (2019). Clinical impact of variability on CT radiomics and suggestions for suitable feature selection: A focus on lung cancer. Cancer Imaging, 19(1): 1-12. https://doi.org/10.1186/s40644-019-0239-z
[19] Huang, Q., Lu, L., Dercle, L., Lichtenstein, P., Li, Y., Yin, Q., Zong, M., Schwartz, L., Zhao, B. (2018). Interobserver variability in tumor contouring affects the use of radiomics to predict mutational status. Journal of Medical Imaging, 5(1): 011005-011005. https://doi.org/10.1117/1.JMI.5.1.011005
[20] Ramella, S., Fiore, M., Greco, C., Cordelli, E., Sicilia, R., Merone, M., Cornacchione, P., Ippolito, E., Iannello, G., D’Angelillo, R.M., Soda, P. (2018). A radiomic approach for adaptive radiotherapy in non-small cell lung cancer patients. PloS One, 13(11): e0207455. https://doi.org/10.1371/journal.pone.0207455
[21] Liu, Q., Huang, Y., Chen, H., Liu, Y., Liang, R., Zeng, Q. (2020). The development and validation of a radiomic nomogram for the preoperative prediction of lung adenocarcinoma. BMC Cancer, 20(1): 1-10. https://doi.org/10.1186/s12885-020-07017-7
[22] Wu, Y.J., Liu, Y.C., Liao, C.Y., Tang, E.K., Wu, F.Z. (2021). A comparative study to evaluate CT-based semantic and radiomic features in preoperative diagnosis of invasive pulmonary adenocarcinomas manifesting as subsolid nodules. Scientific Reports, 11(1): 66. https://doi.org/10.1038/s41598-020-79690-4
[23] Sha, X., Gong, G., Qiu, Q., Duan, J., Li, D., Yin, Y. (2020). Discrimination of mediastinal metastatic lymph nodes in NSCLC based on radiomic features in different phases of CT imaging. BMC Medical Imaging, 20(1): 1-8. https://doi.org/10.1186/s12880-020-0416-3
[24] He, B., Zhao, W., Pi, J.Y., Han, D., Jiang, Y.M., Zhang, Z.G. (2018). A biomarker basing on radiomics for the prediction of overall survival in non–small cell lung cancer patients. Respiratory Research, 19(1): 1-8. https://doi.org/10.1186/s12931-018-0887-8
[25] Botta, F., Raimondi, S., Rinaldi, L., Bellerba, F., Corso, F., Bagnardi, V., Origgi, D., Minelli, R., Pitoni, G., Petrella, F., Spaggiari, L., Morganti, A.G., Del Grande, F., Bellomi, M., Rizzo, S. (2020). Association of a CT-based clinical and radiomics score of non-small cell lung cancer (NSCLC) with lymph node status and overall survival. Cancers, 12(6): 1432. https://doi.org/10.3390/cancers12061432
[26] Zhang, G., Cao, Y., Zhang, J., Ren, J., Zhao, Z., Zhang, X., Li, S., Deng, L., Zhou, J. (2021). Predicting EGFR mutation status in lung adenocarcinoma: development and validation of a computed tomography-based radiomics signature. American Journal of Cancer Research, 11(2): 546.
[27] Clark, K., Vendt, B., Smith, K., Freymann, J., Kirby, J., Koppel, P., Moore, S., Phillips, S., Maffitt, D., Pringle, M., Tarbox, L., Prior, F. (2013). The Cancer Imaging Archive (TCIA): Maintaining and operating a public information repository. Journal of Digital Imaging, 26: 1045-1057. https://doi.org/10.1007/s10278-013-9622-7
[28] Yushkevich, P.A., Gao, Y., Gerig, G. (2016). ITK-SNAP: An interactive tool for semi-automatic segmentation of multi-modality biomedical images. In 2016 38th Annual International Conference of the IEEE Engineering in Medicine and Biology Society (EMBC), Orlando, FL, USA, pp. 3342-3345. https://doi.org/10.1109/EMBC.2016.7591443
[29] Hao, R., Qiang, Y., Yan, X. (2018). Juxta-vascular pulmonary nodule segmentation in PET-CT imaging based on an LBF active contour model with information entropy and joint vector. Computational and Mathematical Methods in Medicine, 2018: 2183847. https://doi.org/10.1155/2018/2183847
[30] Soh, L.K., Tsatsoulis, C. (1999). Texture analysis of SAR sea ice imagery using gray level co-occurrence matrices. IEEE Transactions on Geoscience and Remote Sensing, 37(2): 780-795. https://doi.org/10.1109/36.752194
[31] Tang, X. (1998). Texture information in run-length matrices. IEEE Transactions on Image Processing, 7(11): 1602-1609. https://doi.org/10.1109/83.725367
[32] Vallières, M. (2015). Radiomics: MATLAB programming tools for radiomics analysis. GitHub; 2015. https://github.com/mvallieres/radiomics, accessed on November 28, 2016.
[33] Liljequist, D., Elfving, B., Skavberg Roaldsen, K. (2019). Intraclass correlation–A discussion and demonstration of basic features. PloS One, 14(7): e0219854. https://doi.org/10.1371/journal.pone.0219854
[34] IBM SPSS software. https://www.ibm.com/in-en/analytics/spss-statistics-software.
[35] Koo, T.K., Li, M.Y. (2016). A guideline of selecting and reporting intraclass correlation coefficients for reliability research. Journal of Chiropractic Medicine, 15(2): 155-163. https://doi.org/10.1016/j.jcm.2016.02.012
[36] Soufi, M., Arimura, H., Nakamoto, T., Hirose, T.A., Ohga, S., Umezu, Y., Honda, H., Sasaki, T. (2018). Exploration of temporal stability and prognostic power of radiomic features based on electronic portal imaging device images. Physica Medica, 46: 32-44. https://doi.org/10.1016/j.ejmp.2017.11.037
[37] Kaplan, E.L., Meier, P. (1958). Nonparametric estimation from incomplete observations. Journal of the American Statistical Association, 53(282): 457-481. https://doi.org/10.1080/01621459.1958.10501452
[38] Rousseeuw, P.J., Croux, C. (1993). Alternatives to the median absolute deviation. Journal of the American Statistical Association, 88(424): 1273-1283. https://doi.org/10.1080/01621459.1993.10476408
[39] Gross, A., Ziepert, M., Scholz, M. (2012). KMWin–A convenient tool for graphical presentation of results from Kaplan-Meier survival time analysis. PLoS One, 7(6): e38960. https://doi.org/10.1371/journal.pone.0038960
[40] Koçak, B., Durmaz, E.Ş., Ateş, E., Kılıçkesmez, Ö. (2019). Radiomics with artificial intelligence: A practical guide for beginners. Diagnostic and Interventional Radiology, 25(6): 485-495. https://doi.org/10.5152/dir.2019.19321
[41] Yip, S.S., Kim, J., Coroller, T.P., Parmar, C., Velazquez, E.R., Huynh, E., Mak, R.H., Aerts, H.J. (2017). Associations between somatic mutations and metabolic imaging phenotypes in non–small cell lung cancer. Journal of Nuclear Medicine, 58(4): 569-576. https://doi.org/10.2967/jnumed.116.181826
[42] Aerts, H.J., Velazquez, E.R., Leijenaar, R.T., Parmar, C., Grossmann, P., Carvalho, S., Bussink, J., Monshouwer, R., Haibe-Kains, B., Rietveld, D., Hoebers, F., Rietbergen, M.M., Leemans, C.R., Dekker, A., Quackenbush, J., Gillies, R.J., Lambin, P. (2014). Decoding tumour phenotype by noninvasive imaging using a quantitative radiomics approach. Nature Communications, 5(1): 4006. https://doi.org/10.1038/ncomms5006
[43] Cook, G.J., Yip, C., Siddique, M., Goh, V., Chicklore, S., Roy, A., Marsden, P., Ahmad, S., Landau, D. (2013). Are pretreatment 18F-FDG PET tumor textural features in non–small cell lung cancer associated with response and survival after chemoradiotherapy? Journal of Nuclear Medicine, 54(1): 19-26. https://doi.org/10.2967/jnumed.112.107375
[44] Thawani, R., McLane, M., Beig, N., Ghose, S., Prasanna, P., Velcheti, V., Madabhushi, A. (2018). Radiomics and radiogenomics in lung cancer: A review for the clinician. Lung Cancer, 115: 34-41. https://doi.org/10.1016/j.lungcan.2017.10.015
[45] Zhao, B., James, L.P., Moskowitz, C.S., Guo, P., Ginsberg, M.S., Lefkowitz, R.A., Qin, Y., Riely, G.J., Kris, M.G., Schwartz, L.H. (2009). Evaluating variability in tumor measurements from same-day repeat CT scans of patients with non–small cell lung cancer. Radiology, 252(1): 263-272. https://doi.org/10.1148/radiol.2522081593
[46] Fave, X., Mackin, D., Yang, J., Zhang, J., Fried, D., Balter, P., Followill, D., Gomez, D., Jones, A.K., Stingo, F., Fontenot, J., Court, L. (2015). Can radiomics features be reproducibly measured from CBCT images for patients with non-small cell lung cancer? Medical Physics, 42(12): 6784-6797. https://doi.org/10.1118/1.4934826
[47] Yang, J., Zhang, L., Fave, X.J., Fried, D.V., Stingo, F.C., Ng, C.S., Court, L.E. (2016). Uncertainty analysis of quantitative imaging features extracted from contrast-enhanced CT in lung tumors. Computerized Medical Imaging and Graphics, 48: 1-8. https://doi.org/10.1016/j.compmedimag.2015.12.001