Vithya Ganesan*![]() | Viswanathan Ramasamy
| Viswanathan Ramasamy![]() | Challapalli Manoj
| Challapalli Manoj![]() | Talluru Tejaswi
| Talluru Tejaswi![]()
© 2023 IIETA. This article is published by IIETA and is licensed under the CC BY 4.0 license (http://creativecommons.org/licenses/by/4.0/).
OPEN ACCESS
Emotion, a complex interplay of feelings and thoughts, represents an individual's mental state and is a crucial semantic component in identifying various emotions. Contemporary digital wearable devices, available in diverse forms, are designed to gather emotional data, primarily focusing on monitoring emotions correlated with physical fitness. Digital assets such as voice assistant devices, accessories, smartwatches, and smartphones, typically used by women, are classified as edge devices. These devices form a connected ecosystem, designed to understand women's emotional states in relation to their behavior. In this work, we propose a Contextual Emotional Classifier (CEC) model that leverages AI learning on edge devices to train on these emotional data. The CEC model gathers emotional data from all AI edge devices, correlating and coordinating the information through contextual computation. This model analyzes text and voice data to propose solutions to emotional thoughts. Classification metrics are used to calculate various epochs of emotional audio data from edge assistant devices. The average weighted accuracy for audio is found to be 1080, while the text accuracy stands at 4000. The output of the contextual computation offers real-time emotional control alerts for dynamic mood swings, warnings about upcoming unplanned activities, and task management. These alerts can activate music, videos, or provide mentoring guidance. The system enhances privacy, security, latency, and avoidance of false data through serverless/cloudless data transfer combined with AI learning. This represents a significant advancement in the development of an emotional health ecosystem for women.
Edge AI device, emotional health management for women, women’s digital ecosystem, emotional tracker, Contextual Emotional Classifier, text and audio emotions
Emotions, a reflection of one's mental state, are a fusion of inner feelings and processed thoughts. Women, in comparison to men, often express their emotions more intensely, be those emotions positive or negative.
1.1 Background
In underdeveloped and developing countries, increasing rates of suicidal and depressive thoughts, as well as ill health among women, can be attributed to survival struggles and societal pressures. Women today occupy various roles in different professions and life situations, whether they're unmarried, married with or without children, single parents, elderly, or teenagers. Such women, particularly in underdeveloped and developing countries, require emotional support. Digital wearable devices can offer this much-needed emotional support, ensuring privacy and security for women in their daily lives.
1.2 Motivation
In the digital age, women strive to enhance their individuality and well-being, harmonizing their roles at home, in their occupations, and in managing their health. However, this balancing act can sometimes trigger stress, leading to depression, frustration, and various ailments.
Women require a healthy state of mind to focus on their goals, necessitating digital support through guidance and counseling. Fitness trackers and health apps, supported by cloud technology, are gaining increasing popularity among women. According to the General Data Protection Regulation (GDPR), data should not be pooled collectively, but personalized support should be provided to individuals.
When comparing digital clothing with wearable devices, the latter provides superior emotional guidance. These wearable devices capture emotions via edge devices, and personalized controllers utilize text and voice data from users' digital possessions to enhance their privacy and security.
1.3 Problem statement
Emerging technologies aim to facilitate happy and healthy lives by developing AI-based digital devices. Women's accessories such as watches, cell phones, music systems, clips, and rings are being equipped with digital computation to identify emotions. The proposed Contextual Emotional Ecosystem Controller (CEC) aims to recognize women's emotions and provide solutions through edge AI learning. It identifies emotions from various accessories including mobile devices and voice assistants, utilizing text and voice data.
1.4 Contribution
Digital wearable devices on the market predominantly focus on gathering physical health data, with a select few targeting emotional health. For instance, headbands are used to scan brain activity to alleviate negative emotions, while fitness wristbands measure skin conductivity, body temperature, and heart rate. These devices monitor medical metrics such as stress, breathing, sleep patterns, ovulation cycles, and provide stress reduction recommendations [1].
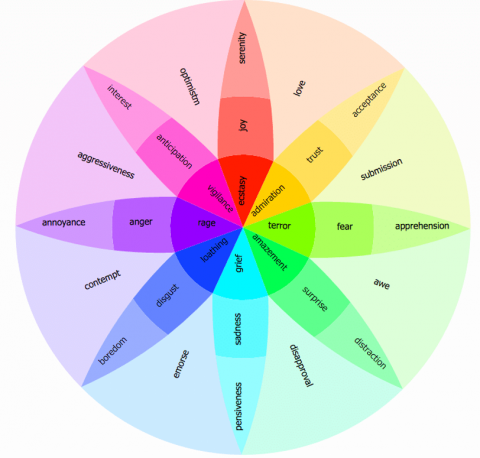
However, there is a need to identify and address a broader range of emotions within a single system to enhance emotional health. According to the wheel of emotions [2], a novel wearable fitness and wellness tracker should be capable of analyzing a variety of emotions, as depicted in Figure 1.
Figure 1. Emotion diversity (Plutchik’s wheel of emotion)
Emotions in the mind manifest through the body and are often influenced by others. Voice-assisted wearable fitness or emotion trackers, for instance, gather this kind of real-time emotional data. An artificial intelligence-based Edge device is employed to implement a digital wearable tracker, providing minimal latency, maximum privacy, increased robustness, and efficient bandwidth [3].
Edge AI falls into two categories: AI for edge and AI on edge devices. AI for edge optimizes resource allocation at the edge, while AI on edge processes the AI model at the edge [4]. AI in each edge device detects emotions and coordinates with other edge devices to mitigate communication overheads [5].
The proposed wearable Edge AI has emerged as a promising solution to identify critical emotional issues in women, such as depression. Depression, a ‘mood’ or ‘emotional disorder’, is often encapsulated as distress [6]. AI is used in digital health and medicine to orchestrate, process, and transform device datasets [7]. AI-enabled devices can diagnose acute chronic diseases [8].
These proposed wearable Edge devices with AI learning enhance women's emotional health by recognizing various emotional expressions through facial cues, voice, and hand posture [9]. While existing Wearable Emotional Controller devices address mental health through AI learning [10, 11], they do not connect all edge devices or ecosystems and fail to generate guidance or hint messages.
The discussion above identifies a gap in emotional devices' ability to recognize emotions from various devices and balance productivity, safety, and security in cloudless environments.
The proposed Wearable Emotional Controller incorporates an AI accelerator or AI learning. Data such as age, occupation, and medical history are processed in an AI accelerator. The AI learning module generates hint messages, suggests movies to watch or listen to, and provides recommendations for medical consultation.
The manuscript is organized as follows: Section 2 explains related work, Section 3 outlines the methodology, and Section 4 discusses emotion classification for speech. Section 5 compares classification metrics for speech and text data, Section 6 delves into AI learning with a contextual emotional classification model, and Section 7 concludes the manuscript.
Three subsections examine the related work on emotion detection and data analysis from various sources. Section 2.1 is about emotion detection by sentiment analysis of text from voice assistant devices, smartwatches, and smartphones. Section 2.2 is on sentiment analysis of speech. Section 2.3, explains contextual emotion detection from text, audio, and image data.
2.1 Text-based emotion detection methods
The emotional health of a person is determined by their emotional state. The heterogeneous data such as texts, images, videos, and audio are required for understanding emotions. Women may use voice assistance devices, mobile apps, accessories, and smartwatches. All these devices are considered edge devices. They are connected to form an ecosystem.
Emotion Recognition Controller (ERC) classifies the emotions in Text. It recognizes angry, happy, sad, or confused joy, happiness, sadness, or disgust by sentiment analysis [12, 13]. The two approaches in sentiment analysis namely Lexicon and Machine learning techniques. Lexicon, for matching the data with a sentiment vocabulary. Machine learning (ML) to classify the type of emotional data [14].
Relevant supervised ML approaches are Multinomial naïve Bayes, Support Vector Machine (SVM), Random Forest and logistic classifier [15]. In Multinomial Naïve Bayes, the classifying emotions by learning and evaluation. In the learning phase, the Naïve Bayes classifier trains a data set, and the performance of the classifier is evaluated in the evaluation phase. Accuracy with error rate, and precision and recall [16-18] are used as performance features.
In SVM, emotional phrases are converted into mathematical values. Emotional keywords are extracted from the text. The frequency of word occurrence determines the opinion orientation [19].
The Random Forest Classifier detects emotions in the texts. It identifies the emotions such as happiness, sadness, anger, and surprise and predicts more accurate data [20]. It collects many decision trees to improve processing. Random sample data from each decision tree is identified as a key feature [21]. The collections of decision trees are compared, for finding a set of strongest classification methods by ensemble [22, 23].
In the logistic classifier, the text is analyzed with the dependent variable. The logistic classifier is a statistical method that calculates the relationship between binary and independent variables. It can be either additional nominal numbers or ordinal numbers or intervals or independent variables [24]. In emotional text analysis, the text is used as input to the logistic regressor and then the emotions are determined [25, 26] as the occurrence of text in the document. Term-Frequency and Inverse-Document Frequency (TFr-IDFr) methods are used for finding the number of occurrences [27].
For example, in document (d), the frequency reflects the occurrences of a particular word in term (t). The more relevant term appears in the text and the irrelevant text is removed in the word models. An item in the deed represents the Term-frequency, while Inverse-Document Frequency evaluates the importance of the text, and it is similar to TFr. The difference TFr in a document (do), frequency counter (ftc), while df is the contingencies of the term (ct) in document set (N). In an Inverse Document, the irrelevant word is determined and forms a word cloud [28].
2.1.1 Text data pre-processing
Lemmatization is used in text processing to process words and convert them into dictionary form. Lemmatization converts a word into its lemma for optimal results. Generating a speech tag for lemmatization by stop words. They are "the", "a", "an", or "in". Ignore these stop words during the key search. Eliminating the stop words by Natural Language Toolkit (NLTK). The count vectorizer generates a matrix where each phrase is denoted by a column and each text interval is denoted by a row. The result in each cell calculates the number of words in each text sample.
2.2 Emotions on speech /audio
Voice emotion detection software analyzes speech signals to detect embedded emotions. The speech signals are analyzed by the Recurrent neural network RNN and LSTM [29]. An audio file is in the form of sequential data to build a suitable framework. It identifies embedded emotions in speech [30]. LSTM captures minimal task-related information [31]. Deep neural networks perform automatic speech recognition with classification methods [32]. Recurrent neural networks (RNNs) process speech input [33]. But, for emotional speech analysis, Long Short-Term Memory (LSTM) is effective by using Deep Hierarchical LSTM and Bi LSTM. It reduces the gradient and long-term learning error [34].
2.3 Emotion detection by AI learning
Contextual emotion detection includes the user's emotions, such as sad, pleased, and furious. It recognizes the emotions in the textual interactions too. Context-sensitive dependencies on speech and text are processed by LSTM to obtain accurate emotions [35]. Establish contextual emotions in occupation, health problems, monetary support, duties, number of family members, hobbies and physical activities based on their Age and education [36].
Listening to textual representations of human conversations and audio data from the voice assistant device [37, 38] can predict the emotional states of the past, present, and future [39, 40]. But it contains information on the user's identity by voice, language, and gender. Speech data identifies a person and access crucial information such as voice-based passwords and codes. It can be used by eavesdroppers.
AI learning (AL) is an effective way to protect privacy with machine learning. By AI learning, privacy violations are protected without revealing the local data. Emotion recognition in voice is identified in the edge device. So, sensitive data is protected by not transferring the data to central servers [41, 42]. At the same time, the information on the local or edge devices is updated in the global mode [43].
For example, the emotional health of a person is determined by their emotions such as joy, happiness, sadness, or disgust used in a sentence. A classifier with contextual information is used to detect reactions by AI learning [44].
AI learning (AL) curtails privacy violations even in the shared learning scenario by providing decentralized training. Multiple participants are involved and learn without revealing their local data [45]. It is performed on client nodes, with improved communication speed between clients. No central server is required to control individual nodes or devices.
AI learning supports data distribution in an independent manner [46]. AL addresses the process of local training data collection and reduces cost [47] and increases security from attackers [48]. AI learning at the edge protects data ownership through efficiency in communication and computation [49].
The proposed AI contextual emotion ecosystem controller (EEC) is developed to protect the privacy and security of solitary women's emotions which are collected from different devices. Edge AI learning is used to improve data security, reduce cost and time in transfer and enhance speed in computation for timely emotional guidance.
An ecosystem connects all edge devices and supports the computational process within edge devices. A Wearable Emotional Controller (WEC) or Wearable Contextual Emotional Ecosystem Controller (CEC) methodology is a decentralized working model, embedded with AI learning to train the data and infer the various emotional data classification. It uses emotional parameters with the swarm of women's health data. Wearable devices such as voice assistants, smartwatches, and smartphones are used for better diagnosing [50]. Immeasurable data is collected either by wearable devices or with voice assistants device for computation [51].
Edge device uses a time-sensitive and energy-efficient method for computation [52]. Edge AI driver/ learning methodology is implemented on these edge devices to improve security and latency. Some of the women's accessory or edge devices have memory, while others do not. Edge AI devices with memory, such as mobile or music devices, have an Edge AI driver to train emotional data.
If no memory in women's edges AI device, such as glasses and rings, does not have memory, it transmits the data/signals to one of the female AI device drivers that have memory. The Edge AI device driver transmits the training results (but not the data) to CEC. The block diagram of the Wearable Contextual Emotional Controller (WEC)/ CEC is shown in Figure 2.
In CEC, women's data such as age, educational qualifications, occupation, health, financial support, duties, number of dependents, hobbies, and physical activities are stored. Moreover, this data of women is taken as a basic threshold, and it is delineated with the results of other Edge AI devices.
3.1 Overview of women's contextual emotional controller by AI learning
In women's emotional controller, the AI accelerator/driver enables AI learning to support serverless/cloudless data transfer. It receives emotional data from any edge AI driver and correlates and coordinates it with contextual emotional data. It suggests a solution corresponding to the emotions by activating music, videos, or mentoring messages. A machine learning algorithm, SVM model, preprocessing, edge detection, and feature extraction are used to identify emotional behaviour [53].
Control messages or mentoring/guidance messages are generated by AI learning for emotional behaviour [54]. Data analysis is required to handle inconsistency, indeterminacy, and uncertainty [55]. Automating information transfer over a network and interacting between the device provides reliability and flexibility [56].
Human Activity Recognition systems are often implemented on portable or wearable computing devices to detect actions. It is done in two phases: the assessment and the validation phase [57]. The assessment phase assesses the level of emotional severity and the validation phase checks the level of emotions which are collected from different accessories. It uses the correlation analysis technique to relate data from edge AI drivers and personal data from CECs. It is shown in Figure 3.
3.2 Implementation
CEC collects voice from a voice assistance device and converts voice into text and identifies emotions by AI learning. It uses its own memory devices or transmits them to other memory devices based on the memory capacity of the devices. The emotion classifier is executed by the following:
1. Hybrid Emotion classifier for text;
2. Emotion classification for speech;
3. AI learning with Contextual emotional classifying model.
3.3 Hybrid emotion classifier for text
Contextual Emotional Classifier (CMC) trains emotional sentences collected by one of the edge devices. Voice assistant Edge device that converts voice into sentinel key phrases. A hybrid model that includes Multinomial Naive Bayes Classifier, Logistic Classification, Random Forest Classifier and SVM is used to analyze the emotion of the text. Performance is measured using a confusion matrix to represent true and false positives, as well as true and false negatives. The classification metrics for emotions are determined by precision and recall.
Figure 2. Block diagram of Wearable Emotional Controller (WEC)
Figure 3. Overview of CEC AI Learning
According to Ekman, there are a total of 7 Universal Emotions which are basic ones. So, we are considering them. Here we are assigning values for each universal emotion as P1, P2, P3, P4, P5, P6, P7. Examples of universal emotions and their qualifiers are listed in Table 1.
Table 1. Universal emotions and its values
|
Universal Emotions |
Value |
|
Enjoyment |
P1 |
|
Sadness |
P2 |
|
Surprise |
P3 |
|
Fear |
P4 |
|
Anger |
P5 |
|
Disgust |
P6 |
|
Contempt |
P7 |
In Table 2, we are considering blended emotions, which we can get by combining more than one universal emotion. Here, for each blended emotion, we have assigned some values. For example, for Joy emotion, we have given value as Q2. Like that, we have assigned every blended emotion as Q1, Q2, Q3 …
Table 2. Blended emotions and their assigned values
|
Blended Emotions |
Value |
|
Ecstasy |
Q1 |
|
Joy |
Q2 |
|
Serenity |
Q3 |
|
Admiration |
Q4 |
|
Trust |
Q5 |
|
Acceptance |
Q6 |
|
Terror |
Q7 |
|
Fear |
Q8 |
|
Apprehension |
Q9 |
|
Amazement |
Q10 |
|
Surprise |
Q11 |
|
Distraction |
Q12 |
|
Grief |
Q13 |
|
Sadness |
Q14 |
|
Pensiveness |
Q15 |
|
Loathing |
Q16 |
|
Disgust |
Q17 |
|
Boredom |
Q18 |
|
Rage |
Q19 |
|
Anger |
Q20 |
|
Annoyance |
Q21 |
|
Vigilance |
Q22 |
|
Anticipation |
Q23 |
|
Interest |
Q24 |
From these assigned value emotions, developed an equation for blended emotions Q1, Q2…Q24. It is derived from universal emotions P1, P2…P7 then P1(Q1, Q2…Q24), named as R1 and vice versa.
=P1(Q1, Q2...Q24) || P2(Q1, Q2...Q24) || P3(Q1, Q2...Q24) || P4(Q1, Q2...Q24) || P5(Q1, Q2...Q24) ||P6(Q1, Q2...Q24) || P7(Q1, Q2...Q24)
=R1 || R2||R3||R4||R5||R6|| R7
Valence and Arousal approaches are very much appropriate for emotion analysis [58, 59].
Now, we are going to classify emotions into 7 parts which are R1, R2…R7. As follows:
R1 - High Arousal, Positive Valence
R2 - Medium Arousal, Positive Valence
R3 - Medium Arousal, Negative Valence
R4 - Low Arousal, Positive Valence
R5 - Low Arousal, Negative Valence
R6 - High Arousal, Negative Valence
R7 - Nonce
Table 3 classifies the given sentence with its universal emotions and blended emotions included with its relative Quadrant.
Table 3. Text analysis with emotions and rating of a voice-assisted device
|
Sentence |
Universal Emotion |
Blended Emotion |
Quadrant |
|
I am in ecstasy |
P1 |
Q1 |
R1 |
|
He screamed in terror as the rats came |
P4 |
Q7 |
R4 |
|
He looked at me in amazement |
P3 |
Q10 |
R3 |
|
I am seriously ill because of my loved one passed away |
P2 |
Q13 |
R2 |
|
Tina likes to combat her boredom by reading a book. |
P6 |
Q18 |
R6 |
|
He was trembling with rage |
P5 |
Q19 |
R5 |
|
I am not interested in you |
P7 |
Q24 |
R7 |
The following hybrid model identifies emotions through the hybrid model that assigns values to emotion key phrases. For example, the values for emotions are 1- empty, 2- sadness, 3- enthusiasm, 4- neutral, 5- worry, 6- surprise, 7- love, 8- fun, 9- hate, 10- happiness, 11- boredom, 12- relief, 13- anger, 14- admiration, 15- terror, 16- amazement and so on, up to 31 types of emotions.
The hybrid model trains the text data from the voice assistant or the data from the smartwatch. The emotions are identified for the text data with their value. Table 4 shows the output of the text analysis with emotions and evaluation values by the predefined mappings.
Table 4. Text analysis with emotions and rating of a voice-assisted device
|
Index |
Context |
Value |
Emotion |
|
0 |
I am happy and the weather is cheerful |
10 |
happiness |
|
1 |
Things looking good today |
10 |
happiness |
|
2 |
Success right around corner Let’s celebrate victory |
10 |
happiness |
|
3 |
Everything beautiful experience smile |
10 |
happiness |
|
4 |
Now worst okay But I goanna get better |
5 |
worry |
|
5 |
I tired boss Tired Road lonely sparrow rain |
5 |
worry |
|
6 |
This quite depressing I filled sorrow |
2 |
sadness |
|
7 |
His death broke heart Its sad day |
2 |
sadness |
Guidelines and suggestions for various emotions with quotes for happiness, worries, and sadness are shown in Table 5. These quotes are generated for happiness, and it randomly selects one as a guideline concerning its context’s emotion identified by the hybrid classifier.
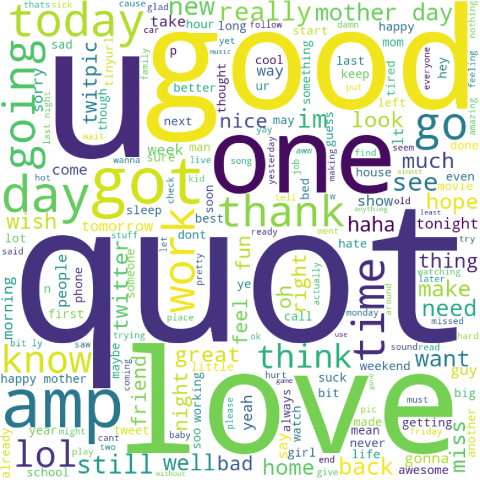
In the same way, there are suggestions and guidelines for other emotions are stored for training the data set. In addition, the word cloud is generated to identify the emotional phrases from various voice assistants, smartwatches, and smartphone devices. It is a cumulative of emotions and phrases that are used for analyzing further.
Figure 4. Key phrases cloud of women's emotions
Figure 5. Confusion matrix for text emotions
Table 5. Guidelines/suggestions for women's emotions
|
Index |
Context |
Value |
Emotion |
Quote |
|
0 |
I am happy and the weather is cheerful |
10 |
happiness |
Happiness in this life is to love and beloved. |
|
1 |
Things looking good today |
10 |
happiness |
Action may not always bring happiness, but there is no happiness without action. |
|
2 |
Success right around corner Let’s celebrate victory |
10 |
happiness |
keep happy, and your joy. you shall form an invincible host against difficulties. |
|
3 |
Everything beautiful experience smile |
10 |
happiness |
Be happy for this moment. This moment is your life. |
|
4 |
Now worst okay But I goanna get better |
5 |
worry |
Whoever is trying to bring you down, is already below you. |
|
5 |
I tired boss Tired Road lonely sparrow rain I tired pain I feel |
5 |
worry |
Don’t carry your mistakes around with you. place them under your feet as stepping stones to rise above them. |
|
6 |
This quite depressing filled sorrow |
2 |
sadness |
Grief is not as heavy as guilt, but it takes more away from you. |
|
7 |
His death broke heart Its sad day |
2 |
sadness |
Nothing can cure the soul but the senses, just as nothing can cure the senses but. |
Table 6. Classification metrics for text emotions
|
S.NO |
Precision |
Recall |
F1-score |
Support |
|
1 |
0.01 |
0.03 |
0.02 |
30 |
|
2 |
0.23 |
0.29 |
0.26 |
411 |
|
3 |
0 |
0 |
0 |
90 |
|
4 |
0.53 |
0.32 |
0.4 |
1444 |
|
5 |
0.35 |
0.29 |
0.32 |
1014 |
|
6 |
0.04 |
0.1 |
0.05 |
78 |
|
7 |
0.37 |
0.41 |
0.39 |
343 |
|
8 |
0.06 |
0.31 |
0.1 |
35 |
|
9 |
0.15 |
0.27 |
0.19 |
74 |
|
10 |
0.3 |
0.31 |
0.31 |
513 |
|
11 |
0 |
0 |
0 |
1 |
|
12 |
0.03 |
0.11 |
0.04 |
37 |
|
13 |
0 |
0 |
0 |
1 |
|
Accuracy |
0 |
0 |
0.3 |
4000 |
|
Macro-average |
0.16 |
0.19 |
0.16 |
4000 |
|
Weighted average |
0.38 |
0.3 |
0.33 |
4000 |
Figure 4 shows the cloud of emotions and the key phrases. Figure 5 shows the confusion matrix for text emotions of assisted devices and Table 6 shows classification metrics for text emoticons.
3.4 Emotion classification for speech
Speech Emotion classification is compared by using three different datasets namely Crowd Sourced Emotional Multimodal Actors Dataset (CREMA-D), Ryerson Audio-Visual Database of Emotional Speech and Song (RAVDESS), Toronto emotional speech set (TESS) and it is listed in Table 7 [60-62]. RAVDESS, CREMA-D and TESS are multimodal databases of emotional speech and song with different expressions. Layer of emotional intensity and neutral expression are in voice- formats.
A voice assistant device that listens to the audio and analyzes the emotions either in its memory or transfers them to other memory devices such as laptops or mobile apps if the device has less memory. Emotions are examined through wave plots and spectral visualization. Performance is measured using a confusion matrix to represent true and false positives, true, and false negatives.
Classification metrics for emotions are determined by precision and recall. Table 8 shows the sample audio wave file and its emotions from the voice-assisted devices.
Table 7. Speech databases used to compare (RAVDASS, CREMA-D, TESS)
|
Database |
Modalities |
Language |
Subjects |
Posed/Spontaneous/Induced |
Remarks |
Size of Data |
|
RAVDASS |
Audio, Video |
English |
24 professional actors (12 female,12 male) |
Posed, Induced |
Available. Intensity expressed in two levels (normal, high) |
7356 recordings |
|
CREMA-D |
Audio |
English |
91 actors (48 males, 43 females) |
Posed, Spontaneous |
Available. Each expression is produced at different levels of intensities (low, medium, high, unspecified) |
7442 recordings |
|
TESS |
Audio |
English |
2 actresses |
Posed, Induced |
Available. Recorded different emotions |
24767 recordings |
Table 8. Sample speech/audio emotion identification and its wave files
|
Index |
Emotion |
Path |
|
0 |
angry |
/input/cremad/AudioWAV/1049_WSI_ANG_XX.wav |
|
1 |
angry |
/input/cremad/AudioWAV/1082_IWW_ANG_XX.wav |
|
2 |
fear |
/input/cremad/AudioWAV/1021_ITS_FEA_XX.wav |
|
3 |
angry |
/input/cremad/AudioWAV/1086_ITS_ANG_XX.wav |
|
4 |
disgust |
/input/cremad/AudioWAV/1026_ITS_DIS_XX.wav |
3.4.1 Wave plot and spectrum visualization for audio data of emotion
A spectrum displays, amplitude and frequency. The audio/sound of the speech file and its emotions are plotted to diagnose various patterns in audio/speech data. The waveform differentiates the various emotions and their frequencies.
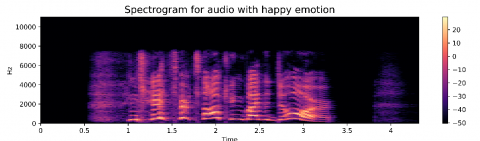
Figure 6 shows the spectrum visualization used to visualize frequencies against time, and it shows the signal strength at a given time (Hz). An image of the sound is called a voiceprint or voicegram. Signal levels are represented by a spectrogram, which is displayed in different colors. A bright color indicates that the energy of the signal is high. The brightness of the color is related to the intensity of the signal in the spectrogram.
Figures 6, 8, 10, and 12 show the spectral representation of happy, sad, angry and fear.
Figure 6. Emotion - Happy by spectrum visualization
Figure 7. Emotion - Happy by wave plot
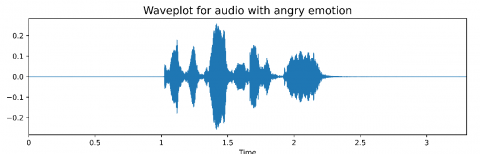
Wave plots show the maximum audio frequency at any moment with parameters such as frequency, amplitude, and speed of sound. Figure 7 shows the wave plot for happy emotions with parameters used to draw the wave plot for happy emotions y, sr, max_points, x_axis, ax, off_set, max_sr, and kwargs. Where y=np.ndarray [shape=(n,) or (2,n)], Sr - Sampling rate of y.max_points take positive number or none. It indicates the maximum number of time points to plot. If max_points exceed the duration of y, then it is called down sampled. The x-axis accepts the str or none and ax for matplotlib. axes. Axes or None. Kwargs to use matplotlib. pyplot.fill_between.
Figures 7, 9, 11, and 13 show the waveform of happy, sad, angry and fear. The sad waveform was generated using the librosa package preprocessed library file to reduce noise and pitch.
Figure 8. Emotion - Angry by spectrum visualization
Figure 9. Emotion - Angry by wave plot
Figure 10. Emotion - Fear by spectrum visualization
Figure 11. Emotion - Fear by wave plot
Sad emotions are determined by their frequency range relative to time.
Figure 12. Emotion - Sad by spectrum visualization
Figure 13. Emotion - Sad by wave plot
Figure 14 shows the confusion matrix for audio data from voice-assisted devices and Table 9 shows the classification metrics for speech.
Table 9. Classification metrics for speech
|
Emotion |
Precision |
Recall |
F1-score |
Support |
|
Angry |
0.71 |
0.58 |
0.64 |
132 |
|
Calm |
0.73 |
0.75 |
0.74 |
159 |
|
Disgust |
0.62 |
0.56 |
0.59 |
135 |
|
Fear |
0.7 |
0.66 |
0.68 |
151 |
|
Happy |
0.52 |
0.6 |
0.56 |
141 |
|
Neutral |
0.64 |
0.22 |
0.73 |
72 |
|
Sad |
0.48 |
0.75 |
0.59 |
151 |
|
Surprise |
0.79 |
0.71 |
0.75 |
139 |
|
Accuracy |
0 |
0 |
0.63 |
1080 |
|
Macro-Average |
0.65 |
0.6 |
0.61 |
1080 |
|
Weighted-Average |
0.65 |
0.63 |
0.63 |
1080 |
Figure 14. Confusion matrix for predicted
3.4.2 LSTM Model comparison with various epochs for audio data of emotions from assistance devices
LSTM Recurrent Neural Networks using Keras is a predictive model. Sequence of inputs is received in space or time. In this LSTM model, a dropout layer acts as a hidden layer and additional dropout layers are inserted between the embedding and LSTM layers to improve accuracy and reduce error. The LSTM and Dense output layers used dense, flatten and max_pooling for accuracy analysis.
The conventional model with layers conv1d, conv2d, conv3d, max_pooling 1,2,3, flatten and dense acts as a hidden layer with the standard output layer shown in Table 10.
In the LSTM training model, each layer's conv1d l generates a kernel model that is combined with the layer's inputs over a given temporal coordinate to produce a set of results. When the bias is positive, a bias vector is added to the results. When using this layer as the first layer in a model, a parameter for the input shape for a set of 20 vectors of vector space matrices or (None, 256) for a particular behavior of compact representation vectors.
Table 10. The LSTM training model for the Contextual Emotional Classifier
|
Layer (Type) |
Output Shape |
Param # |
|
Convid |
(None,162,256) |
1536 |
|
max_poolingid (MaxPooling1D) |
(None,81,256) |
0 |
|
convid_1 |
(None,81,256) |
327936 |
|
max_poolingid_1 (MaxPooling1D) |
(None,41,256) |
0 |
|
convid_2 |
(None,41,6) |
163968 |
|
max_poolingid_2 (MaxPooling 1D) |
(None,21,128) |
0 |
|
dropout (Dropout) |
(None,21,128) |
0 |
|
convid_3 (Conv1D) |
(None,21,64) |
41024 |
|
max_pooling_3 (MaxPooling1D) |
(None,11,64) |
0 |
|
Flatten |
(None,704) |
0 |
|
Dense |
(None,32) |
22560 |
|
Dropout_1 |
(None,32) |
0 |
|
Dense_1 |
(None,8) |
264 |
Max pooling is a pooling technique that computes the optimal output for the spots of a characteristic map and applies it to produce a pixel-wise (pooled) convolutional layer. The model is trained by LSTM with speech input data and gets model metrics with accuracy and training loss for actual and predicted emotions.
In the same way as Conv1d, the Conv2d layer generates a convolutional kernel model that is overlaid with the input of the Conv1d layer to produce a tensor with emotionally diagnosed outputs. When the bias parameter is set to True, a bias vector is generated and appended to the outputs to pass to the next layer. If the activation parameter is set to None, it is appended to the output data.
3.4.3 Prediction of emotion assistance devices
Table 11. Actual and predicted emotions and its test cases
|
Index |
Predicted Labels |
Actual Labels |
|
0 |
Fear |
Fear |
|
1 |
Angry |
Angry |
|
2 |
Fear |
Fear |
|
3 |
Calm |
Clam |
|
4 |
Angry |
Angry |
|
5 |
Surprise |
Surprise |
|
6 |
Sad |
Fear |
|
7 |
Fear |
Happy |
|
8 |
Fear |
Fear |
|
9 |
Sad |
Sad |
The model was tested to analyze performance by its accuracy and loss. Accuracy and loss are measured between the actual and predicted values. Actual and predicted emotions of the test cases are listed in Table 11.
3.4.4 Roc curves for LSTM model
The ROC curve shows the relationship between true and false positives. A random classifier is assumed as the standard FPR = TPR. Normally, ROC is not affected by the target class.
The ROC curve is with a true positive (TPR) and a false positive rate (FPR). The true positive rate of emotional (Em-TP) diagnosing is calculated by (Em-TP/ (Em-TP + Em- FN)) where Em-FP is emotion on false +. Similarly, the false-positive rate is calculated as (Em-FP/ (Em-TN + Em-FP)) where Em-TN is true-negative on emotion digitization.
For example, the true positive rate is the proportion of persons who are accurately recognized as testing positive for the condition in queries. An epoch in a machine learning algorithm to train the data set.
Typically, data sets are organized into batches and blocks. If the block size is equal to the entire training sample, then the number of iterations equals the number of looping. A general relationship between epochs is d*e = i*b if the input data size is d, the iteration number is e, the batch size is i and the batch size is b.
A detailed overview of the data shows the accuracy of the ROC curve with 50 epochs shown in Figure 15, the accuracy of the ROC curve with 75 epochs shown in Figure 16 and the accuracy of the ROC curve with 100 epochs shown in Figure 17.
Figure 15. Accuracy by ROC curve with 50%
Figure 16. Accuracy by ROC curve with 75%
Figure 17. Accuracy by ROC curve with 100%
Table 12. Metrics comparison between text and speech with precision, recall, f1-score, and support parameters
|
Speech |
Text |
Speech |
Text |
Speech |
Text |
Speech |
Text |
Speech |
Text |
|
Metrics |
Metrics |
Precision |
Precision |
Recall |
Recall |
F1score |
F1-score |
Support |
Support |
|
Angry |
Angry |
0.71 |
0.01 |
0.58 |
0.03 |
0.64 |
0.02 |
232 |
60 |
|
Calm |
Calm |
0.73 |
0.23 |
0.75 |
0.29 |
0.74 |
0.26 |
359 |
511 |
|
Disgust |
Disgust |
0.62 |
0 |
0.56 |
0 |
0.59 |
0 |
335 |
130 |
|
Fear |
Fear |
0.7 |
0.53 |
0.66 |
0.32 |
0.68 |
0.4 |
351 |
4444 |
|
Happy |
Happy |
0.52 |
0.35 |
0.6 |
0.29 |
0.56 |
0.32 |
441 |
4014 |
|
Neutral |
Neutral |
0.64 |
0.04 |
0.22 |
0.1 |
0.73 |
0.05 |
472 |
678 |
|
Sad |
Sad |
0.48 |
0.37 |
0.75 |
0.41 |
0.59 |
0.39 |
751 |
743 |
|
Surprise |
Surprise |
0.79 |
0.06 |
0.71 |
0.31 |
0.75 |
0.1 |
339 |
735 |
|
Accuracy |
Accuracy |
0 |
0 |
0 |
0 |
0.63 |
0.3 |
4080 |
6000 |
|
Macro-Average |
Macro-average |
0.65 |
0.16 |
0.6 |
0.19 |
0.61 |
0.16 |
4080 |
6000 |
|
Weighted-Average |
Weighted- average |
0.65 |
0.38 |
0.63 |
0.3 |
0.63 |
0.33 |
4080 |
6000 |
3.5 AI learning with contextual emotional classifying model
Emotions are collected from various assistance devices such as smartwatches, smartphones and other edge devices to identify low mood, loss of interest or pleasure and decreased energy, reduced self-esteem and self-confidence in usual activities and is associated with a paralyzed social status [63]. When the devices have memory, training and learning take place in the device to avoid delays in conversion while improving the security of the women's data.
The quality metrics used were delay, jitter, throughput and packet loss [64]. A serverless or cloudless system is used to support the learning process [65]. AI learning uses the ecosystem when devices do not have storage. Some of the accessory devices for women may have memory and others may not [66].
In WEC, women's data such as age, educational qualifications, occupation, health, monitory supports, duties, number of dependents, hobby and physical activities are taken as a basic threshold and matched with the results of other Edge AI devices for women. Emotional messages for behavior control or mentor/guide messages are generated based on the analysis of AI learning data.
In an ecosystem, the device that captures the emotions such as text or voice is transferred to the system and acts as a server. The device which transfers the data to the server is called the client. On the ecosystem server, the emotions collected from other devices and personal information on assistance devices are used to determine the level of emotions. AI learning trains the supervised classifiers and transforms the women's time-based emotions.
The data is transformed into a vector to train unseen values. Vector representations of emotional data use emotional frequency and vectors weighted by inverse document frequency (EF-IDF) to train unlabeled values for suggestions. Emotional frequency, personal data, and time are the parameters for giving suggestions and guidance and are calculated using the following formula.
$\operatorname{CEC}(s)=e f-i d f(t, d)=t f(t, d) * \log \log \left(\frac{N}{d f+1}\right)$
where, tf (t,d)=Number of t in d / number of words in d, the number of times an emotion is in terms of frequency. ef is the frequency counter for emotion at time (t) in deed d, whereas df is the occurrences of t in the deed set N. In AI learning, emotional data is per-processed by ef-idf to remove unwanted or connecting words. After the pre-processing, it is used to count the number of emotional occurrences and it is shown in Table 12.
A sunburst chart is used to visualize hierarchical data. The sunburst diagram represents layered data from roots to leaves. The root starts in the middle, and a squirt is added to the outside rings. The sunburst plot depicts stratified data from the roots to the leaves. The root starts at the center, and a squirt is added to the outside rings. So, we use the sunburst chart, which is better suited for hierarchical data. From time to time, 3 days of emotional data are collected from different AI devices, which are then analyzed by the CEC model for guidance and suggestions.
Figure 18 shows the time-based emotions of women from Edge AI devices. Here, women's mood is recorded over three days with a specific time from 9:00 AM to 8:00 PM. The input for this visualization is collected from smart devices and audio files from women. Then these audio files are converted into text files. This text data was subjected to three days of emotional analysis and displayed in a sunburst chart. Each hour is represented by unique colors so that it can be easily distinguished.
Table 13 shows the comparison of model metrics between text and speech with precision, recall, f1 score, and other support parameters.
Table 13. Multi-class classifier for guidelines and suggestion
|
Time |
Day-1 |
Day-2 |
Health |
Suggestion |
|
9:00 AM |
sadness |
worry |
Blood Pressure |
call helpline |
|
10:00 AM |
sadness |
sadness |
Diabetic |
call helpline |
|
11:00 AM |
neutral |
worry |
N/A |
meditation |
|
12:00 AM |
sadness |
hate |
Blood Pressure |
call helpline |
|
1:00 PM |
neutral |
neutral |
N/A |
food order |
|
2:00 PM |
sadness |
neutral |
Diabetic |
meditation |
|
3:00 PM |
Fun |
neutral |
N/A |
playlist |
|
4:00 PM |
neutral |
neutral |
Diabetic |
movie |
|
5:00 PM |
worry |
neutral |
Migraine |
meditation |
|
6:00 PM |
sadness |
neutral |
N/A |
meditation |
|
7:00 PM |
worry |
worry |
Blood Pressure |
call helpline |
|
8:00 PM |
Sadness |
empty |
Migraine |
call helpline |
Figure 18. Time-based emotions of women from Edge AI devices
The current study focuses on women's emotions and their behaviour through Text and audio-based emotion detection methods. The decentralized CEC model uses cognitive computing and Edge AI learning to analyze the data generated from an ecosystem. Text and audio data are used to understand the severity of emotions. For instance, three emotion detection methods such as Text-based, Audio Based and Contextual Emotional Classifying methods calculate the accuracy of emotion level. In the Text-Based Emotion Detection Method, valence and arousal approaches are used for emotion analysis. Ranking the quadrant of the emotional level is identified by universal and blended emotions. In Audio based emotion detection, wave plot and spectrum visualization is used to identify the depth of emotion. By LSTM, a ROC curve with 50 epochs, 75 epochs, and 100 epochs is generated to check the accuracy level. Classification metrics are calculated for all models with text and audio emotions. One of the ML classification support parameter metrics for text emotion’s weighted average is calculated as 4000 and speech emotion’s weighted average is calculated as 4000. In AI learning with the Contextual Emotional Classifying model, the weighted average is 6000. CEC provides real-time emotional control for dynamic mood swings, warning of upcoming unplanned activities, task assignment, and model of care with existing facilities by decentralized Contextual Emotional Controller Ecosystem (CEC) model with the text and audio emotion analysis. In future, it is enhanced by face emotional warmth with pupil movement to endorse universal and blended emotions.
This work was funded by Researchers Supporting Project number (RSPD2023R636), King Saud University, Riyadh, Saudi Arabia.
[1] 5 Wearable Tech Devices That Increase Emotional Awareness | Live Happy Available online: https://www.livehappy.com/self/5-wearable-tech-devices-that-increase-emotional-awareness, accessed on 25 August 2022.
[2] Choi, Y.J., Lee, Y.W., Kim, B.G. (2021). Residual-based graph convolutional network for emotion recognition in conversation for smart Internet of Things. Big Data, 9(4): 279-288. https://doi.org/10.1089/BIG.2020.0274
[3] Hao, C., Dotzel, J., Xiong, J., Benini, L., Zhang, Z., Chen, D. (2021). Enabling design methodologies and future trends for edge AI: Specialization and codesign. IEEE Design & Test, 38(4): 7-26. https://doi.org/10.1109/MDAT.2021.3069952
[4] Michael, J.B. (2021). Security and privacy for edge artificial intelligence. IEEE Security & Privacy, 19(04): 4-7. https://doi.org/10.1109/MSEC.2021.3078304
[5] Shi, Y., Yang, K., Jiang, T., Zhang, J., Letaief, K.B. (2020). Communication-efficient edge AI: Algorithms and systems. IEEE Communications Surveys & Tutorials, 22(4): 2167-2191. https://doi.org/10.1109/COMST.2020.3007787
[6] Rincon, J.A., Julian, V., Carrascosa, C. (2020). Towards the edge intelligence: Robot assistant for the detection and classification of human Emotions. In Highlights in Practical Applications of Agents, Multi-Agent Systems, and Trust-worthiness. The PAAMS Collection: International Workshops of PAAMS 2020, L'Aquila, Italy, pp. 31-41. https://doi.org/10.1007/978-3-030-51999-5_3/COVER
[7] Davar, B.V. (2020). Gender, depression and emotion: Arguing for a de-colonized psychology. Gender and Mental Health: Combining Theory and Practice, 19-32. https://doi.org/10.1007/978-981-15-5393-6_2
[8] Chang, A. (2023). The role of artificial intelligence in digital health. In Digital Health Entrepreneurship, pp. 75-85. https://doi.org/10.1007/978-3-030-12719-0_7
[9] Meet the 5 Women Who Are Redefining AI and Driving Change in Indian Industry Available online: https://yourstory.com/herstory/2019/06/meet-the-5-women-who-are-redefining-ai-and-driving, accessed on 25 August 2022.
[10] Kolog, E.A., Montero, C.S., Sutinen, E. (2016). Annotation agreement of emotions in text: The influence of counsellors' emotional state on their emotion perception. In 2016 IEEE 16th International Conference on Advanced Learning Technologies (ICALT), pp. 357-359. https://doi.org/10.1109/ICALT.2016.21
[11] Acheampong, F.A., Nunoo-Mensah, H., Chen, W. (2021). Recognizing emotions from texts using an ensemble of transformer-based language models. In 2021 18th International Computer Conference on Wavelet Active Media Technology and Information Processing (ICCWAMTIP), pp. 161-164. https://doi.org/10.1109/ICCWAMTIP53232.2021.9674102
[12] Speech Emotion Recognition [An Applied Project] - ExtruDesign Available online: https://extrudesign.com/speech-emotion-recognition.
[13] Angel Deborah, S., Rajalakshmi, S., Milton Rajendram, S., Mirnalinee, T.T. (2020). Contextual emotion detection in text using ensemble learning. In Emerging Trends in Computing and Expert Technology, pp. 1179-1186. https://doi.org/10.1007/978-3-030-32150-5_121
[14] Caschera, M.C., Grifoni, P., Ferri, F. (2022). Emotion classification from speech and text in videos using a multimodal approach. Multimodal Technologies and Interaction, 6(4): 28. https://doi.org/10.3390/MTI6040028
[15] Ajitha, G., Prashanth, A., Radhika, C., Chaitanya, K. (2022). Emotion recognition in speech using MFCC and classifiers. In Computational Vision and Bio-Inspired Computing: Proceedings of ICCVBIC 2021, pp. 197-207. https://doi.org/10.1007/978-981-16-9573-5_14
[16] (PDF) Multinomial Naive Bayes Classification Model for Sentiment Analysis Available online: https://www.researchgate.net/publication/334451164_Multinomial_Naive_Bayes_Classification_Model_for_Sentiment_Analysis, accessed on 25 August 2022.
[17] Balakrishnan, V., Kaur, W. (2019). String-based multinomial Naïve Bayes for emotion detection among Facebook diabetes community. Procedia Computer Science, 159: 30-37. https://doi.org/10.1016/J.PROCS.2019.09.157
[18] Emotion Detection of Tweets Using Naïve Bayes Classifier Available online: https://www.researchgate.net/publication/327120380_Emotion_Detection_of_Tweets_using_Naive_Bayes_Classifier, accessed on 25 August 2022.
[19] Guo, J. (2022). Deep learning approach to text analysis for human emotion detection from big data. Journal of Intelligent Systems, 31(1): 113-126. https://doi.org/10.1515/JISYS-2022-0001
[20] Acheampong, F.A., Wenyu, C., Nunoo-Mensah, H. (2020). Text-based emotion detection: Advances, challenges, and opportunities. Engineering Reports, 2(7): e12189. https://doi.org/10.1002/ENG2.12189
[21] Medhat, W., Hassan, A., Korashy, H. (2014). Sentiment analysis algorithms and applications: A survey. Ain Shams Engineering Journal, 5(4): 1093-1113. https://doi.org/10.1016/J.ASEJ.2014.04.011
[22] Sun, C., Luo, B. (2022). Analysis of English writing text features based on random forest and Logistic regression classification algorithm. Mobile Information Systems, 2022: 6306025. https://doi.org/10.1155/2022/6306025
[23] Jaswanth, Y., Muni, R., Kumar, S., Sudhan, R.M., Vijaya Kumar, M., Rajagopalam, M. (2020). Sentiment analysis using logistic regression algorithm. European Journal of Molecular & Clinical Medicine, 7: 2081-2086.
[24] Fang, X., Zhan, J. (2015). Sentiment analysis using product review data. Journal of Big Data, 2(1): 1-14. https://doi.org/10.1186/S40537-015-0015-2
[25] Chamishka, S., Madhavi, I., Nawaratne, R., Alahakoon, D., De Silva, D., Chilamkurti, N., Nanayakkara, V. (2022). A voice-based real-time emotion detection technique using recurrent neural network empowered feature modelling. Multimedia Tools and Applications, 81(24): 35173-35194. https://doi.org/10.1007/S11042-022-13363-4
[26] Alotaibi, F.M. (2019). Classifying text-based emotions using logistic regression. VAWKUM Transactions on Computer Sciences, 31-37. https://doi.org/10.21015/VTCS.V16I2.551
[27] De Silva, J., Haddela, P.S. (2013). A term weighting method for identifying emotions from text content. In 2013 IEEE 8th International Conference on Industrial and Information Systems, pp. 381-386. https://doi.org/10.1109/ICIINFS.2013.6732014
[28] Liu, Y., Sun, H., Guan, W., Xia, Y., Zhao, Z. (2022). Multi-modal speech emotion recognition using self-attention mechanism and multi-scale fusion framework. Speech Communication, 139: 1-9. https://doi.org/10.1016/J.SPECOM.2022.02.006
[29] Leelavathi, R., Deepthi, S.A., Aruna, V. (2021). Speech emotion recognition using LSTM. International Research Journal of Engineering and Technology.
[30] Kurpukdee, N., Koriyama, T., Kobayashi, T., Kasuriya, S., Wutiwiwatchai, C., Lamsrichan, P. (2017). Speech emotion recognition using convolutional long short-term memory neural network and support vector machines. In 2017 Asia-Pacific Signal and Information Processing Association Annual Summit and Conference (APSIPA ASC), pp. 1744-1749. https://doi.org/10.1109/APSIPA.2017.8282315
[31] Xie, Y., Liang, R., Liang, Z., Huang, C., Zou, C., Schuller, B. (2019). Speech emotion classification using attention-based LSTM. IEEE/ACM Transactions on Audio, Speech, and Language Processing, 27(11): 1675-1685. https://doi.org/10.1109/TASLP.2019.2925934
[32] Zhao, J., Mao, X., Chen, L. (2019). Speech emotion recognition using deep 1D & 2D CNN LSTM networks. Biomedical Signal Processing and Control, 47: 312-323. https://doi.org/10.1016/J.BSPC.2018.08.035
[33] Khan, M.R., Khan, M.F., Iqbal, A. (2022). Elsevier Enhanced Reader. http://dx.doi.org/10.1016/j.egyr.2022.01.023
[34] Atmaja, B.T., Akagi, M. (2019). Speech emotion recognition based on speech segment using LSTM with attention model. In 2019 IEEE international conference on signals and systems (ICSigSys), pp. 40-44. https://doi.org/10.1109/ICSIGSYS.2019.8811080
[35] Lapate, R.C., Ballard, I.C., Heckner, M.K., D'Esposito, M. (2022). Emotional context sculpts action goal representations in the lateral frontal pole. Journal of Neuroscience, 42(8): 1529-1541. https://doi.org/10.1523/JNEUROSCI.1522-21.2021
[36] Cao, X. (2022). An empirical analysis of the role of piano performance in alleviating psychological trauma in people with psychological isolation disorder. Occupational Therapy International, 2022: 4024852. https://doi.org/10.1155/2022/4024852
[37] Chatterjee, R., Mazumdar, S., Sherratt, R.S., Halder, R., Maitra, T., Giri, D. (2021). Real-time speech emotion analysis for smart home assistants. IEEE Transactions on Consumer Electronics, 67(1): 68-76. https://doi.org/10.1109/TCE.2021.3056421
[38] Tariq, Z., Shah, S.K., Lee, Y. (2019). Speech emotion detection using IoT based deep learning for health care. In 2019 IEEE International Conference on Big Data (Big Data), pp. 4191-4196. https://doi.org/10.1109/BIGDATA47090.2019.9005638
[39] Uymaz, H.A., Metin, S.K. (2022). Vector based sentiment and emotion analysis from text: A survey. Engineering Applications of Artificial Intelligence, 113: 104922. https://doi.org/10.1016/J.ENGAPPAI.2022.104922
[40] De Silva, J., Haddela, P.S. (2013). A term weighting method for identifying emotions from text content. In 2013 IEEE 8th International Conference on Industrial and Information Systems, pp. 381-386. https://doi.org/10.1109/ICIINFS.2013.6732014
[41] Kumar, P., Khokher, V., Gupta, Y., Raman, B. (2021). Hybrid fusion based approach for multimodal emotion recognition with insufficient labeled data. In 2021 IEEE International Conference on Image Processing (ICIP), Anchorage, AK, USA, pp. 314-318. https://doi.org/10.1109/ICIP42928.2021.9506714
[42] Wang, Y. (2019). Emotions extracted from text vs. true emotions–an empirical evaluation in se context. In 2019 34th IEEE/ACM International Conference on Automated Software Engineering (ASE), San Diego, CA, USA, pp. 230-242. https://doi.org/10.1109/ASE.2019.00031
[43] AI with Python – Speech Recognition Available online: https://prutor.ai/ai-with-python-speech-recognition/, accessed on 17 October 2022.
[44] Kandhro, I.A., Uddin, M., Hussain, S., Chaudhery, T.J., Shorfuzzaman, M., Meshref, H., Khalaf, O.I. (2022). Impact of activation, optimization, and regularization methods on the facial expression model using CNN. Computational Intelligence and Neuroscience, 2022: 3098604. https://doi.org/10.1155/2022/3098604
[45] Zou, C.C., Zhang, X.R., Zha, C., Zhao, L. (2016). A novel DBN feature fusion model for cross-corpus speech emotion recognition. Journal of Electrical and Computer Engineering, 2016: 7437860. https://doi.org/10.1155/2016/7437860
[46] Python Mini Project - Speech Emotion Recognition with Librosa – DataFlair. https://data-flair.training/blogs/python-mini-project-speech-emotion-recognition/, accessed on 17 October 2022.
[47] He, K., Zhang, X., Ren, S., Sun, J. (2016). Deep residual learning for image recognition. In Proceedings of the IEEE conference on computer vision and pattern recognition, pp. 770-778. https://doi.org/10.1109/CVPR.2016.90
[48] Al Smadi, T., Al Issa, H.A., Trad, E., Al Smadi, K.A. (2015). Artificial intelligence for speech recognition based on neural networks. Journal of Signal and Information Processing, 6(02): 66. https://doi.org/10.4236/JSIP.2015.62006
[49] Multimodal Speech Emotion Recognition Using Audio and Text | Papers with Code Available online: https://paperswithcode.com/paper/multimodal-speech-emotion-recognition-using, accessed on 17 October 2022.
[50] Python Speech Recognition - Artificial Intelligence – DataFlair. https://data-flair.training/blogs/python-speech-recognition-ai/, accessed on 17 October 2022.
[51] Sharma, A., Yadav, D.P., Garg, H., Kumar, M., Sharma, B., Koundal, D. (2021). Bone cancer detection using feature extraction based machine learning model. Computational and Mathematical Methods in Medicine, 2021: 7433186. https://doi.org/10.1155/2021/7433186
[52] Bajaj, K., Sharma, B., Singh, R. (2021). Edge, fog and cloud-based smart communications for IoT network based services & applications. In 2021 International Conference on Artificial Intelligence and Machine Vision (AIMV), pp. 1-5. https://doi.org/10.1109/AIMV53313.2021.9670975
[53] Singh, K., Sharma, B., Singh, J., Srivastava, G., Sharma, S., Aggarwal, A., Cheng, X. (2020). Local statistics-based speckle reducing bilateral filter for medical ultrasound images. Mobile Networks and Applications, 25: 2367-2389. https://doi.org/10.1007/s11036-020-01615-2
[54] Koundal, D., Sharma, B. (2019). Challenges and future directions in neutrosophic set-based medical image analysis. In Neutrosophic Set in Medical Image Analysis, pp. 313-343. https://doi.org/10.1016/B978-0-12-818148-5.00015-1
[55] Garg, H., Sharma, B., Shekhar, S., Agarwal, R. (2022). Spoofing detection system for e-health digital twin using EfficientNet Convolution Neural Network. Multimedia Tools and Applications, 81(19): 26873-26888. https://doi.org/10.1007/S11042-021-11578-5
[56] Bansal, S., Tomar, V. K. (2022). Challenges & security threats in IoT with solution architectures. In 2022 2nd International Conference on Power Electronics & IoT Applications in Renewable Energy and its Control (PARC), pp. 1-5.
[57] Rajpoot, V., Gaur, S.R., Patel, A., Saxena, A. (2021). Internet of things for human-Activity recognition based on wearable sensor data. Sensor Data Analysis and Management: The Role of Deep Learning, 19-31.
[58] Yu, L.C., Lee, L.H., Hao, S., Wang, J., He, Y., Hu, J., Zhang, X. (2016). Building Chinese affective resources in valence-arousal dimensions. In Proceedings of the 2016 Conference of the North American Chapter of the Association for Computational Linguistics: Human Language Technologies, pp. 540-545. https://doi.org/10.18653/V1/N16-1066
[59] Siddiqui, M.F.H., Dhakal, P., Yang, X., Javaid, A.Y. (2022). A survey on databases for multimodal emotion recognition and an introduction to the VIRI (visible and InfraRed image) database. Multimodal Technologies and Interaction, 6(6): 47. https://doi.org/10.3390/MTI6060047
[60] Cao, H., Cooper, D.G., Keutmann, M.K., Gur, R.C., Nenkova, A., Verma, R. (2014). Crema-D: Crowd-sourced emotional multimodal actors dataset. IEEE Transactions on Affective Computing, 5(4): 377-390. https://doi.org/10.1109/TAFFC.2014.2336244
[61] Toronto Emotional Speech Set (TESS) TSpace Repository. https://tspace.library.utoronto.ca/handle/1807/24487, accessed on 9 September 2022.
[62] Livingstone, S.R., Russo, F.A. (2018). The Ryerson audio-visual database of emotional speech and song (RAVDESS): A dynamic, multimodal set of facial and vocal expressions in North American English. PloS One, 13(5): e0196391. https://doi.org/10.5281/ZENODO.1188976
[63] Asghar, J., Tabasam, M., Althobaiti, M.M., Adnan Ashour, A., Aleid, M.A., Ibrahim Khalaf, O., Aldhyani, T.H. (2022). A randomized clinical trial comparing two treatment strategies, evaluating the meaningfulness of HAM-D rating scale in patients with major depressive disorder. Frontiers in Psychiatry, 13: 873693. https://doi.org/10.3389/fpsyt.2022.873693
[64] Hamilton Ortiz, J., Tavera Romero, C.A., Taha Ahmed, B., Khalaf, O.I. (2022). QoS in FANET business and swarm data. Computers, Materials & Continua, 72(1): 1877-1899.
[65] Dhiman, P., Kukreja, V., Manoharan, P., Kaur, A., Kamruzzaman, M.M., Dhaou, I.B., Iwendi, C. (2022). A novel deep learning model for detection of severity level of the disease in citrus fruits. Electronics, 11(3): 495. https://doi.org/10.3390/electronics11030495
[66] Kukreja, V., Dhiman, P. (2020). A Deep Neural Network based disease detection scheme for Citrus fruits. In 2020 International Conference on Smart Electronics and Communication (ICOSEC), Trichy, India, pp. 97-101. https://doi.org/10.1109/ICOSEC49089.2020.9215359