Xiaohong Xiao*![]() | Jiangang Xie
| Jiangang Xie![]() | Bin Cai
| Bin Cai![]()
© 2023 IIETA. This article is published by IIETA and is licensed under the CC BY 4.0 license (http://creativecommons.org/licenses/by/4.0/).
OPEN ACCESS
The accurate and rapid extraction of water bodies is crucial for the assessment and macroscopic monitoring of water resources, wetland conservation, coastal change analysis, flood inundation assessment, and disaster management. Recent advancements in remote sensing technology, particularly the use of Landsat Enhanced Thematic Mapper Plus (ETM+) imagery, have significantly improved the ability to acquire high-resolution, timely, and extensive data for specific areas. This study is focused on the extraction of water bodies in southeast Hubei province. To enhance the accuracy of water body detection in this region, various methods were employed and comparatively analyzed. These included tasseled cap wetness (TCW), normalized difference water index (NDWI), single-band thresholding, and multi-band thresholding using TM2345 (a combination of Landsat bands 2, 3, 4, and 5), along with maximum likelihood classification (MLC). A critical observation in this study is that the first component resulting from principal component analysis (PCA) transformation exhibits a pronounced differentiation between features, particularly between water and non-water elements. Consequently, a novel approach for water body extraction based on PCA transformation was proposed and tested. Experimental results demonstrated that the combined use of the multi-band threshold TM2345 and PCA transformation yielded significantly higher accuracy in water body extraction compared to other methods. The PCA-based method, in particular, displayed minimal confusion between water and non-water bodies, emerging as the most effective technique among all evaluated. It achieved an unparalleled accuracy rate of 92.8%, thereby offering a valuable reference for water body extraction tasks in similar contexts.
remote sensing, water body extraction, principal component analysis (PCA), Landsat Enhanced Thematic Mapper Plus (ETM+)
Water resources are fundamental to sustaining the Earth's ecological environment and are indispensable for human survival and various production activities. Consequently, research into water resources is of paramount importance. The swift and precise extraction of water bodies plays a vital role in water resource management, micro monitoring, wetland conservation, detection of changes in lakes and coastlines, as well as in flood prediction and evaluation. Traditional ground survey techniques for large-scale areas, such as entire countries or continents, present challenges due to being time-consuming, sometimes impractical, and often resource-intensive [1].
The advent of remote sensing has revolutionized the management and utilization of water resources. Remote sensing data have become increasingly instrumental in water body extraction, a current research focal point [2]. Compared to conventional measurement techniques, remote sensing offers advantages in terms of convenience, safety, speed, and cost-effectiveness. Since the launch of Landsat-1 in the 1970s, a series of advanced satellites have been deployed, providing long-term multispectral images (MSI) extensively utilized in water body extraction research [3-19]. MSI exhibits several advantages in water body extraction compared to other remote sensing imagery such as synthetic aperture radar (SAR) imagery:
(1) The distinct spectral characteristics of water in MSI facilitate successful water extraction through appropriate single-band threshold settings.
(2) Multi-band combinations enhance water body identification over single-band grayscale images by providing richer color information for improved interpretation. Figure 1(a), (b) show the color synthesis of band 4,3,2 and band 4,5,3 in ETM + of Baoan Lake, and (c), (d) show the color synthesis of the Yangtze River basin, which shows good recognition of water information.
(3) MSI images offer better integrity for large water areas and are less susceptible to noise compared to SAR images, resulting in more complete water area representation.
Given these advantages in water recognition, and considering that Landsat ETM+ imagery provides higher resolution within the Landsat series, this study selects Landsat ETM+ imagery for water body extraction in the specified study area located in Hubei province. The objective is to extract an increasingly accurate representation of water bodies. This research examines common water body extraction methods documented in the literature for their effectiveness and proposes a PCA transformation method to enhance water body extraction accuracy.
Figure 1. Color composition images
In the realm of remote sensing, researchers have developed and refined a range of methods for water body extraction using MSI, including single-band threshold method, multi-band enhanced threshold method and post-classification extraction methods, and each has gained good results. Three common methods are introduced here:
2.1 Single-band threshold method
The single-band threshold method offers a straightforward approach to water body extraction using remote sensing imagery. This method hinges on analyzing the spectral characteristics or histograms of various objects within individual bands to pinpoint the most appropriate band and corresponding threshold for accurate water detection. In 1985, Juppdlb employed this method for water body extraction in Keynes, an Australian port within the Great Barrier Reef Marine Park. By analyzing histograms across different bands of Landsat ETM+ images, a threshold in band 7 was determined to be most effective [3]. Subsequently, in 1990, Moller-Jensen [4] conducted extensive experiments and established thresholds in bands 4 and 5 for similar extraction tasks. Lu and Li [5] also experimented with band 5 for water extraction but achieved less satisfactory results. Brasud and Feng [6] in their study of the land/water boundary along the Louisiana coastline in the United States, explored thresholds across various bands. Their findings suggested that band 5 was the most suitable for water body extraction. Similarly, Frazier and Page [7], in their analysis of Lake Wagga, concluded that band 5 provided higher accuracy in water body extraction compared to bands 4 and 7, although it was less effective in identifying smaller water bodies. While the single-band threshold method efficiently differentiates between water and non-water areas, it faces challenges in accurately defining transition zones between these terrains. Additionally, the selection of an appropriate threshold is critical: excessively high thresholds may omit certain water bodies, whereas overly low thresholds risk including non-water elements. The method thus requires careful calibration to ensure optimal water body extraction.
2.2 Multi-band enhancement threshold method
The multi-band enhancement threshold method has gained popularity in recent years for extracting water bodies using remote sensing imagery. This technique emphasizes the spectral features of water to facilitate easier detection. One notable example is the NDWI (NDWI=(TM2-TM4)/(TM2+TM4)), proposed by McFeeter [8], which effectively suppresses vegetation and soil information to accurately extract water bodies. However, Xu [9] encountered difficulties in suppressing soil and building information using McFeeter’s NDWI and thus proposed a modified version (MNDWI=(TM2-TM5)/(TM2+TM5)) tailored to her study’s needs. Yang’s analysis of the spectral characteristics of Landsat TM data revealed specific water body spectral values: (TM2+TM3)>(TM4+TM5). This finding formed the basis for his water extraction method [10]. Chen et al. [11] focusing on highland and mountainous areas, determined a threshold K for (TM2+TM3)-(TM4+TM5) to differentiate between mountain shadows and water bodies, finding minimal confusion between these two elements when the condition (TM2+TM3)-(TM4+TM5)>K was met. In 2006, Ouma and Tathishi [12] employed NDWI3 (NDWI3=(TM4-TM5)/(TM4+TM5)) along with the Tasseled Cap Wetness index (TCW) to successfully map shoreline changes of five lakes in the Great Rift Valley. Despite the effectiveness of the multi-band enhancement threshold method in highlighting water body spectral features, it faces two key challenges. Firstly, due to limited spatial resolution, determining the optimal threshold can be challenging, and the presence of mixed pixels complicates this further. A high threshold might lead to the omission of smaller water bodies, while a low threshold could cause the erroneous inclusion of non-water areas. Secondly, the applicability of different methods varies according to the study area. For instance, MNDWI, TCW, and NDWI3 are effective in differentiating buildings from water but struggle to distinguish between mountain shadows and water. Conversely, NDWI excels in extracting water bodies in non-mountainous, vegetated areas.
2.3 Post-classification extraction method
The post-classification extraction method for water bodies involves initially categorizing the study area into various land types and subsequently segregating the water body information from these classifications. This approach has been utilized with varying degrees of success in different studies. Kloiber et al. [13] employed an unsupervised classification technique to initially classify TM images into ten distinct categories. These categories were then reorganized into two broader groups: water bodies and non-water bodies. The final step involved applying a binary mask method to accurately delineate the water bodies. Shih [14] conducted a comparative study of two different water body extraction methods: (1) using unsupervised classification for a combined image of bands 5 and 7, and (2) directly extracting water bodies using a single-band threshold method from band 7. The comparison revealed only a 3% difference in the water surface areas obtained by these two methods, suggesting that either could be effectively employed.
In the context of this paper, various methods delineated in the literature for extracting water bodies are applied and compared for the specific study area. Through experimental validation, the PCA transformation method is explored to achieve enhanced accuracy in water body extraction. This approach aims to leverage the strengths of PCA in distinguishing water bodies more effectively than traditional methods.
3.1 Study area
The research is focused on a region located in the southeast of Hubei Province, encompassing a total area of 157,380 hectares. Hubei province is known for its abundant water resources, making it an exemplary site for water resource studies. The area experiences a subtropical humid monsoon climate and records a maximum annual rainfall of approximately 1,600 mm. This diverse landscape comprises various surface categories including urban built areas, suburban zones, farmlands, mountainous regions, and significant water bodies. The study area is characterized by its wealth of water resources, which includes several lakes and reservoirs, a section of the Yangtze River, and numerous smaller water bodies such as rivers and ponds. Notably, the northeastern region adjacent to Baoan Lake features extensive fish farming ponds, adding to the area's aquatic richness. Additionally, parts of Baoan Lake and Huama Lake are utilized for large-scale lotus planting, contributing to the area's ecological and agricultural diversity. Figure 2 presents a Landsat ETM+ 453 composite image captured on August 19, 2008, offering a visual representation of the study area's varied landscape and water resources. This region, with its rich and varied water bodies, provides an ideal setting for conducting comprehensive research on water resource management and extraction methodologies.
3.2 Landsat ETM+ data
Landsat, the satellite system operated by the United States, has been a cornerstone in the field of remote sensing since the launch of its first satellite, Landsat 1, in the early 1970s. Up to the latest in the series, Landsat 7, the Landsat program has provided over five decades of consistent, high-resolution, and multi-spectral remote sensing data for scientific research and Earth observation. Landsat 7, launched in 1999, completes an operational orbit cycle in 98.9 minutes and revisits the same area every 16 days. It orbits the Earth 15 times daily, making it one of the most extensively used satellites for Earth observation [20]. The Landsat 7 satellite is equipped with the Enhanced Thematic Mapper Plus (ETM+), a multi-spectral scanner featuring eight-band sensors. These sensors span a range of wavelengths from infrared to visible light and passively detect both the reflection of solar radiation and the heat radiation emitted by the Earth's surface. ETM+ boasts an improved resolution in the infrared band compared to the Thematic Mapper (TM) equipment mounted on Landsat 4 and 5, enhancing its accuracy in ground object identification.
(a) Location map of our study area in Hubei Province, China
(b) Landsat ETM+ image (band453) of the study area
Figure 2. The study area
Note: BAL- Baoan Lake; CL- Chao Lake; HML- Huama Lake; YLL-Yanlan Lake; SSL-Sanshan Lake; HLR- Huanglong Reservoir; SQR- Shiqiao Reservoir; CiL-Ci Lake; YTR- Yangtze River; R1-River 1; R2-River 2.
The Landsat ETM+ imagery comprises eight spectral bands. Bands 1 to 5 and band 7 have a spatial resolution of 30 meters. Band 6H/6L, which captures thermal infrared data, offers a resolution of either 60 meters or 30 meters. The panchromatic band 8 has a higher resolution of 15 meters. Each ETM+ scene approximately covers an area of 170 km north-south by 183 km east-west (106 mi by 114 mi). The specific wavelengths and resolutions of these eight channels/bands are detailed in Table 1. For the purposes of this study, bands 1 to 5 and band 7 were utilized. The thermal band (band 6) was not employed due to its relatively coarser spatial resolution (about 60 meters) and the minimal spectral signature variation it offers between different surface features.
Table 1. The eight bands of Landsat ETM+
|
Band No. |
Frequency (μm) |
Ground Resolution (m) |
|
1 |
B: 0.45~0.52 |
30m |
|
2 |
G: 0.52~0.60 |
30m |
|
3 |
R: 0.63~0.69 |
30m |
|
4 |
NIR: 0.76~0.90 |
30m |
|
5 |
SWIR: 1.55~1.75 |
30m |
|
6 |
TIR: 10.4~12.5 |
60m |
|
7 |
SWIR: 2.08~2.35 |
30m |
|
8 |
PAN: 0.52~0.90 |
15m |
Note: B-blue; G-green; R-red; NIR-near infrared ray; SWIR-short-wave infrared ray; TIR-thermal infrared ray; PAN-panchromatic.
In this study, seven date images (Path 122, Row 39) were selected and processed, as outlined in Table 2. Each image encompasses an area of 170 km north to south and 183 km east to west (approximately 106 miles by 114 miles). The primary focus of this paper is on the analysis of the image dated August 19, 2008 (referred to as image20080819). The other images in the dataset serve as comparative references. There is presence of clouds in these data sets more or less.
Table 2. Landsat ETM+ data specification (Path/Row: 122/39)
|
Date |
Landsat Sensor |
Cloud Coverage (%) |
|
20080209 |
ETM+(SLC-off) |
0.17 |
|
20080515 |
ETM+(SLC-off) |
9.63 |
|
20080819 |
ETM+(SLC-off) |
5.35 |
|
20090110 |
ETM+(SLC-off) |
0.13 |
|
20090907 |
ETM+(SLC-off) |
6.97 |
|
20091025 |
ETM+(SLC-off) |
0.01 |
|
20100318 |
ETM+(SLC-off) |
0.00 |
3.3 Methodology
Figure 3 delineates the comprehensive processing framework utilized in this study.
(1) Preprocessing of Landsat ETM+ Data:
The Landsat ETM+ data, obtained from http://datamirror.csdb.cn/, initially presented with striping artifacts in each band. These strips were effectively removed using a multi-image adaptive local regression method (RGF), also available on http://datamirror.csdb.cn/. As indicated in Table 2, a significant portion of the imagery is obscured by cloud cover, which can substantially impact the accuracy of water body extraction. To mitigate this issue, clouds and their shadows were meticulously removed prior to analysis. This was achieved using a local index-based cloud-removal method developed by Xiao and Wu [21], which has proven effective in enhancing classification accuracy.
(2) Band Selection:
The selection of appropriate bands for water body recognition was informed by a thorough review of existing literature and an analysis of the spectral characteristics of each band in the image dated August 19, 2008 (image20080819). This process identified the bands most conducive to accurate water body detection.
(3) Water Body Extraction Using Various Methods:
Following the successful removal of striping and cloud-related artifacts, water body extraction from image20080819 was conducted using several methodologies. These included TCW, single-band thresholding, NDWI, MLC, and PCA transformation. The accuracy of water body extraction for each method was calculated and compared to ascertain their respective efficacy.
Figure 3. The whole processing framework
3.4 Band selection of Landsat ETM+ images
(1) Common Wavebands for Water Body Extraction:
Different spectral bands capture the reflective characteristics of various ground objects. In the context of water body extraction, certain bands are more conducive to identifying water due to the unique imaging mechanisms and characteristics of water. Based on the findings of other scholars and the actual conditions of the study area, specific bands have been identified as most effective for this purpose (detailed in Table 3). Commonly utilized bands for water body detection include blue-green, red, and near-infrared wavelengths [22].
Table 3. Common wave band of water body extraction
|
Band |
Description |
|
Blue-Green Light Bands (Bands 1 and 2) |
In clear water, the reflectivity of blue-green light ranges between 4% and 5%. The transmittance of water bodies is higher in the blue light band, leading to the superimposition of the water's reflection on that of the underlying surface. Typically, the reflectivity in these bands is markedly higher compared to others. However, distinguishing between water bodies and dry lands can be challenging due to some level of spectral similarity. |
|
Red Light Band (Band 3) |
Water bodies exhibit a reflectivity of approximately 2% in the red light band. This distinct characteristic enables water bodies to be differentiated from dry lands using threshold methods. However, this band does encounter difficulties in differentiating water from shadowed areas, which can lead to mis-classification. |
|
Near-Infrared and Short-Wave Infrared (Bands 4 and 5) |
In the near-infrared and short-wave infrared spectrum, water's reflectivity is nearly zero, enabling a clear distinction between water bodies and various land covers such as woodlands, residential areas, paddy fields, and dry lands. Nonetheless, there is potential confusion between water and shadow, particularly in the short-wave infrared band, where shadow effects can be more pronounced. |
(2) Band Selection for Landsat ETM+ Images:
Each ETM+ image consists of eight distinct bands. Prior research indicates that selecting an optimal subset of bands from the Landsat ETM+ can enhance classification results [23, 24]. Water coefficients, which are indicators derived from two or more bands, tend to be particularly valuable in this context. In this study, bands 1 to 5 and band 7 have been selected based on their distinct features in reflecting water.
Figure 4. The spectral curve of img20080819
Upon analyzing the spectra of image20080819 across these seven bands (as illustrated in Figure 4), it is observed that the spectral signatures of lakes, rivers, and ponds are almost identical in all seven bands. However, a marked difference between the water and non-water parts is noted in bands 2, 3, 4, and 5, with band 5 exhibiting a particularly pronounced distinction. Therefore, based on the unique advantages of band 5 highlighted in previous studies, this band has been chosen for the single-band threshold method analysis. For multi-band analysis, the combination of bands that best differentiates water from non-water bodies is selected. Through careful observation of the spectral characteristics of each band, bands 3, 4, and 5 are chosen to create a color synthetic image (TM453). This combination exhibits significant differences between water and non-water areas, thereby facilitating more accurate water body extraction results.
4.1 Different traditional methods for water body extraction
The extraction of water bodies from Landsat ETM+ imagery has been a subject of extensive research. Common methodologies employed in this realm include the single-band threshold method, multi-band enhancement threshold method, and post-classification extraction method. This study has undertaken a comprehensive evaluation of these traditional methods as documented in the literature to assess their effectiveness in extracting water bodies within the specified study area.
The following are some of the indices and methods referenced in previous studies and applied in this research for water body extraction:
(1) TCW
The TCW [12] index is defined as follows:
$\begin{align}
& TCW=0.1529*TM1+0.1973*TM2+0.3279*TM3 \\
& \text{ }+0.3406*TM4-0.7112*TM5-0.4572*TM7 \\
\end{align}$ (1)
(2) NDWI1
NDWI1 [25] is defined as follows:
$NDWI1=\frac{TM2-TM4}{TM2+TM4}$ (2)
(3) NDWI2 (MNDWI)
NDWI2 (MNDWI) [9] is defined as follows:
$NDWI1=\frac{TM2-TM5}{TM2+TM5}$ (3)
(4) NDWI3
NDWI3 [26] is defined as follows:
$NDWI1=\frac{TM4-TM5}{TM4+TM5}$ (4)
(5) Threshold1
The single-band threshold 1 [27, 28] is defined as follows, and the value of K depends on the histogram distribution and experimental validation.
$if\begin{matrix}
TM5<K\begin{matrix}
{} \\
\end{matrix} \\
\end{matrix}THEN\begin{matrix}
{} \\
\end{matrix}water$ (5)
(6) Threshold2 (TM2345)
The multi-band threshold 2 [29] was defined as follows. The grayscale map generated by TM2 + TM3-(TM4 + TM5) is marked as TM2345. Through analysis of its histogram and experimental validation, the value of k is determined.
$\begin{align}
& TM2+TM3-(TM4+TM5) \\
& >K\begin{matrix}
{} \\
\end{matrix}THEN\begin{matrix}
{} \\
\end{matrix}water \\
\end{align}$ (6)
In addition to the methods mentioned above, PCA and IHS transform are applied to TM453 band combination to observe the characteristics of water body from the perspective of transform space.
(7) MLC
The MLC, often referred to as Bayes classification, is a technique utilized for image classification in remote sensing. This method is grounded in Bayes' criteria, which employs statistical probabilities to categorize image pixels based on their spectral signatures. In this study, samples representing various ground objects were collected and analyzed using the MLC approach applied to the TM453, and classification results of water body were attained.
Table 4. Statistics of minimum, maximum and mean pixel values of different features
|
Indexes/Methods |
|
Water |
Build-Up Area |
Vegetation |
Ground |
Unknown Objects |
Non-Water |
Difference |
|
TCW |
mim |
15.626 |
-54.866 |
-53.533 |
-98.368 |
-108.937 |
-108.937 |
|
|
max |
43.193 |
24.742 |
21.779 |
28.394 |
0.128 |
38.903 |
|
|
|
mean |
31.07 |
2.872 |
-11.59 |
-24.003 |
-35.96 |
-14.948 |
46.018 |
|
|
NDWI1 |
min |
0.30 |
0.153 |
-0.177 |
-0.143 |
0.08 |
-0.177 |
|
|
max |
0.615 |
0.388 |
0.309 |
0.429 |
0.356 |
0.5 |
|
|
|
mean |
0.545 |
0.318 |
-0.006 |
0.123 |
0.231 |
0.109 |
0.436 |
|
|
NDWI2 |
min |
0.26 |
-0.229 |
-0.282 |
-0.404 |
-0.358 |
-0.404 |
|
|
max |
0.701 |
0.36 |
0.351 |
0.52 |
0.119 |
0.616 |
|
|
|
mean |
0.598 |
0.133 |
-0.108 |
-0.124 |
-0.081 |
-0.066 |
0.664 |
|
|
NDWI3 |
min |
-0.176 |
-0.377 |
-0.325 |
-0.496 |
-0.489 |
-0.496 |
|
|
max |
0.226 |
0.015 |
0.143 |
0.122 |
-0.213 |
0.263 |
|
|
|
mean |
0.08 |
-0.193 |
-0.103 |
-0.241 |
-0.308 |
-0.174 |
0.254 |
|
|
Threshold1(TM5) |
min |
11 |
29 |
23 |
18 |
63 |
14 |
|
|
max |
37 |
126 |
118 |
172 |
180 |
180 |
|
|
|
mean |
15.841 |
52.542 |
70.651 |
87.987 |
115.284 |
77.218 |
-61.377 |
|
|
Threshold2(TM2345) |
min |
49 |
0 |
0 |
0 |
0 |
0 |
|
|
max |
112 |
92 |
44 |
69 |
61 |
93 |
|
|
|
mean |
81.918 |
47.912 |
0.66 |
4.094 |
39.665 |
10.936 |
70.982 |
4.2 Water body extraction results of traditional methods
Table 4 shows the minimum, maximum and mean pixel values of different ground features in TCW, NDWI1, NDWI2, NDWI3, Threshhold1(TM5), and Threshhold2(TM2345).
Based on the analysis of data in Table 4 and the histogram of each gray-level image, the thresholds are determined for each gray-level image mentioned in the previous section.
Table 5 shows the classification possibility matrix of TCW, NDWI1, NDWI2, NDWI3, Threshhold1(TM5), Threshhold2(TM2345), and TM453_MLC.
Table 5. The possibility matrix of water body extracted using various methods
|
Methods |
|
Water (%) |
Non_water (%) |
|
Tcw |
Water |
89.87 |
10.51 |
|
Non_water |
10.13 |
89.49 |
|
|
Ndwi1 |
Water |
90.13 |
11.09 |
|
Non_water |
9.87 |
88.91 |
|
|
Ndwi2 |
Water |
90.71 |
11.41 |
|
Non_water |
9.29 |
88.59 |
|
|
Ndwi3 |
Water |
88.59 |
9.15 |
|
Non_water |
11.41 |
90.85 |
|
|
Threshold1(TM5) |
Water |
89.73 |
12.92 |
|
Non_water |
10.27 |
87.08 |
|
|
Threshold2(TM2345) |
Water |
91.37 |
17.82 |
|
Non_water |
8.63 |
82.18 |
|
|
TM453-mlc |
Water |
87.71 |
12.31 |
|
Non_water |
12.29 |
87.69 |
The comparative analysis of the aforementioned water body extraction methods reveals that while some achieve high accuracy, they also exhibit varying degrees of confusion with other land features, including buildings, vegetation, and shadows.
A close examination of specific water pixels in the Landsat ETM+ imagery highlights that smaller water bodies, such as ponds and rivers, often manifest as mixed pixels. Their spectral characteristics can be easily misinterpreted, leading to confusion with other land cover types, such as buildings, vegetation, and mountain shadows. For instance, Figure 5 displays the classification results using NDWI1, as proposed by McFeeter, which achieved a water body extraction accuracy of 90.13%. However, this method showed considerable mis-classification between ponds and buildings. The TM2345 method, on the other hand, attained the highest water body extraction accuracy at 91.37%. Despite this high level of accuracy, a significant proportion of non-water bodies were incorrectly classified as water. Figure 6 presents the results obtained from TM2345, where small water bodies such as rivers are clearly discernible, but there is notable confusion with buildings and mountain shadows.
Figure 5. Water body extraction result using NDWI1
Figure 6. Water body extraction result of TM2345
4.3 Water body extraction using PCA transformation
PCA is a statistical technique employed in multivariate analysis to explore correlations among multiple variables. It aims to uncover the underlying structure within a set of variables by deriving a small number of principal components. These components are designed to retain as much information from the original variables as possible while being mutually independent. In the context of remote sensing and image analysis, PCA transformation concentrates the information of an image into its initial few principal components. This process allows for the discarding of components containing minimal information, thereby transforming extensive hyperspectral data into a manageable number of informative components. In this experiment, the first three principal components, which encapsulate the most significant information of the image, were retained for analysis.
The results of applying PCA transformation to the TM453 composite image are illustrated in Figure 7. Additionally, Figure 8 presents the spectral characteristics post-PCA transformation.
Figure 7. Transformed result of TM453 based on PCA (pca453) (3 components)
Figure 8. Spectra curve of pca453
As indicated in Figure 8, the first component resulting from the PCA transformation of the TM453 composite (hereafter referred to as pca453) exhibits a pronounced differentiation between various features, particularly in distinguishing water from non-water areas. This significant disparity makes the first principal component of pca453 a valuable tool for water body extraction.
The visual analysis of the grayscale image presented in Figure 9 clearly reveals a stark contrast between the water and non-water areas. This distinction is particularly evident in the grayscale rendition, where the water parts are markedly different in tone compared to the surrounding land areas. Further supporting this visual observation, Table 6 provides a statistical breakdown of the pixel values corresponding to different ground objects. The data clearly indicate that the pixel values for water and non-water bodies are significantly different. This disparity highlights the potential for effectively distinguishing between water and non-water areas, provided that an appropriate threshold is determined.
Figure 9. Grey image generated by the first component of pca453 (pca453-first)
Table 6. Statistics of minimum, maximum and mean pixel values of different features of pca453-first
|
Indexes/Methods |
|
Water |
Build-Up Area |
Vegetation |
Ground |
Unknown Objects |
Non-Water |
Difference |
|
pca453_first |
min |
28.505 |
50.651 |
40.607 |
37.586 |
91.341 |
36.003 |
|
|
max |
58.785 |
157.685 |
122.549 |
194.692 |
229.246 |
229.246 |
|
|
|
mean |
34.975 |
77.65 |
87.251 |
116.755 |
155.849 |
103.758 |
-68.783 |
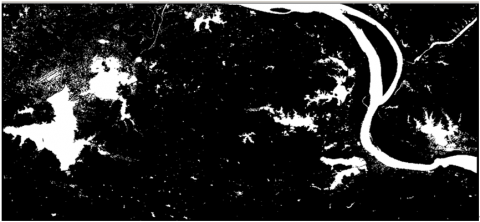
Building upon the analysis results of the data given in Table 6 and the histogram of the pca453-first grayscale image, an appropriate threshold was determined for the extraction of water bodies. The final extraction results, achieved by applying this determined threshold to the pca453-first component, are displayed in Figure 10, and the classification possibility matrix is given in Table 7.
From Figure 10 and the probability matrix in Table 7, it is evident that the use of pca453-first significantly reduces the mis-classification between water and non-water bodies. Notably, the issue of mountain shadows being erroneously identified as water in the TM2345 method is effectively resolved with pca453-first. This approach demonstrates the highest accuracy in water body extraction among all the methods evaluated in this study, clearly distinguishing itself as the most effective technique in minimizing confusion and accurately identifying water bodies.
Figure 10. Water body extraction result of pca453_first
Table 7. Possibility matrix of water body extracted of pca453-first
|
Methods |
|
Water (%) |
Non_Water (%) |
|
pca453_first |
Water |
92.75 |
7.99 |
|
Non_water |
7.25 |
92.01 |
Table 8. The area and accuracy of water bodies extracted by different methods
|
Methods |
Extracted Points |
Non-Extracted Points |
Accuracy (%) |
Extracted Area (ha) |
Percentage (%) |
|
Tcw |
449 |
51 |
89.8 |
16,857.5 |
10.71 |
|
Ndwi1 |
451 |
49 |
90.2 |
16,912.48 |
10.74 |
|
Ndwi2 |
454 |
47 |
90.8 |
16,986.93 |
10.79 |
|
Ndwi3 |
443 |
57 |
88.6 |
16392.18 |
10.42 |
|
Threshold1(TM5) |
448 |
52 |
89.6 |
16838.39 |
10.70 |
|
Threshold2(TM2345) |
457 |
43 |
91.4 |
17,102.10 |
10.87 |
|
TM453-mlc |
438 |
62 |
87.6 |
16022.54 |
10.18 |
|
PCA-first |
464 |
36 |
92.8 |
18,026.65 |
11.45 |
|
Total area |
157,380.57 |
||||
Table 8 presents a comparative analysis of the area and accuracy of water bodies extracted using the various methods evaluated in this study, while Figure 11 graphically represents these comparisons through line charts. Based on the data in Table 8 and the visual insights from Figure 11, several key conclusions can be drawn:
(1) PCA-first Method Efficacy: The PCA-first method achieves the highest accuracy in water body extraction among all the methods tested. Notably, it demonstrates minimal confusion between water and non-water bodies, indicating its effectiveness in accurately delineating water areas.
(2) Relationship Between Size and Accuracy: There is a proportional relationship between the size of the extracted water area and the accuracy of the extraction. Methods that yield higher accuracy also tend to extract larger water body areas, underscoring the importance of precision in these techniques.
(3) Varied Performance of Established Methods: Some methods, such as the TCW, single-band threshold using TM5, and MLC, have been reported as effective in previous studies. However, these methods did not perform as well in the specific context of our study area. This variation highlights the importance of contextual application of these methods.
(4) Importance of Spectral Feature Analysis: For any given study area, it is crucial to analyze the spectral features of different ground objects to identify the most suitable bands. Selecting bands with clear distinctions from other ground features is key to the effective analysis of specific land type objects. This tailored approach ensures that the chosen method aligns well with the unique characteristics of the study area, thereby enhancing the accuracy and reliability of the water body extraction process.
Figure 11. Line charts of the area and accuracy of water bodies extracted by different methods
The extensive testing and comparison of various water body extraction methods utilizing Landsat ETM+ imagery have led to several significant conclusions:
Firstly, Landsat ETM+ imagery proves to be an effective tool for water body extraction. Its high-resolution and multi-spectral capabilities facilitate accurate identification of aquatic areas.
Secondly, the selection of appropriate bands or band combinations is crucial in the process of identifying water bodies. The effectiveness of water body extraction is greatly influenced by the spectral characteristics of each band, underscoring the importance of thoughtful band selection based on the specific spectral features relevant to water detection.
Thirdly, the determination of a precise threshold for distinguishing between water and non-water areas is a critical factor in achieving accurate extraction results. The correct threshold setting is instrumental in minimizing mis-classification and enhancing the overall accuracy of the water body extraction process.
Fourthly, exploring transformation spaces such as PCA can uncover valuable information for water body extraction. Such transformations can enhance the differentiation between water and non-water features, thereby improving extraction accuracy.
The methodologies and strategies for designing water body extraction schemes outlined in this paper can serve as a useful reference for similar studies in other contexts. The findings emphasize the importance of tailored approaches that consider the unique spectral characteristics of the study area, as well as the potential benefits of incorporating advanced analytical techniques like PCA transformation. This study contributes valuable insights to the field of remote sensing and can aid in the development of more efficient and precise water body extraction methods in future research.
We express our profound gratitude to the Department of Education of Guangdong Province for their generous support in funding this study through several key projects. The projects and their respective grant numbers are as follows:
A characteristic innovation project titled “Land Classification Based on Image Fusion of LandsatETM and ALOSPASAR Data” (Grant No.: 2020KTSCX398).
A key platform project named “Research on Improved Inverse Time Migration Imaging System Based on Time-domain Pseudo-spectrum Method and Convolutional Neural Network” (Grant No.: 2021ZDZX1039).
A university scientific research platform and new generation information technology key fields project, “Research on Panoramic Information Fusion Computing and Evaluation in an Open Smart Learning Environment” (Grant No.: 2021ZDZX1076), and a related project, “Research on the Architecture and Construction Technology of Ultra High Speed Massive Data Storage System Integrating AI Computing Power” (Grant No.: 2023ZDZX1051).
Additionally, our sincere thanks go to Guangdong Open University for providing crucial funding for the school project titled “Research on Water body extraction and Change Detection Based on Image Fusion” (Grant No.: RC1918).
The financial support received from these esteemed institutions has been instrumental in facilitating the research and development activities that have significantly contributed to the advancements made in this study.
[1] Bagli, S., Soille, P. (2003). Morphological automatic extraction of coastline from Pan-European Landsat TM images. In Proceedings of the Fifth International Symposium on GIS and Computer Cartography for Coastal Zone Management, Genova, GISIG and ICCOPS, pp. 58-59.
[2] Smith, L.C. (1997). Satellite remote sensing of river inundation area, stage, and discharge: A review. Hydrological Processes, 11(10): 1427-1439. https://doi.org/10.1002/(SICI)1099-1085(199708)11:10<1427::AID-HYP473>3.0.CO;2-S
[3] Jupp, D.L., Mayo, K.K., Kucher, D.A., Heggen, S.J., Kendall, S.W., Radke, B.M., Ayling, T. (1985). Landsat based interpretation of the Cairns section of the Great Barrier Reef Marine Park. The CSIRO Natural Resources Series, No. 4, CSIRO, Division of Water and Land Resources, Australia.
[4] Moller-Jensen, L. (1990). Knowledge-based classification of an urban area using texture and context information in Landsat TM imagery. Photogrammetric Engineering and Remote Sensing, 56: 899-904. https://doi.org/10.1016/j.juro.2013.06.083
[5] Lu, J.J., Li, S.H. (1992). Improvement of water identification technology using TM. Journal of Remote Sensing, 7(1): 17-23.
[6] Braud, D.H., Feng, W. (1998). Semi-automated construction of the Louisiana coastline digital land/water boundary using Landsat Thematic Mapper satellite imagery. Louisiana Applied Oil Spill Research and Development Program, OS2 RAPD Technical Report Series, 97(2).
[7] Frazier, P.S., Page, K.J. (2000). Water body detection and delineation with Landsat TM data. Photogrammetric Engineering and Remote Sensing, 66(1): 1461-1467.
[8] McFeeters, S.K. (1996). The use of the normalized difference water index (NDWI) in the delineation of open water features. International Journal of Remote Sensing, 17(7): 1425-1432. https://doi.org/10.1080/01431169608948714
[9] Xu, H. (2005). A study on information extraction of water body with the modified normalized difference water index (MNDWI). Journal of Remote Sensing, 9(5): 589-595.
[10] Yang, C., Xu, M. (1998). Study on water body extraction using remote sensing mechanism. Geographical Research, 17: 86-89.
[11] Chen, H., Wang, J., Chen, Z. (2004). Comparison of water body extraction methods in mountainous plateau region from TM image. Remote Sensing Technology and Application, 19(6): 479-484. https://doi.org/10.1016/j.csr.2003.12.006
[12] Ouma, Y.O., Tateishi, R. (2006). A water index for rapid mapping of shoreline changes of five East African Rift Valley lakes: An empirical analysis using Landsat TM and ETM+ data. International Journal of Remote Sensing, 27(15): 3153-3181. https://doi.org/10.1080/01431160500309934
[13] Kloiber, S.M., Brezonik, P.L., Bauer, M.E. (2002). Application of Landsat imagery to regional-scale assessments of lake clarity. Water Research, 36(17): 4330-4340. https://doi.org/10.1016/S0043-1354(02)00146-X
[14] Shih, S.F. (1985). Comparison of ELAS classifications and density slicing Landsat data for water surface area assessment. Hydrologic Applications of Space Technology, 160: 91-97.
[15] Xu, D., Zhang, D., Shi, D., Luan, Z. (2020). Automatic extraction of open water using imagery of Landsat series. Water, 12(7): 1928. https://doi.org/10.3390/w12071928
[16] Babaei, H., Janalipour, M., Tehrani, N.A. (2021). A simple, robust, and automatic approach to extract water body from Landsat images (case study: Lake Urmia, Iran). Journal of Water and Climate Change, 12(1): 238-249. https://doi.org/10.2166/wcc.2019.078
[17] Nhu, V.H., Mohammadi, A., Shahabi, H., Shirzadi, A., Al-Ansari, N., Ahmad, B.B., Chen, W., Khodadadi, M., Ahmadi, M., Khosravi, K., Nguyen, H. (2020). Monitoring and assessment of water level fluctuations of the Lake Urmia and its environmental consequences using multitemporal Landsat 7 ETM+ images. International Journal of Environmental Research and Public Health, 17(12): 4210. https://doi.org/10.3390/ijerph17124210
[18] Acharya, T.D., Subedi, A., Huang, H., Lee, D. (2019). Application of water indices in surface water change detection using Landsat imagery in Nepal. Sensors and Materials, 31(5): 1429. https://doi.org/10.18494/SAM.2019.2264
[19] Huang, C., Chen, Y., Zhang, S., Wu, J. (2018). Detecting, extracting, and monitoring surface water from space using optical sensors: A review. Reviews of Geophysics, 56(2): 333-360. https://doi.org/10.1029/2018RG000598
[20] Song, X.Y., Liu, L.Y., Li, C.J., Wang, J., Zhao, C. (2006). Cloud removing based on single remote sensing image. Optical Technique, 32(2): 299-303. https://doi.org/10.3321/j.issn:1002-1582.2006.02.043
[21] Xiao, X., Wu, Y. (2014). A cloud-removal method based on image fusion using local indexes. Computer Modeling and New Technology, 18(4): 82-88.
[22] Qiu, D., Tian, S., Wu, Y. (2019). Water information extraction from the ETM images. China Science and Technology Papers Online.
[23] Crist, E.P., Cicone, R.C. (1984). Comparisons of the dimensionality and features of simulated Landsat-4 MSS and TM data. Remote Sensing of Environment, 14: 235-246. https://doi.org/10.1016/0034-4257(84)90018-X
[24] Barry, N.H. (1984). Multisensor data analysis of urban environments. Photogrammetric Engineering and Remote Sensing, 50(10): 1471-1477.
[25] Feyisa, G.L., Meilby, H., Fensholt, R., Proud, S.R. (2014). Automated water body extraction index: A new technique for surface water mapping using Landsat imagery. Remote Sensing of Environment, 140: 23-35. https://doi.org/10.1016/j.rse.2013.08.029
[26] Lee, K.S., Hoffer, R.M. (1990). Analysis of combined Sir-B and TM data for assessing forest biomass. IEEE Geoscience and Remote Sensing Symposium, Proceedings IGARSS 1990, 3: 1227-1230. https://doi.org/10.1109/IGARSS.1990.688718
[27] Haack, B.N., Slonecker, E.T. (1994). Merged spaceborne radar and thematic mapper digital data for locating villages in Sudan. Photogrammetric Engineering and Remote Sensing, 60(10): 1253-1257. https://doi.org/10.1002/ppp.3430050408
[28] Harris, J.R., Murray, R., Hirose, T. (1990). IHS transform for the integration of radar imagery and other remotely sensed data. Photogrammetric Engineering and Remote Sensing, 56(12): 1631-1641.
[29] Dejhan, K., Wisetphanichkij, S., Kerdyou, P. (2000). Flooded Area Assessment with Fused Multi-spectral Multi-sensor by Using Texture Feature Analysis and Neural Network Classification. In 21st Asian Conference on Remote Sensing, Taipei, Taiwan.