Recep Sinan Arslan![]() | Hasan Ulutas
| Hasan Ulutas![]() | Ahmet Sertol Köksal
| Ahmet Sertol Köksal![]() | Mehmet Bakır*
| Mehmet Bakır*![]() | Bülent Çiftçi
| Bülent Çiftçi![]()
© 2023 IIETA. This article is published by IIETA and is licensed under the CC BY 4.0 license (http://creativecommons.org/licenses/by/4.0/).
OPEN ACCESS
Background: Sleep disorders pose significant health risks, necessitating accurate diagnostics. The analysis of polysomnographic data and subsequent sleep stage classification by medical professionals are crucial in diagnosing these disorders. The application of artificial intelligence (AI)-based systems for automated sleep stage classification has gained significant momentum recently. Methodology: In this study, we introduce a machine learning model designed for high-accuracy, automated sleep stage classification. We utilized a dataset consisting of polysomnographic data from 50 individuals, obtained from the Yozgat Bozok University Sleep Center. A variety of classifiers, including Extra Tree, Decision Tree, Random Forest, Ada Boost, and Gradient Boost, were tested. Sleep stages were classified into three categories: Wakefulness (WK), Rapid Eye Movement (REM), and Non-Rapid Eye Movement (N-REM). Results: The overall classification accuracies were 95.4%, 95%, and 92% for three distinct classifiers, respectively, with the highest accuracy reaching 98.8%. Comparison with Existing Methods: This study distinguishes itself from comparable sleep stage-scoring research by utilizing a unique dataset, and by incorporating data from 16 channels, which contributes to the achieved accuracy. Conclusion: The machine learning model trained with a unique dataset demonstrated high classification success in the automated scoring of sleep stages. This research underscores the potential of machine learning techniques in improving sleep disorder diagnostics.
sleep stage scoring, machine learning, polysomnography (PSG), multi-channel data
Obstructive sleep apnea (OSA) is a condition characterized by recurrent or partial breathing obstructions that disrupt sleep architecture [1]. Worldwide, an estimated 1 billion people are affected by OSA [2]. The associated consequences, including sleep fragmentation, daytime sleepiness, and diminished psychomotor vigilance, are primarily due to the arousals triggered by breathing obstructions [3]. Hence, the analysis and understanding of sleep functions offer valuable insights into personal health. A proposed method for assessing the relationship between OSA and fragmented sleep is the performance of survival analysis on the durations of continuous sleep, with subjects grouped by OSA severity category [4].
The gold standard for sleep apnea diagnosis is full-night polysomnography (PSG), conducted in a sleep laboratory [5]. PSG involves the collection of various physiological signals from more than ten channels using different sensors such as electroencephalogram (EEG), electrooculogram (EOG), electromyogram (EMG), and electrocardiogram (ECG), thereby enabling researchers to achieve accurate results [6]. However, PSG is often uncomfortable, expensive, and not easily accessible [7]. Additionally, the analysis and sleep stage scoring processes involved are time-consuming [8]. Sleep stage scoring, a critical process for apnea detection, is prone to errors, and there is a scarcity of professionals capable of diagnosing sleep apnea in medical facilities [9, 10], leading to long waiting times [11].
Sleep stages are typically divided into Rapid Eye Movement (REM) and Non-Rapid Eye Movement (NREM), with NREM further subdivided into stages 1, 2, and 3 according to the guidelines of the American Academy of Sleep Medicine (AASM) [12]. The Rechtschaffen and Kales method proposes an alternative classification that includes four NREM stages [13]. It is important to note that sleep stages are not only brain-focused; effects of the autonomous nervous system (ANS) are also a significant factor [14, 15]. For instance, the activity of the sympathetic nervous system (SNS) is decreased during NREM sleep, with phasic bursts of SNS activity occurring during REM sleep [16].
Changes in ANS activity cause hemodynamic changes during sleep [17]. During NREM sleep, both mean arterial pressure and cardiac output are reduced. In contrast, increases in arterial pressure and heart rate are observed during REM sleep [18]. Sleep apnea may occur during any sleep stage, but it is dominant during REM sleep due to further relaxation of the upper airway muscles [19]. Thus, a three-stage classification consisting of Wake, REM, and NREM stages can be employed for apnea detection and scoring.
Considerable research has been conducted on the development of automatic algorithms for sleep apnea detection and sleep stage scoring based on various physiological signals [20-22]. Conventional machine learning algorithms were among the first automatic algorithms used for apnea detection. However, due to the limited feature extraction capability and the need to solve complex physiological signals, researchers have started focusing on more complex deep learning models [23, 24].
Conventional machine learning methods generally involve three main steps: feature extraction, feature selection, and classification. The performance of these machine learning algorithms can be significantly boosted by the feature engineering process, and various classification algorithms have been developed. These include Linear Discriminant Analysis (LDA), Quadratic Discriminant Analysis (QDA), Logistic Regression (LR), Support Vector Machines (SVM), K-Nearest Neighborhood (KNN), Decision Tree (DT), Random Forest (RF), Extra Tree (ET), and Gradient Boosting (GB) [25].
For instance, Liang et al. [26] proposed the use of multiscale entropy as a signal feature, while Hassan and Subasi [27] dealt with a signal that needed to be decomposed into several sub-bands. Jiang et al. [28] approached sleep stage classification in three steps: feature extraction, random forest classification, and result refinement using a hidden Markov model.
In deep learning models, feature extraction is automatically performed by a deep neural network model, enabling end-to-end automated sleep stage classification [29]. Deep learning-based methods employ convolutional neural networks (CNN) [30], recurrent neural networks (RNN), or a combination of both. For instance, Andreotti et al. [31] employed a modified ResNet with 34 layers for automatic sleep stage classification, while Michielli et al. [32] used a two-level long short-term memory (LSTM) structure for classifying EEG signals.
The accuracy of sleep staging methodologies in current state-of-the-art research ranges from 62% to 99%. However, it should be noted that some of the higher accuracy values were obtained in apnea detection or wake-sleep detection. Moreover, some studies use only EEG or EOG input for automatic sleep stage scoring [33]. Another factor that affects the accuracy rate is the use of different datasets released by various hospitals orresearch institutions. When comparing the performance of different models, it is important to consider the complexity of the input data and the specific tasks that the model is designed to perform.
For example, in a study by Arslan et al. [34], a deep learning model was trained on 8,000 patients suffering from various sleep disorders, and the model achieved an accuracy of 72% in five-class sleep stage scoring. Shahin et al. [35] used a 1D CNN to classify sleep stages based on single-channel EEG data, achieving an accuracy of 74%. Li et al. [36] achieved an accuracy of 79% in five-class sleep stage scoring using a deep bidirectional LSTM (BiLSTM).
Despite the significant progress in the field, there are still a number of challenges and limitations associated with current sleep stage scoring methodologies. These include the lack of standardization in scoring methods and the need for large amounts of training data for deep learning models. In addition, the performance of these models often depends on the quality and length of the sleep data, which can vary greatly among individuals. Furthermore, these models are often complex and require significant computational resources, which can be a barrier to their widespread use in clinical settings.
In conclusion, the automatic detection and scoring of sleep stages is a complex task that requires the analysis of various physiological signals. While significant progress has been made in the development of machine learning and deep learning models for this task, there are still many challenges to be addressed. Future research should focus on improving the accuracy and robustness of these models, as well as developing methods that are more efficient and easier to implement in clinical settings.
In this part of the manuscript performance of the proposed manuscript compared with similar studies up to date by using number of classes (Wake (W), rapid eye movement (REM), non-rapid eye movement (NREM)), PSG device input type and dataset type. The proposed work offers many advantages such as having its own database, using multi-channel inputs, and having high accuracy. Table 1 summarizes a list of comparisons between the proposed work and recent similar works. To explain the presented works importance following works chosen which employs different inputs and different techniques to show the literature gap.
Shahin et al. [35] realized a deep learning approach by using single and two EEG inputs on their own dataset to classify sleep stages. When compared with manual assessments, an NREM+REM based classifier had an overall discrimination accuracy of 92% and 86% between two groups using both two and one EEG channels, respectively in 2017. This study also proves that the accuracy has a directly relation with channel input numbers. Li et al. [36] classifies three sleep stages (Wake-REM-NREM) from a single lead ECG using beat detection, cardiorespiratory coupling in the time frequency domain and deep convolutional network (CNN). Their obtained accuracy was 85.1% when application was verified on MIT-BIH PSG database. DNN was used for the classification of the sleep stages into W, REM and NREM sleep stages by Wei et al. [37] in 2018. They applied the sleep stage stacked autoencoder to constitute a 4-layer DNN model. To test the accuracy of their method, eighteen PSGs from the MIT-BIH Polysomnographic Database were used. They obtained an accuracy of 77% and a Cohen’s kappa coefficient of about 0.56 for the classification of W, REM, NREM. Another deep learning-based sleep stage classification work made by Chambon et al. [38] in 2018. They employed 6 EEG, 2 EOG and 3 EMG channels of publicly available MASS dataset. Their accuracy for five sleep stage classification was around 87%.
Malafeev et al. [39] developed machine learning algorithms for sleep classification: random forest (RF) classification based on features and artificial neural networks (ANNs) working both with features and raw data. They tested their methods and achieved accuracy of 90% when on 5 stage classifiers. Zhao et al. [40] employs SVM for classification of sleep stages on EDF dataset by using EEG input. Their accuracy is 85.93% when this technique was applied to EDF database in 2019. A flexible deep learning model is proposed using raw PSG signals by Yildirim et al. [41]. A one-dimensional convolutional neural network (1D-CNN) is developed using electroencephalogram (EEG) and electrooculogram (EOG) signals for the classification of sleep stages. The performance of the system is evaluated using two public databases (sleep-edf and sleep-edfx). The developed model yielded the highest accuracies of 98.06% and 94.64 for 2 and 3 classes, respectively. Ravan and Begnaud [42] used quantitative features obtained from electroencephalography in 2019 for awake-Ligth sleep+REM-deep sleep classification. They first developed a new automatic sleep-staging framework that consists of a multi-class support vector machine (SVM) classification, based on a decision tree approach. To train and evaluate the performance of the framework, they used polysomnographic data of 23 healthy subjects from the PhysioBank database where the sleep stages have been visually annotated. After that, they used the trained classifier to label the sleep stages using data from 22 patients. Their overall accuracy is 90% at the related study when PZ-Oz channel was employed. Jeon et al. [43] proposed a novel end-to-end classifier based on a multi-domain hybrid neural network (HNNmulti) approach consisting of a convolutional neural network and bidirectional long short-term memory for automatic sleep staging with pediatric scalp EEG recordings in 2019. Their HNN-based classifier yielded the best performance metrics using 30-s time series in combination with an instantaneous frequency using a 19-channel, three-stage classification with overall accuracy, F1 score, and Cohen's Kappa, equal to 92.21%, 90%, and 88%, respectively. Huang et al. [44] proposed a multi-channel signal adding method for sleep staging in 2020. Overall performance was obtained while using the proposed method, and in six-state sleep staging. The highest overall classification accuracy of 96.53% was obtained based on the superposition of two EEG signals. Chriskos et al. [45] realized a study for automatic sleep staging by employing CNN and cortical Connectivity images. When they apply Synthetic Minority Oversampling Technique (SMOTE) technique for the classification REM-NREM stages, they obtained an accuracy of 99.85%. Santaji and Desai [46] proposed an efficient technique for sleep stage classification based on Electroencephalogram (EEG) signals analysis using machine learning algorithms by considering 10 seconds of EEG epochs. EEG signals were filtered and decomposed into frequency sub-bands using band-pass filter. Statistical features are extracted and trained with Decision Tree, Support Vector Machine and Random Forest algorithms with different testing dataset percentage. Results show Random Forest algorithm achieves 97.8% of accuracy for NREM-REM classification.
Zhang et al. [47] collected data from 294 studies and developed a model by using DNN to obtain higher accuracy. Their accuracy value is 96.02% in binary classification (as N1 and N2, W and REM ETC). However, the overall classification accuracy decreases to 83% in 5 classes classification. Satapathy et al. [48] proposed a study aims to develop a new automated sleep staging system using the brain EEG signals. Based on a new automated sleep staging system based on an ensemble learning stacking model that integrates Random Forest (RF) and eXtreme Gradient Boosting (XGBoosting). Their model achieved an accuracy of 91.10% in S-EDF dataset. Grieger et al. [49] proposed a classification system based on a simple neural network architecture that scores the classical stages as well as pre-REM sleep in mice. Their accuracy for NREM, W, REM was 97%. Satapathy and Loganathan [50] proposed automated sleep staging system followed four basic stages: signal preprocessing, feature extraction and screening, classification algorithms, and performance evaluation. In that work, a new method is applied for signal preprocessing, feature screening and classification models. With that proposed model they obtained an accuracy of 99.34% on SG-I dataset for 5 stage classification. Another high accuracy work done by Satapathy and Loganathan [51]. That work develops an Automated Sleep Staging System based on Two-Layer Heterogeneous Ensemble Learning Stacking Model (ASSS-TL-HELSM) for sleep staging. Their model has maximum accuracy of 99.02% in SG-I dataset if 3 substage (W-REM-NREM) and feature selection were applied. Arslan et al. [34] proposed a 5-class model for automatic scoring of sleep stages. Classification was made using 19 sensors and as a result, 95.36% accuracy value was obtained for Extra Tree.
Abdollahpour et al. [52] proposes a new method for fusing two sources of information, electroencephalogram (EEG) and electrooculogram (EOG), to achieve promising results in the classification of sleep stages. The proposed method employs transfer learning at the training stage of the model to accelerate the training process of the CNN and to improve the performance of the model. The proposed algorithm was used to classify the sleep-EDF and sleep-EDFX benchmark datasets. The algorithm could classify the Sleep-EDF dataset with an accuracy of 93.58% and Cohen’s kappa coefficient of 0.899. The results show that the proposed method can achieve superior performance compared with state-of-the-art studies on the classification of sleep stages. Furthermore, it can provide reliable results as an alternative to conventional sleep staging.
Fraiwan and Alkhodari [53] examines the application of a long-short-term memory (LSTM) learning system for the purpose of automatic sleep stage scoring in neonates. The research employed a dataset of 5095 sleep stage signals that were obtained from electroencephalogram (EEG) recordings conducted at the University of Pittsburgh. The Pediatric Neurology Department of Case Western Reserve University enlisted the expertise of a medical doctor to annotate the sleep stages of neonates. Specifically, the doctor identified three distinct sleep stages-awake (W), active sleep (AS), and quiet sleep (QS)-in 60-second epochs. The signals underwent pre-processing procedures, including normalization and filtering. The signals obtained were partitioned into four-fold, six-fold, and 10-fold cross-validation schemes. The bidirectional LSTM network classifier, which has been constructed with predetermined training parameters, is used to execute the training and classification procedures. The algorithm that was formulated underwent an evaluation process, which was accompanied by a comprehensive summary table that presents the findings of this investigation as well as those of other contemporary research endeavors. The present investigation attained notable levels of Cohen's kappa (κ), accuracy, and F1 score, specifically 91.37%, 96.81%, and 94.43%, respectively. The confusion matrix indicates that the true-positive percentage achieved an overall value of 95.21%. The algorithm that was developed demonstrated favorable outcomes in the context of automated scoring of neonatal sleep signals for sleep stage identification. Subsequent research endeavors will entail enhancements to the classifier’s overall accuracy through the utilization of LSTM architecture and improvements to the training parameters .
Eldele et al. [54] introduces a new deep learning framework named AttnSleep, which employs attention mechanisms for the classification of sleep stages based on EEG signals obtained from a single channel. The architectural design comprises three primary components, namely feature extraction, temporal context encoder, and classification. The module for feature extraction relies on a convolutional neural network (CNN) that operates at multiple resolutions, known as the multi-resolution CNN (MRCNN). Additionally, the module employs adaptive feature recalibration (AFR) to enhance the quality of the extracted features. This approach allows for the extraction of both low-and high-frequency features and models the interdependencies between them, resulting in improved feature quality. The Temporal Context Encoder (TCE) utilizes a multi-head attention mechanism to effectively capture temporal dependencies within the extracted features. The module responsible for categorizing sleep stages employs a fully connected layer for classification purposes. The AttnSleep model, as proposed, exhibits superior performance compared to contemporary techniques, as evidenced by various evaluation metrics.
The paper proposes an efficient technique for sleep stage classification based on Electroencephalogram (EEG) signals analysis using machine learning algorithms by considering 10 s of epochs. The EEG signals are filtered and decomposed into frequency sub-bands using a band-pass filter. Statistical features are extracted and trained with Decision Tree, Support Vector Machine and Random Forest algorithms with different testing dataset percentage. Results show that the Random Forest algorithm achieves 97.8% of accuracy. The paper also mentions that PSD and ERP are well-established methods for analyzing EEG signals to classify sleep stages. In this study, PSD and ERP plots are derived using EEGLAB, which is a graphical user interface that permits users to intuitively process the data for better sleep stage classification [55].
Liu et al. [56] examines the use of polysomnography as a preeminent method for detecting sleep stages, and underscores inconsistencies in the application of these criteria by technicians. The present research suggests the implementation of an artificial intelligence (AI) system to effectively assess the dependability and uniformity of sleep scoring, and consequently, the quality of sleep centers. This was achieved through the use of an interpretable machine learning algorithm to evaluate the interrater reliability (IRR) of sleep stage annotation among sleep centers. A study was conducted on 679 patients without sleep apnea from six sleep centers in Taiwan to perform intra center and inter center assessments. Centers that may have quality issues were identified using the estimated internal rate of return (IRR). Intra center assessment revealed that the median accuracy varied between 80.3% and 83.3%, apart from a single hospital, which demonstrated an accuracy of 72.3%. During the inter-center assessment, the median accuracy varied between 75.7% and 83.3% when a single hospital was omitted from both the testing and training phases.
Haghayegh et al. [57] presents a novel deep learning algorithm that integrates Proportional Integrating Measure (PIM) and zero-crossing mode (ZCM) data to estimate sleep parameters through wrist actigraphy. The research entailed the acquisition of ZCM, PIM, and electroencephalographic (EEG) data from a sample of 40 individuals who were in good health. The algorithm under consideration demonstrated a noteworthy improvement in specificity compared to the existing algorithm while exhibiting a slight reduction in sensitivity for individuals suffering from sleep disorders. The inconspicuous evaluation of circadian rhythms is especially pertinent for individuals with neuropsychiatric disorders linked to sleep disruptions, such as major depressive disorder or cognitive decline. The manuscript additionally examines approaches to mitigate the issue of incomplete data through the optimization of DHT deployment and the incorporation of patient viewpoints in the research framework. Furthermore, this manuscript presents a methodological guide for establishing studies on daily life, with a specific emphasis on evaluating salivary cortisol levels. A polysomnography (PSG) study was conducted on a sample of 11 male and 9 female individuals in order to assess potential neuropsychiatric sleep disorders. Concurrently, wrist actigraphy was documented, whereby 37 characteristics were calculated for every 1-minute interval. The study involved a comparison of the prediction of PSG-derived sleep-wake states for each feature using our newly developed algorithm and four state-of-the-art algorithms. The performance of the algorithms was assessed through the use of leave-one-subject-out cross-validation. The recently developed algorithm demonstrated an accuracy of 84.9% in identifying sleep epochs and 74.2% in identifying wake epochs, resulting in an overall sleep-wake scoring accuracy of 79.0%.
Peker offers a concise survey of the literature pertaining to the categorization of sleep phases. The text delves into a comparative analysis of the proposed and current methodologies while referencing the novel contributions of the proposed approach. The present study introduces a novel approach to automatic sleep scoring utilizing single-channel electroencephalography (EEG) signals. This approach is a hybrid machine-learning method that incorporates complex-valued nonlinear features (CVNF) and a complex-valued neural network (CVANN). The nomenclature assigned to the proposed technique is CVNF CVANN. The method under consideration demonstrated accuracy rates of 91.57% and 93.84% in accordance with the R&K and AASM standards, respectively. These results suggest that the method has the potential to be effective in the context of sleep scoring. The present study introduces a facial video database and its corresponding acquisition process, comprising 31,500 video clips featuring 100 distinct individuals hailing from 20 different countries [58].
As briefly given here and other review studies [59, 60] our works differentiated from related works by having own dataset and applying all channels as input. Since sleep experts uses all PSG channels during sleep stage scoring, we wanted to all PSG channels of the device as input which leads to 5 million data for every patient which is occupied from 800 epochs of 30 seconds approximately. For increasing reliability, sleep data had been used which means 250 million records. Machine learning algorithms applied and obtained results presented in detail. The maximum accuracy obtained as 98.8% when machine learning algorithms applied in this work. Although obtained accuracy is lower than the ones that uses publicly available dataset with single or dual channel data, we claim that the proposed work will give an idea to the researcher who want to make similar studies by using own dataset with all PSG inputs. In order to explain the literature gap, Table 1 is prepared by giving classes, PSG inputs, dataset and size, engineering techniques and accuracy tabs as below. The proposed work differs from related works by using own dataset and applying discrete signal pre-processing and processing on it to achieve recognize the sleep stage with nearly 100% accuracy. When we look at the current state of the art, similar works employs EEG, ECG, or whole PSG inputs to differentiate the sleep stages generally by using DNN, machine learning or CNN methods on publicly available datasets. This work is motivated by that literature gap. Another point of literature gap which can be seen in the Table 1, the number of individuals in approximately half of the databases used in similar studies is less or the same amount than the number of individuals in ours. In studies [50, 51], were conducted on 3 groups and the number of individuals in two of them was less than 50. The number of individuals in the two references is around 60, not much different from 50. As a result, it is seen that the almost 70% of similar works have similar number individuals as in this work individuals in the databases used in 70% of similar studies is similar to that in our database.
A summary table of the studies on the subject is presented in Appendix A.
In this study, which aims to score sleep stages automatically, a model is proposed that includes collecting data from subjects during sleep and evaluating them by experts, preprocessing these data, testing them with appropriate machine learning techniques, predicting the sleep stage classes, and finally validating the results. The steps followed in the creation of the model are shown in Figure 1.
Figure 1. Flow-chart of sleep stage scoring model
3.1 Data collection and evaluation by experts
The first step of this study was the collection of data. Data collected from 50 subjects who applied to Yozgat Bozok University Sleep Center were used in this study after the approval of the ethics committee. Analogue signals such as EEG, EOG, EMG, ECG obtained from the sensors attached to the bodies of the subjects constitute the raw data used in this study. The raw data were evaluated by well-trained sleep specialists in our study team, and sleep stages were scored as 5 different classes.
Figure 2. Example of an evaluation screen
The signals that make up the raw data are divided into 30-second time periods, defined as 1-epoch according to AASM standards, and each of the 800 epochs recorded during a night’s sleep lasting 6-8 hours is classified by the expert. The expert evaluates all the collected signals together, as seen in the example of an evaluation screen illustrated in Figure 2. In this proposed model, when all data are taken into account, the fact that the closest prediction to the expert opinion can be obtained.
3.2 Pre-processing of data and feature selection
The data collected by the sensors of the PSG device is converted into discrete signals with Compumedics [61] software, which is widely used in this field. Although the PSG device has 27 channels, only 19 channels were studied in this study. Because while these 19 channel inputs are common in every dataset, the inputs of other channels are rarely measured and are not found in some datasets. We found that some channels among 19 channels had a negative effect on classification. In order to observe this effect, we performed sample tests for 5 different classifiers and the results were as shown in Figure 3. As can be seen in the graph that the effects of the data coming from the CFlow, LEG1 and LEG2 channels on the classification are quite low. For this reason, 16 channels were selected from 19 channels and used for classification. In addition, the effect of different feature numbers on the classification was measured for the RF classifier and the results are given in Appendix C. Accordingly, no positive performance increase was observed in classification after 16 features.
Figure 3. Feature importance graph for different classifiers
It could be useful to explain feature numeric equalization, score conversion, combining features and feature selection for fully understanding the method. First, Feature Numeric Equalization: A significant challenge was encountered in the dataset because of the different sampling frequencies of the sensors, which resulted in different sample sizes for each channel. A numerical equalization step was introduced to maintain uniformity and compatibility. In this step, the sample size across three groups (1Hz, 100Hz, and 200Hz) was normalized. For the 1Hz and 100Hz groups, the samples were increased by coefficients of 200 and 2, respectively. This approach allowed a consistent sample size to be maintained across all channels, a factor that was critical for feeding the data into the machine-learning model. Secondly, Score Conversion: After the data were pre-processed and transformed, sleep stage scores were assigned based on American Academy of Sleep Medicine (AASM) standards. The dataset was labelled by well-trained sleep specialists according to these standards, with each 30-second epoch classified as N1, N2, N3, REM, or WAKE. However, to simplify the model, the N1, N2, and N3 stages were combined under the umbrella term ‘NREM’. Thus, the scoring classification included three categories: NREM, REM, and WAKE. Thirdly, Combining Features: In the feature combination stage, the 16-channel data for each epoch were merged, resulting in each epoch containing a 16-dimensional feature vector. Each feature represented data from a different channel, and each channel provided unique information relevant to sleep-stage classification. Finally, Feature Selection: The original data were collected from 27 channels of the PSG device. An initial focus was placed on 19 of these channels, which were commonly available in every dataset. However, through preliminary testing with five different classifiers, it was found that data from three of these channels (CFlow, LEG1, and LEG2) had minimal impact on the classification results. As a result, 16 channels from the initial 19 were selected for the final model to optimize computational efficiency and model performance.
There are three different sampling frequencies, 1Hz, 100Hz and 200Hz, in digitizing the data of these remaining 16 channels. This is due to differences in sensor types and measured biomedical signal properties. As shown in Table 1, the sampling frequencies used to depend on the sensor type can be listed under three distinct groups. Sampling data at different frequencies means that each epoch will have a different number of samples coming from different channels.
Table 1. Sampling frequencies depending on the sensor type
|
Group |
Sampling Frequency |
Sensor Type |
|
1 |
1Hz |
1-channel Body Position 1-channel SPO2 |
|
2 |
100Hz |
2-channel Chest Effort 1-channel Thermistor |
|
3 |
200Hz |
1-channel Chin EMG 1-channel EKG-ECG 2-channel Eye 7-channel EEG |
Table 2. Number of samples produced per group in a 30 second epoch
|
Group |
Frequency |
Number of Samples |
|
1 |
1 Hz |
30 |
|
2 |
100 Hz |
3000 |
|
3 |
200 Hz |
6000 |
Table 3. Sample numbers obtained at the end of the pre-processing process
|
Group |
1 |
2 |
3 |
|
Frequency |
1Hz |
100Hz |
200Hz |
|
Coefficient |
200 |
2 |
1 |
|
Samples per Epoch |
30 |
3000 |
6000 |
|
Samples Obtained per Epoch |
6000 |
6000 |
6000 |
|
Samples Obtained for 800 Epochs |
4.8 million |
4.8 million |
4.8 million |
As shown in Table 2, in 1-epoch, because of sampling the data in the 1Hz, 100Hz and 200Hz frequency group, there will be 30, 3000 and 6000 samples, respectively. One of the significantly several aspects of this study is the use of all 16-channel data. However, since each of the 16 channels does not have the same sample size, as such, it is impossible to use all channels in a single machine-learning model. To eliminate this situation and keep the sample size equal for each channel, we increased the samples in groups 1 and 2 by multiplying them by the coefficients of 200 and 2, respectively. Thus, the sample numbers obtained for each channel were equalized, as shown in Table 3.
As a result of pre-processing the data in this way, a dataset of 800 epochs will contain a feature vector of size 4.8 million ×16. Although the pre-processing of data of this size is quite laborious, it is especially important in terms of creating the unique aspect of this study. It also allows all 16 channels to be used in a machine-learning model, in a way not used in previous studies.
3.3 Classifier selection and hyper-parameter tuning
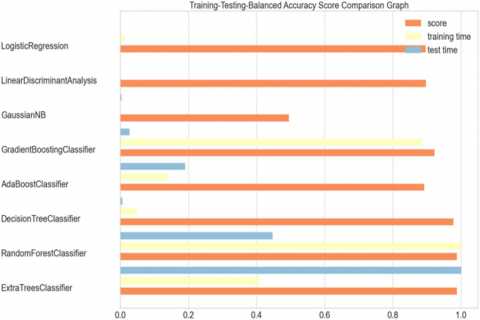
Appropriate machine learning classifiers should be used with appropriate hyper-parameters so that sleep stage classes can be predicted with the highest accuracy. In this study, first, various classifiers were tested with default parameters. As a result of these tests, the accuracy values, training, and test times obtained for each classifier were as shown in Figure 4. Accordingly, the classifiers with the highest accuracy were Extra Tree, Random Forest, and Decision Tree. In terms of training and testing time, Extra Tree and Random Forest need more time. For this reason, it has been seen that the most balanced classifier between Accuracy and training and test times is Decision Tree. However, the tests were repeated in all patients for the 3 most successful classifiers and comparative results are shown in section.
Figure 4. Comparison of different classifiers according to accuracy, training, and testing time
Apart from 8 classifiers, the tests we performed with Logistic Regression and Support Vector Machine were not used in this study since the training process did not complete within 24 hours. Because our main goal in this study is to achieve reasonable training and testing times with high scoring ability.
In order to further increase the performance for the 3 most successful classifiers, hyper parameter optimization was performed with GridSearchCV and the parameters with the highest performance were selected for each, and these values were as shown in Table 4.
Table 4. Selected parameters for each classifier
|
Algorithm |
Selected Parameters |
|
Random Forest Classifier |
‘n_estimators’: 400, ‘min_samples_split’: 10, ‘min_samples_leaf’: 4, ‘max_features’: ‘auto’, ‘max_depth’: 70, ‘bootstrap’: True |
|
Extra Trees Classifier |
‘n_estimators’: 100, ‘min_samples_split’: 20, ‘min_samples_leaf’: 20, ‘max_features’: 250 |
|
Decision Tree Classifier |
‘criterion’: ‘gini’, ‘max_depth’: 2, ‘min_samples_leaf’: 5 |
We calculated accuracy, precision, recall and f-score values to decide on the performance of the proposed model and compare it with similar studies. These four values are metrics commonly used in evaluating results. The results obtained are shown in detail in Section 4.
After the data was preprocessed, classifier and features selected, it was tested using machine learning techniques. The results are given in detail in this section and has compared each other.
4.1 Dataset
The data set was provided by Yozgat Bozok University, Department of Chest Diseases, Sleep Laboratory. The dataset consists of PSG signals collected from 50 subjects and recorded with the Philips Alice PSG device. PSG signals are collected over a night that lasts approximately 8 hours, via sensors attached to the subjects’ bodies and operating at various frequencies. In this study, the signals collected from 19 different channels are reduced to 16-channel signals by using feature selection and the dataset is created. These data are grouped into epochs, each representing a 30-second time frame, according to AASM standards. Each epoch was evaluated by well-trained sleep specialists according to AASM standards and sleep stage scored. After the recordings classified as N1, N2 and N3 by the sleep specialist are combined under the name of NREM, sleep stage scoring is performed according to three classes: NREM, REM and WAKE.
The sensors that make up the 16 different channels do not all operate at the same frequency. Therefore, data collected at different frequencies is appropriately organized during data preprocessing, as explained in Section 3.2. According to this arrangement, an epoch consists of 6000 records, each containing data from 16 different channels. There are approximately 800 epochs in the dataset created for a subject. This means that there is 800×6000×16 values in a subject’s dataset. Although these values vary from subject to subject, they are approximately 75 million. The number of records (rows) in the dataset of 50 different subjects according to sleep stage classes are shown in Appendix B. In this study, sleep stage classification was performed on a row basis, not on an epoch basis. So, each of the approximately 800×6000=4.8 million rows are classified using approximately 75 million data in the calculations.
Number of records (rows) in the subjects’ dataset according to different sleep stages is given in Appendix B.
4.2 Performance metrics
In this study, automatic scoring of sleep stages is done per recording. Thus, it is aimed to evaluate the sleep quality and sleep disorders of the subjects. The evaluation metrics of per-record scoring, accuracy (acc), recall, precision (prec), and f1-score, are defined as follows:
Accuracy $=\frac{(T P+T N)}{(T P+T N+F P+F N)}$ (1)
Recall $=\frac{T P}{(T P+F N)}$ (2)
Precision $=\frac{T P}{(T P+F P)}$ (3)
$F 1-$ score $=2 \times \frac{(\text { Recall } \times \text { Precision })}{(\text { Recall }+ \text { Precision })}$ (4)
4.3 Experimental environment
All experiments were performed on a computing server equipped with 2 x Intel(R) Xeon(R) Silver 4114 CPU @ 2.20 GHz and 192.0 GByte random access memory. The server uses a system running Windows 10 Pro for workstations. The results were obtained using the Python v3.9.5 programming language and its libraries sklearn, pandas, numpy, seaborn, matplotlib and imblearn. The environment is particularly important in calculations regarding training and test times.
4.4 Testing results with all classifiers
In this study, it was aimed to achieve higher performance in scoring sleep apnea. For this purpose, the results obtained with 11 classifiers were as given in Table 5. Accordingly, it has been determined that tree-based models, RF, DT and ET, are suitable for this classification.
Table 5. Classification results with different algorithms
|
Average |
||||
|
Classifier |
Accuracy (%) |
Precision (%) |
Recall (%) |
F1-Score (%) |
|
Logistic Regression |
89.7 |
86.4 |
89.7 |
85.3 |
|
Random Forest |
98.8 |
98.8 |
98.8 |
98.8 |
|
Extra Tree |
98.8 |
98.8 |
98.8 |
98.8 |
|
GNB |
31.4 |
80.7 |
31.4 |
41.6 |
|
LDA |
89.7 |
85.8 |
89.7 |
85.9 |
|
DT |
97.8 |
97.8 |
97.8 |
97.8 |
|
ADA |
89.1 |
87.1 |
89.1 |
87.8 |
|
GB |
92.2 |
91.4 |
92.2 |
91.0 |
|
XGB |
95.5 |
95.2 |
95.5 |
95.2 |
|
KNN |
96.5 |
96.3 |
96.5 |
96.3 |
The results for sleep stage estimations using the Extra Tree, Random Forest, and Decision Tree classifiers for each of the 50 subjects are shown in Figure 5. According to these results, it is observed that the Extra Tree and Random Forest classifiers have the same performance, while the Decision Tree classifier has slightly less performance. Accuracy values are 0.950, 0.954, and 0.92 for the Extra Tree, Random Forest, and Decision Tree classifiers, respectively. Precision, Recall and F-Score values also show parallelism with Accuracy values. These results are the calculated mean values for 50 subjects. Detailed results for each classifier for all subjects are given in Appendix D. When the subjects are analyzed separately, it is seen that the Accuracy value is between 0.925 and 0.988 for Extra Tree, between 0.930 and 0.988 for Random Forest, and between 0.881 and 0.978 for Decision Tree. These results prove that the proposed model using 16 different channel data is significantly successful in solving the classification problem. Figure 6 shows the confusion matrix for the dataset where the highest classification performance is obtained with an accuracy of 0.988. As seen in the matrix, it is understood that approximately the same success can be achieved for all classes. It is also seen from the matrix that remarkably high True Positive values are obtained for all classes. This indicates that NREM, REM and WAKE sleep stages can be successfully scored with the proposed model.
In cases where the data between classes is balanced, the performance of the model obtained can be shown with the ROC curve. However, ROC curves produce optimistic results when class distributions deviate. Precision-recall curves are an alternative to ROC curves because there are differences in class distributions. In the dataset used in this study, as can be seen in Appendix B, sample imbalance between sleep stages is high. For this reason, in Figures 6-8, class-based precision-recall curves taken separately for each of the 3 classifiers are given. As can be seen in all of the curves, the area value is very close to 1.0. This suggests that the proposed provides both high precision and high recall. It proves that a complete representation of an ideal classifier is used in this work.
Figure 5. Accuracy, precision, recall and f1-measure of obtained results on extra tree (a) random forest (b) decision tree (c) classifiers
Figure 6. Precision-recall curve of DT
Figure 7. Precision-recall curve of ET
Table 6. Stratified 10-fold cross validation of tree-based models
|
Stratified K Fold Cross Validation (k=10) (Multiclass) |
||||||
|
Balanced Accuracy |
F1_Weighted |
|||||
|
(TrainSet:4098600, TestSet:455400) |
ET |
DT |
RF |
ET |
DT |
RF |
|
Fold1 |
0.99 |
0.98 |
0.99 |
0.99 |
0.98 |
0.99 |
|
Fold2 |
0.99 |
0.98 |
0.99 |
0.99 |
0.98 |
0.99 |
|
Fold3 |
0.99 |
0.98 |
0.99 |
0.99 |
0.98 |
0.99 |
|
Fold4 |
0.99 |
0.98 |
0.99 |
0.99 |
0.98 |
0.99 |
|
Fold5 |
0.99 |
0.98 |
0.99 |
0.99 |
0.98 |
0.99 |
|
Fold6 |
0.99 |
0.98 |
0.99 |
0.99 |
0.98 |
0.99 |
|
Fold7 |
0.99 |
0.98 |
0.99 |
0.99 |
0.98 |
0.99 |
|
Fold8 |
0.99 |
0.98 |
0.99 |
0.99 |
0.98 |
0.99 |
|
Fold9 |
0.99 |
0.98 |
0.99 |
0.99 |
0.98 |
0.99 |
|
Fold10 |
0.99 |
0.98 |
0.99 |
0.99 |
0.98 |
0.99 |
|
Average |
0.99 |
0.98 |
0.99 |
0.99 |
0.98 |
0.99 |
The performance of the proposed model in this study is expressed with different metrics and measurements. However, cross-validation is needed to show that the results obtained show the same success in each random selection. Thus, it is possible to make a less biased evaluation for the proposed model. In order to make this objective comparison, Balanced accuracy and f1 weighted values were measured for 3 different tree-bases classifiers by choosing k=10 value and presented in Table 6. As can be seen when the tests are repeated by performing 10-Fold, no notable change was observed in the results. Average classification performance remained constant for both balanced accuracy and f1 weighted value. This situation reveals that the proposed model is not affected by training and test data changes and is a robust model in producing similar results.
The final evaluation expected for the results obtained is on the FP and FN numbers of tree-based models on a class basis. Accordingly, in Figures 9-11, “confusion matrices” are given for 3 classifiers. Accordingly, the proposed model can detect the NREM class with higher performance than other classes. Proportionally the lowest performance is in the REM class. It is considered that this is due to the combination of N1, N2 and N3 classes as NREM classes. This situation revealed that FP values increased with the REM class containing different data. It was observed that all 3 tree-based models gave close values to each other.
Figure 8. Precision-recall curve of RF
Figure 9. Confusion matrix of DT
Figure 10. Confusion matrix of ET
Figure 11. Confusion matrix of RF
As a result, the feature selection proposed in this study, using hyper-parameter tuning, used tree-based classifier models to solve the 3-class sleep apnea problem with high performance. The resulting model performs well independently of class and patient and produces consistent results for this problem with an unbalanced sample number based on class.
4.5 Discussion
Three sleep stage classes occupied from NREM, REM, and WAKE has been researched and machine learning model proposed in this study. High classification success was achieved by using 16 different input channels. This performance was demonstrated on a dataset of 50 different subjects. While the highest performance was achieved with 98.8% accuracy on the basis of the subject, the overall system was found to be quite successful with an average accuracy of 95.4%. Table 7 summarizes similar studies on this subject in recent years. As can be seen in this summary table, some of the studies on this subject are different from ours in that they only score 2-class, some use only EEG or both EEG and EOG channels, and some use public databases. Among similar studies scoring on a three-class basis, only one [48], using data collected from mice, outperformed ours by 99.34%. When it comes to sleep disorders in humans, the proposed model may inspire researchers.
Although the classification success of the proposed model in this study is quite high, it also has some disadvantages. The large amount of data in the used dataset increases the classification time and requires high capacity computing devices, resulting in high processing time requirements. With the solution of this problem, the proposed model can reach widespread use. It could be useful to discuss advantages and disadvantages of the paper by briefly here. First of all, the study was enhanced by a thorough data collection procedure involving a sample size of 50 participants. The dataset has been gathered within a regulated laboratory setting using established methodologies, thereby augmenting the reliability of the data. The utilization of 16 distinct input channels facilitated a comprehensive examination of the various sleep stages through the implementation of multichannel input. The incorporation of this particular approach introduced an additional level of complexity to the investigation, which plausibly enhanced the precision of the findings, demonstrating a notable level of precision with an average accuracy of 95.4% and a maximum accuracy of 98.8%. The degree of precision demonstrated is not only noteworthy in its own right but also exhibits favorable parallels to analogous investigations, indicating that the framework exhibits considerable potential for pragmatic implementation. The research provides comprehensive and tailored perspectives for each unique participant. The degree of granularity involved in the analysis aids in comprehending the distinctions among subjects and enhances the adaptability and profundity of the analysis. The efficacy of the Random Forest classifier in producing precise outcomes highlights the adaptability and resilience of the model which can effectively process diverse PSG datasets. There are also disadvantages which can be discussed together with advantages. One notable limitation of this study is its high degree of data intensiveness, as a considerable volume of data is necessary for conducting the analysis. The potential outcome of this phenomenon is an increase in computational expenses and prolonged processing durations, thereby constraining the feasibility of the model in environments with limited computational capabilities. The use of 16 distinct channels in the study may potentially augment the intricacy of the model. Potential difficulties in interpretability and implementation of the model may arise, particularly in less controlled environments or with less sophisticated devices. The study’s findings rely on the sleep stages that were evaluated by professionals specializing in sleep scoring. The presence of any discrepancies or bias in the preliminary assessments conducted by humans may have an impact on the precision of the machine learning algorithm. The generalizability of the study is uncertain because the model’s performance on datasets with fewer channels or less controlled environments is unknown despite achieving high accuracy with its specific dataset.
Table 7. Similar studies on the sleep staging in recent years
|
Ref. |
Classes |
PSG Inputs |
Dataset |
Engineering Technique |
Accuracy |
|
[41] |
Wake- Sleep, W-REM-NREM |
EEG, EOG |
Sleep-EDF and Sleep-EDFX dataset |
Deep learning (1D CNN) |
98.06% for two stages, 94.64 for three stages |
|
[44] |
REM, NREM |
Multichannel inputs |
Sleep-EDF x database |
Feature Extraction+SVM |
96.53% |
|
[45] |
REM, NREM |
EEG |
ENVI-HAB dataset |
CNN+SMOTE deep learning |
99.85% |
|
[46] |
REM-NREM |
Multichannel EEG |
Sleep EDF dataset |
RF-SVM-DT |
97.8% |
|
[47] |
5 class and binary classification |
All channels |
Private dataset |
CNN |
83% and 96% according to the classification type |
|
[48] |
5 classes |
Dual channel EEG |
S-EDF dataset |
RF+XGBOOST |
91.10% |
|
[49] |
W-NREM-REM |
EEG |
Private dataset |
Deep learning |
97% |
|
[50] |
W-N1-N2-N3-REM |
EEG |
SG-I dataset |
Machine learning with feature selection |
99.34% |
|
[51] |
W-NREM-REM |
EEG |
SG-I dataset |
Machine learning with feature selection |
98.78% |
|
[34] |
5 classes |
Multiple channel inputs (EEG, EMG, EOG, Csnore etc.) |
Own original dataset, Individuals, 50 Individuals |
Extra Tree, Random Forest, Decision Tree |
95.28% |
|
This work |
W-REM-NREM |
All channels (16 inputs) |
Own dataset |
Machine learning |
98.8% |
In this study, data consisting of 16 different signals collected from 50 subjects who applied to Yozgat Bozok University Sleep Center were scored by well-trained sleep experts according to the 5-class AASM standard. Later, these 5 classes were combined into 3 classes and sleep stages were scored automatically with machine learning techniques. The highest classification success was obtained with the Random Forest classifier, with an average of 95.4% accuracy, precision, recall values and 92.2% f-score. In addition, the maximum accuracy, precision, recall and f-score values obtained with the same classifier were calculated as 98.8%. Unlike similar studies, this study is unique in that it uses 16-channel PSG signals and uses its own dataset. Although it has high accuracy, it requires processing substantial amounts of data, which is the limitation of this study.
Obtaining precision, recall and f-score values, which are almost the same with the Accuracy value, proves that the predictions for each class will have high accuracy. As a result, the proposed model for automatic scoring of sleep stages has high performance. Based on the encouraging outcomes derived from this investigation, various avenues for further research have been recognized that hold the potential to enhance the functionalities of the suggested model and foster the advancement of more resilient and dependable sleep-stage classification methodologies. Dataset Expansion: Our objective is to gather additional patient data, which will enhance the model’s learning potential and its capacity to generalize. This approach has the potential to enhance the accuracy of classification and optimize the efficacy of the system in practical applications. The model’s accuracy can be improved by incorporating supplementary channels, such as a mouth mask (CPAP, EPAP, and IPAP), PatFlow, TidelVol, Totleak, and Snoring (Csnore and Msnore), in forthcoming iterations. The optimization of classifiers will be further pursued by fine-tuning their hyper parameters and exploring novel classifiers to enhance their performance and precision. The implementation of strategies aimed at addressing class imbalance is expected to enhance the performance of the model, particularly in the underrepresented classes. The focus of our research will be on advanced feature engineering methods that aim to extract highly informative and representative features from multichannel data. The objective of the subsequent phase is to enhance the model’s functionalities by incorporating the identification of distinct sleep disorders, such as apnea, hypopnea, and obstructive sleep apnea. The forthcoming efforts will concentrate on enhancing the model to facilitate its implementation in clinical environments. This entails performing additional validation studies, enhancing the user interface, and incorporating the system into the current clinical workflows. The prospect of interdisciplinary collaboration is being considered as a means of promoting an integrated approach towards the development of advanced sleep scoring systems. This involves partnering with specialists in sleep medicine, data science, and software engineering. Prospective investigations will facilitate the further enhancement of the suggested framework and broaden its scope of application, thereby assisting in the prompt identification and management of sleep disorders and ultimately augmenting patient outcomes. Future works, authors of this work are planning to try and realize sleep stage scoring by using lower inputs as ECG or oxygen saturation for integrating model in a wearable equipment as watch to decrease PSG expenses of sleep centers or hospitals.
Bakır and Ulutaş developed the search strategy and conducted the literature research. Ulutaş and Köksal performed data extraction and pre-processing. Çiftçi performed manual scoring of sleep stages. Arslan et al. interpreted the evidence from a methodological and clinical point of view. Arslan supervised the execution of the study. All authors contributed to the drafting of the article and read, critically reviewed, and approved the final article.
Appendix A. Previous works for sleep stage scoring
|
Ref. |
Classes |
PSG Inputs |
Dataset & Size |
Engineering Technique |
Accuracy |
|
[35] |
NREM+REM |
EEG |
Private dataset, 41 Individuals |
Deep Learning |
92% on two channel EEG |
|
[36] |
Wake-NREM-REM |
ECG |
SLPDB dataset, 18 Individuals |
Deep Learning (CNN) |
85.1% accuracy |
|
[37] |
W, REM, NREM |
ECG |
MIT-BIH PSGdataset, 18 Individuals |
Deep learning (CNN) |
77% accuracy |
|
[38] |
W, REM, N1, N2, N3 |
6 EEG, 2 EOG, 3 EMG |
MASS dataset, 61 Individuals |
Deep learning |
87% |
|
[39] |
W, REM, N1, N2, N3 |
EEG |
MSLT dataset, 54 Individuals |
DNN |
90% around |
|
[40] |
Wake-Light Sleep, Deep Sleep, REM |
EEG |
EDF dataset, 61 Individuals |
Machine learning (SVM) |
85.93% |
|
[41] |
Wake-Sleep, W-REM-NREM |
EEG, EOG |
Sleep-EDF and Sleep-EDFX dataset, 61 Individuals |
Deep learning (1D CNN) |
98.06% for two stages, 94.64 for three stages |
|
[42] |
Awake-Ligth sleep+REM-deep sleep |
Pz-Oz |
PhysioBank, 22 Patients |
Machine Learning (SVM) |
90% accuracy |
|
[43] |
W-N1-N2 |
Two-Six variable inputs |
SNUBH Dataset, 218 Individuals |
Hybrid Neural Networks |
92.21 % |
|
[44] |
REM, NREM |
Multichannel inputs |
Sleep-EDF x database, 197 Individuals |
Feature Extraction+SVM |
96.53% |
|
[45] |
REM, NREM |
EEG |
ENVI-HAB dataset, 60 days |
CNN+SMOTE deep learning |
99.85% |
|
[46] |
REM-NREM |
Multichannel EEG |
Sleep EDF dataset, 125 Individuals |
RF-SVM-DT |
97.8% |
|
[47] |
5 and 2 classes |
All channels |
Private dataset, 294 Individuals for different purposes |
CNN |
83% and 96% according to the classification type |
|
[48] |
5 classes |
Dual channel EEG |
S-EDF dataset, 61 Individuals |
RF+XGBOOST |
91.10% |
|
[49] |
W-NREM-REM |
EEG |
Private dataset, 18 Mice 52 days |
Deep learning |
97% |
|
[50] |
W-N1-N2-N3-REM |
EEG |
SG-I dataset, 3 different groups 4 individuals |
Machine learning with feature selection |
99.34% |
|
[51] |
W-NREM-REM |
EEG |
SG-I dataset, 100 Individuals |
Machine learning with feature selection |
99.02% |
|
[34] (The first stage of this work) |
5 classes |
Multiple channel inputs (EEG, EMG, EOG, Csnore etc.) |
Own original dataset, Individuals, 50 Individuals |
ExtraTree, Random Forest, Decision Tree |
95.28% |
Appendix B. Number of records (rows) in the subjects’ dataset according to different sleep stages
|
PID |
NREM |
REM |
WAKE |
Subject No |
NREM |
REM |
WAKE |
|
1 |
3444000 |
678000 |
642000 |
26 |
2940000 |
324000 |
1140000 |
|
2 |
3558000 |
702000 |
504000 |
27 |
2460000 |
384000 |
1542000 |
|
3 |
3060000 |
600000 |
942000 |
28 |
2910000 |
162000 |
1470000 |
|
4 |
3558000 |
210000 |
792000 |
29 |
3048000 |
324000 |
1014000 |
|
5 |
3288000 |
492000 |
780000 |
30 |
3498000 |
588000 |
342000 |
|
6 |
3366000 |
564000 |
588000 |
31 |
3396000 |
456000 |
1164000 |
|
7 |
3984000 |
444000 |
204000 |
32 |
3246000 |
918000 |
480000 |
|
8 |
3258000 |
132000 |
978000 |
33 |
3342000 |
90000 |
894000 |
|
9 |
3480000 |
948000 |
120000 |
34 |
3534000 |
510000 |
426000 |
|
10 |
2766000 |
342000 |
1416000 |
35 |
2388000 |
576000 |
1410000 |
|
11 |
3714000 |
582000 |
378000 |
36 |
3450000 |
726000 |
168000 |
|
12 |
3306000 |
348000 |
750000 |
37 |
3390000 |
768000 |
498000 |
|
13 |
3420000 |
1092000 |
162000 |
38 |
3522000 |
546000 |
432000 |
|
14 |
4002000 |
366000 |
228000 |
39 |
3306000 |
738000 |
420000 |
|
15 |
3642000 |
468000 |
216000 |
40 |
3540000 |
762000 |
240000 |
|
16 |
3126000 |
156000 |
1266000 |
41 |
2898000 |
366000 |
1308000 |
|
17 |
3660000 |
504000 |
282000 |
42 |
4080000 |
168000 |
306000 |
|
18 |
3282000 |
636000 |
570000 |
43 |
3402000 |
372000 |
858000 |
|
19 |
3462000 |
366000 |
1068000 |
44 |
3324000 |
438000 |
702000 |
|
20 |
3450000 |
666000 |
462000 |
45 |
3408000 |
360000 |
576000 |
|
21 |
3270000 |
624000 |
654000 |
46 |
3276000 |
420000 |
1296000 |
|
22 |
4926000 |
486000 |
354000 |
47 |
2508000 |
414000 |
1620000 |
|
23 |
3366000 |
546000 |
840000 |
48 |
3234000 |
342000 |
822000 |
|
24 |
3780000 |
804000 |
198000 |
49 |
3582000 |
192000 |
744000 |
|
25 |
2898000 |
684000 |
894000 |
50 |
3240000 |
840000 |
564000 |
|
|
|
|
SUM |
167988000 |
25224000 |
35724000 |
Appendix C. The effect of the number of different features on the classification
|
Random Selected Patient Data and RF Classifier |
k=5 |
k=8 |
k=12 |
k=16 |
k=19 (All Features) |
|
|
UFS |
Accuracy (%) |
93.3 |
96.2 |
97.1 |
98.6 |
98.6 |
|
Precision (%) |
92.7 |
96.1 |
97.1 |
98.6 |
98.6 |
|
|
Recall (%) |
93.3 |
96.2 |
97.1 |
98.6 |
98.6 |
|
|
F-score (%) |
92.8 |
95.9 |
97.0 |
98.6 |
98.6 |
|
|
PCA |
Accuracy (%) |
91.6 |
93.0 |
95.3 |
95.6 |
98.6 |
|
Precision (%) |
90.7 |
93.0 |
95.4 |
95.8 |
98.6 |
|
|
Recall (%) |
91.6 |
93.0 |
95.3 |
95.6 |
98.6 |
|
|
F-score (%) |
89.5 |
91.4 |
95.4 |
95.1 |
98.6 |
|
|
Extra Tree with ET Classifier (Auto selected 8 features) |
Accuracy (%) |
x |
97.3 |
x |
x |
x |
|
Precision (%) |
x |
97.3 |
x |
x |
x |
|
|
Recall (%) |
x |
97.3 |
x |
x |
x |
|
|
F-score (%) |
x |
97.3 |
x |
x |
x |
|
Appendix D. List of all classification results by patient
|
Extra Trees Classifier |
Random Forest Classifier |
Decision Tree Classifier |
||||||||||
|
Patient ID |
Accuracy |
Precision |
Recall |
F1-Measure |
Accuracy |
Precision |
Recall |
F1-Measure |
Accuracy |
Precision |
Recall |
F1-Measure |
|
1 |
0.935 |
0.937 |
0.935 |
0.931 |
0.943 |
0.943 |
0.943 |
0.941 |
0.894 |
0.894 |
0.894 |
0.894 |
|
2 |
0.957 |
0.958 |
0.957 |
0.955 |
0.955 |
0.956 |
0.955 |
0.953 |
0.905 |
0.906 |
0.905 |
0.906 |
|
3 |
0.939 |
0.939 |
0.939 |
0.937 |
0.947 |
0.946 |
0.947 |
0.946 |
0.911 |
0.911 |
0.911 |
0.911 |
|
4 |
0.943 |
0.943 |
0.943 |
0.938 |
0.954 |
0.953 |
0.954 |
0.951 |
0.919 |
0.919 |
0.919 |
0.919 |
|
5 |
0.933 |
0.936 |
0.933 |
0.929 |
0.950 |
0.951 |
0.950 |
0.948 |
0.916 |
0.916 |
0.916 |
0.916 |
|
6 |
0.959 |
0.960 |
0.959 |
0.958 |
0.961 |
0.962 |
0.961 |
0.960 |
0.929 |
0.929 |
0.929 |
0.929 |
|
7 |
0.952 |
0.953 |
0.952 |
0.948 |
0.958 |
0.958 |
0.958 |
0.956 |
0.937 |
0.938 |
0.937 |
0.937 |
|
8 |
0.939 |
0.941 |
0.939 |
0.936 |
0.944 |
0.945 |
0.944 |
0.941 |
0.913 |
0.913 |
0.913 |
0.913 |
|
9 |
0.960 |
0.960 |
0.960 |
0.959 |
0.959 |
0.959 |
0.959 |
0.958 |
0.926 |
0.926 |
0.926 |
0.926 |
|
10 |
0.927 |
0.927 |
0.927 |
0.926 |
0.936 |
0.936 |
0.936 |
0.936 |
0.895 |
0.895 |
0.895 |
0.895 |
|
11 |
0.925 |
0.925 |
0.925 |
0.919 |
0.938 |
0.938 |
0.938 |
0.935 |
0.919 |
0.910 |
0.909 |
0.910 |
|
12 |
0.949 |
0.951 |
0.949 |
0.947 |
0.960 |
0.960 |
0.960 |
0.959 |
0.931 |
0.931 |
0.931 |
0.931 |
|
13 |
0.964 |
0.964 |
0.964 |
0.963 |
0.965 |
0.966 |
0.965 |
0.964 |
0.935 |
0.935 |
0.935 |
0.935 |
|
14 |
0.984 |
0.984 |
0.984 |
0.984 |
0.982 |
0.982 |
0.982 |
0.982 |
0.968 |
0.968 |
0.968 |
0.968 |
|
15 |
0.945 |
0.945 |
0.945 |
0.941 |
0.956 |
0.956 |
0.956 |
0.954 |
0.932 |
0.933 |
0.932 |
0.933 |
|
16 |
0.952 |
0.954 |
0.952 |
0.951 |
0.955 |
0.956 |
0.955 |
0.954 |
0.917 |
0.917 |
0.917 |
0.917 |
|
17 |
0.957 |
0.956 |
0.957 |
0.955 |
0.956 |
0.955 |
0.956 |
0.954 |
0.932 |
0.933 |
0.932 |
0.933 |
|
18 |
0.938 |
0.939 |
0.938 |
0.935 |
0.941 |
0.942 |
0.941 |
0.940 |
0.900 |
0.901 |
0.900 |
0.901 |
|
19 |
0.945 |
0.946 |
0.945 |
0.943 |
0.948 |
0.948 |
0.948 |
0.945 |
0.916 |
0.916 |
0.916 |
0.916 |
|
20 |
0.931 |
0.933 |
0.931 |
0.928 |
0.942 |
0.942 |
0.942 |
0.941 |
0.903 |
0.903 |
0.903 |
0.903 |
|
21 |
0.935 |
0.940 |
0.935 |
0.932 |
0.939 |
0.941 |
0.939 |
0.936 |
0.888 |
0.888 |
0.888 |
0.888 |
|
22 |
0.941 |
0.944 |
0.941 |
0.935 |
0.959 |
0.959 |
0.959 |
0.957 |
0.940 |
0.940 |
0.940 |
0.940 |
|
23 |
0.930 |
0.935 |
0.930 |
0.926 |
0.934 |
0.936 |
0.934 |
0.931 |
0.881 |
0.882 |
0.882 |
0.883 |
|
24 |
0.928 |
0.931 |
0.928 |
0.922 |
0.931 |
0.933 |
0.931 |
0.925 |
0.888 |
0.889 |
0.888 |
0.888 |
|
25 |
0.935 |
0.937 |
0.935 |
0.933 |
0.934 |
0.935 |
0.934 |
0.932 |
0.886 |
0.886 |
0.886 |
0.886 |
|
26 |
0.950 |
0.951 |
0.950 |
0.949 |
0.952 |
0.952 |
0.952 |
0.951 |
0.916 |
0.916 |
0.916 |
0.916 |
|
27 |
0.971 |
0.971 |
0.971 |
0.971 |
0.970 |
0.970 |
0.970 |
0.970 |
0.935 |
0.935 |
0.935 |
0.935 |
|
28 |
0.945 |
0.947 |
0.945 |
0.942 |
0.953 |
0.953 |
0.953 |
0.951 |
0.922 |
0.922 |
0.922 |
0.922 |
|
29 |
0.970 |
0.971 |
0.970 |
0.969 |
0.968 |
0.968 |
0.968 |
0.967 |
0.928 |
0.928 |
0.928 |
0.928 |
|
30 |
0.963 |
0.964 |
0.963 |
0.962 |
0.959 |
0.959 |
0.959 |
0.958 |
0.931 |
0.931 |
0.931 |
0.931 |
|
31 |
0.982 |
0.982 |
0.982 |
0.982 |
0.977 |
0.977 |
0.977 |
0.977 |
0.944 |
0.944 |
0.944 |
0.944 |
|
32 |
0.933 |
0.933 |
0.933 |
0.930 |
0.931 |
0.930 |
0.931 |
0.929 |
0.891 |
0.892 |
0.891 |
0.891 |
|
33 |
0.960 |
0.962 |
0.960 |
0.958 |
0.966 |
0.967 |
0.966 |
0.964 |
0.939 |
0.939 |
0.939 |
0.939 |
|
34 |
0.926 |
0.928 |
0.926 |
0.919 |
0.930 |
0.931 |
0.930 |
0.926 |
0.893 |
0.894 |
0.893 |
0.893 |
|
35 |
0.930 |
0.931 |
0.930 |
0.929 |
0.945 |
0.946 |
0.945 |
0.945 |
0.907 |
0.907 |
0.907 |
0.907 |
|
36 |
0.948 |
0.949 |
0.948 |
0.946 |
0.947 |
0.947 |
0.947 |
0.944 |
0.914 |
0.914 |
0.914 |
0.914 |
|
37 |
0.967 |
0.968 |
0.967 |
0.966 |
0.966 |
0.966 |
0.966 |
0.965 |
0.930 |
0.930 |
0.930 |
0.930 |
|
38 |
0.977 |
0.977 |
0.977 |
0.977 |
0.968 |
0.968 |
0.968 |
0.968 |
0.936 |
0.936 |
0.936 |
0.936 |
|
39 |
0.932 |
0.931 |
0.932 |
0.930 |
0.931 |
0.930 |
0.931 |
0.929 |
0.895 |
0.895 |
0.895 |
0.895 |
|
40 |
0.974 |
0.975 |
0.974 |
0.974 |
0.969 |
0.970 |
0.969 |
0.969 |
0.945 |
0.946 |
0.945 |
0.945 |
|
41 |
0.971 |
0.972 |
0.971 |
0.971 |
0.974 |
0.975 |
0.974 |
0.974 |
0.945 |
0.945 |
0.945 |
0.945 |
|
42 |
0.988 |
0.988 |
0.988 |
0.988 |
0.988 |
0.988 |
0.988 |
0.988 |
0.978 |
0.978 |
0.978 |
0.978 |
|
43 |
0.981 |
0.951 |
0.981 |
0.980 |
0.977 |
0.977 |
0.977 |
0.977 |
0.951 |
0.951 |
0.951 |
0.951 |
|
44 |
0.938 |
0.942 |
0.938 |
0.932 |
0.947 |
0.948 |
0.947 |
0.943 |
0.912 |
0.913 |
0.912 |
0.912 |
|
45 |
0.928 |
0.930 |
0.928 |
0.917 |
0.936 |
0.935 |
0.936 |
0.928 |
0.889 |
0.891 |
0.889 |
0.890 |
|
46 |
0.961 |
0.962 |
0.961 |
0.960 |
0.961 |
0.961 |
0.961 |
0.960 |
0.921 |
0.921 |
0.921 |
0.921 |
|
47 |
0.968 |
0.969 |
0.968 |
0.968 |
0.968 |
0.968 |
0.968 |
0.968 |
0.938 |
0.938 |
0.938 |
0.938 |
|
48 |
0.944 |
0.947 |
0.944 |
0.941 |
0.949 |
0.950 |
0.949 |
0.946 |
0.916 |
0.917 |
0.916 |
0.917 |
|
49 |
0.939 |
0.942 |
0.939 |
0.933 |
0.947 |
0.949 |
0.947 |
0.944 |
0.917 |
0.917 |
0.917 |
0.917 |
|
50 |
0.959 |
0.960 |
0.959 |
0.959 |
0.955 |
0.956 |
0.955 |
0.955 |
0.921 |
0.921 |
0.921 |
0.921 |
|
Avg |
0.950 |
0.950 |
0.950 |
0.947 |
0.953 |
0.953 |
0.954 |
0.951 |
0.919 |
0.920 |
0.920 |
0.919 |
[1] Arslan, R.S., Ulutas, H., Köksal, A.S., Bakir, M., Çiftçi, B. (2023). Sensitive deep learning application on sleep stage scoring by using all PSG data. Neural Computing and Applications, 35(10): 7495-7508. https://doi.org/10.1007/s00521-022-08037-z
[2] Benjafield, A.V., Ayas, N.T., Eastwood, P.R., Heinzer, R., Ip, M.S., Morrell, M.J., Nunez, C.M., Patel, S.R., Penzel, T., Pépin, J.L., Peppard, P.E., Sinha, S., Tufik, S., Valentine, K., Malhotra, A. (2019). Estimation of the global prevalence and burden of obstructive sleep apnoea: A literature-based analysis. The Lancet Respiratory Medicine, 7(8): 687-698. https://doi.org/10.1016/S2213-2600(19)30198-5
[3] Kainulainen, S., Töyräs, J., Oksenberg, A., Korkalainen, H., Sefa, S., Kulkas, A., Leppänen, T. (2019). Severity of desaturations reflects OSA-related daytime sleepiness better than AHI. Journal of Clinical Sleep Medicine, 15(8): 1135-1142. https://doi.org/10.5664/jcsm.7806
[4] Westerlund, A., Lagerros, Y.T., Kecklund, G., Axelsson, J., Åkerstedt, T. (2016). Relationships between questionnaire ratings of sleep quality and polysomnography in healthy adults. Behavioral Sleep Medicine, 14(2): 185-199. https://doi.org/10.1080/15402002.2014.974181
[5] Mulgrew, A.T., Fox, N., Ayas, N.T., Ryan, C.F. (2007). Diagnosis and initial management of obstructive sleep apnea without polysomnography: A randomized validation study. Annals of Internal Medicine, 146(3): 157-166. https://doi.org/10.7326/0003-4819-146-3-200702060-00004
[6] Huzooree, G., Kumar Khedo, K., Joonas, N. (2019). Pervasive mobile healthcare systems for chronic disease monitoring. Health Informatics Journal, 25(2): 267-291. https://doi.org/10.1177/1460458217704250
[7] Fraiwan, L., Lweesy, K., Khasawneh, N., Wenz, H., Dickhaus, H. (2012). Automated sleep stage identification system based on time-frequency analysis of a single EEG channel and random forest classifier. Computer Methods and Programs in Biomedicine, 108(1): 10-19. https://doi.org/10.1016/j.cmpb.2011.11.005
[8] Mostafa, S.S., Mendonça, F., Ravelo-García, A.G., Morgado-Dias, F. (2019). A systematic review of detecting sleep apnea using deep learning. Sensors, 19(22): 4934. https://doi.org/10.3390/s19224934
[9] Sun, H.Q., Jia, J., Goparaju, B., Huang, G.B., Sourina, O., Bianchi, M.T., Westover, M.B. (2017). Large-scale automated sleep staging. Sleep, 40(10): zsx139. https://doi.org/10.1093/sleep/zsx139
[10] Biswal, S., Sun, H., Goparaju, B., Westover, M.B., Sun, J., Bianchi, M.T. (2018). Expert-level sleep scoring with deep neural networks. Journal of the American Medical Informatics Association, 25(12): 1643-1650. https://doi.org/10.1093/jamia/ocy131
[11] Zhao, C.H., Li, J.B., Guo, Y.H. (2022). SleepContextNet: A temporal context network for automatic sleep staging based single-channel EEG. Computer Methods and Programs in Biomedicine, 220: 106806. https://doi.org/10.1016/j.cmpb.2022.106806
[12] Aboalayon, K.A.I., Faezipour, M., Almuhammadi, W.S., Moslehpour, S. (2016). Sleep stage classification using EEG signal analysis: A comprehensive survey and new investigation. Entropy, 18(9): 272. https://doi.org/10.3390/e18090272
[13] Fiorillo, L., Puiatti, A., Papandrea, M., Ratti, P.L., Favaro, P., Roth, C., Bargiotas, P., Bassetti, C.L., Faraci, F.D. (2019). Automated sleep scoring: A review of the latest approaches. Sleep Medicine Reviews, 48: 101204. https://doi.org/10.1016/j.smrv.2019.07.007
[14] Zhong, X., Hilton, H.J., Gates, G.J., Jelic, S., Stern, Y., Bartels, M.N., DeMeersman, R.E., Basner, R.C. (2005). Increased sympathetic and decreased parasympathetic cardiovascular modulation in normal humans with acute sleep deprivation. Journal of Applied Physiology, 98(6): 2024-2032. https://doi.org/10.1152/japplphysiol.00620.2004
[15] Herring, N., Kalla, M., Paterson, D.J. (2019). The autonomic nervous system and cardiac arrhythmias: Current concepts and emerging therapies. Nature Reviews Cardiology, 16(12): 707-726. https://doi.org/10.1038/s41569-019-0221-2
[16] Somers, V.K., Dyken, M.E., Mark, A.L., Abboud, F.M. (1993). Sympathetic-nerve activity during sleep in normal subjects. New England Journal of Medicine, 328(5): 303-307. https://doi.org/10.1056/NEJM199302043280502
[17] Betta, M., Handjaras, G., Leo, A., Federici, A., Farinelli, V., Ricciardi, E., Siclari, F., Meletti, S., Ballotta, D., Benuzzi, F., Bernardi, G. (2021). Cortical and subcortical hemodynamic changes during sleep slow waves in human light sleep. NeuroImage, 236: 118117. https://doi.org/10.1016/j.neuroimage.2021.118117
[18] AlQatari, A.A., Alturki, J.A., Abdulali, K.A., Alhumud, D.A., Alibrahim, M.A., Alarab, Y.A., Salem, A.M., Yar, T., Alqurashi, Y.D., Alsunni, A.A., Al Humoud, S. (2020). Changes in heart rate variability and baroreflex sensitivity during daytime naps. Nature and Science of Sleep, 661-669.
[19] Bahrami, M., Forouzanfar, M. (2022). Sleep apnea detection from single-lead ECG: A comprehensive analysis of machine learning and deep learning algorithms. IEEE Transactions on Instrumentation and Measurement, 71: 1-11. https://doi.org/10.1109/TIM.2022.3151947
[20] Fatimah, B., Singh, P., Singhal, A., Pachori, R.B. (2020). Detection of apnea events from ECG segments using Fourier decomposition method. Biomedical Signal Processing and Control, 61: 102005. https://doi.org/10.1016/j.bspc.2020.102005
[21] Ting, H., Mai, Y.T., Hsu, H.C., Wu, H.C., Tseng, M.H. (2014). Decision tree based diagnostic system for moderate to severe obstructive sleep apnea. Journal of medical systems, 38: 1-10. https://doi.org/10.1007/s10916-014-0094-1
[22] Bozkurt, S., Bostanci, A., Turhan, M. (2017). Can statistical machine learning algorithms help for classification of obstructive sleep apnea severity to optimal utilization of polysomno graphy resources? Methods of Information in Medicine, 56(04): 308-318. https://doi.org/10.3414/ME16-01-0084
[23] Sharma, S., Mehra, R. (2020). Conventional machine learning and deep learning approach for multi-classification of breast cancer histopathology images-a comparative insight. Journal of Digital Imaging, 33: 632-654. https://doi.org/10.1007/s10278-019-00307-y
[24] Mauldin, T.R., Canby, M.E., Metsis, V., Ngu, A.H.H., Rivera, C.C. (2018). SmartFall: A smartwatch-based fall detection system using deep learning. Sensors, 18(10): 3363. https://doi.org/10.3390/s18103363
[25] Mohammed, M., Khan, M.B., Bashier, E.B.M. (2016). Machine learning: algorithms and applications. Crc Press.
[26] Liang, S.F., Kuo, C.E., Hu, Y.H., Pan, Y.H., Wang, Y.H. (2012). Automatic stage scoring of single-channel sleep EEG by using multiscale entropy and autoregressive models. IEEE Transactions on Instrumentation and Measurement, 61(6): 1649-1657. https://doi.org/10.1109/TIM.2012.2187242
[27] Hassan, A.R., Subasi, A. (2017). A decision support system for automated identification of sleep stages from single-channel EEG signals. Knowledge-Based Systems, 128: 115-124. https://doi.org/10.1016/j.knosys.2017.05.005
[28] Jiang, D.H., Lu, Y.N., Ma, Y., Wang, Y.Y. (2019). Robust sleep stage classification with single-channel EEG signals using multimodal decomposition and HMM-based refinement. Expert Systems with Applications, 121: 188-203. https://doi.org/10.1016/j.eswa.2018.12.023
[29] LeCun, Y., Bengio, Y., Hinton, G. (2015). Deep learning. Nature, 521: 436-444. https://doi.org/10.1038/nature14539
[30] Schmidhuber, J. (2015). Deep learning in neural networks: an overview. Neural Networks, 61: 85-117. https://doi.org/10.1016/j.neunet.2014.09.003
[31] Andreotti, F., Phan, H., Cooray, N., Lo, C., Hu, M.T.M., De Vos, M. (2018). Multichannel sleep stage classification and transfer learning using convolutional neural networks. In 2018 40th Annual International Conference of the IEEE Engineering in Medicine and Biology Society (EMBC), IEEE, 171-174. https://doi.org/10.1109/EMBC.2018.8512214
[32] Michielli, N., Acharya, U.R., Molinari, F. (2019). Cascaded LSTM recurrent neural network for automated sleep stage classification using single-channel EEG signals. Computers in Biology and Medicine, 106: 71-81. https://doi.org/10.1016/j.compbiomed.2019.01.013
[33] Farag, A.F., El-Metwally, S.M., Morsy, A.A. (2014). A sleep scoring system using EEG combined spectral and detrended fluctuation analysis features. Journal of Biomedical Science and Engineering, 7(8): 1-9. https://doi.org/10.4236/jbise.2014.78059
[34] Arslan, R.S., Ulutaş, H., Köksal, A.S., Bakır, M., Çiftçi, B. (2022). Automated sleep scoring system using multi-channel data and machine learning. Computers in Biology and Medicine, 146: 105653. https://doi.org/10.1016/j.compbiomed.2022.105653
[35] Shahin, M., Ahmed, B., Hamida, S.T.B., Mulaffer, F.L., Glos, M., Penzel, T. (2017). Deep learning and insomnia: assisting clinicians with their diagnosis. IEEE Journal of Biomedical and Health Informatics, 21(6): 1546-1553. https://doi.org/10.1109/JBHI.2017.2650199
[36] Li, Q., Li, Q.C., Liu, C.Y., Shashikumar, S.P., Nemati, S., Clifford, G.D. (2018). Deep learning in the cross-time frequency domain for sleep staging from a single-lead electrocardiogram. Physiological Measurement, 39(12): 124005. https://doi.org/10.1088/1361-6579/aaf339
[37] Wei, R., Zhang, X.H., Wang, J.H., Dang, X. (2018). The research of sleep staging based on single-lead electrocardiogram and deep neural network. Biomedical Engineering Letters, 8(1): 87-93. https://doi.org/10.1007/s13534-017-0044-1
[38] Chambon, S., Galtier, M.N., Arnal, P.J., Wainrib, G., Gramfort, A. (2018). A deep learning architecture for temporal sleep stage classification using multivariate and multimodal time series. IEEE Transactions on Neural Systems and Rehabilitation Engineering, 26(4): 758-769. https://doi.org/10.1109/TNSRE.2018.2813138
[39] Malafeev, A., Laptev, D., Bauer, S., Omlin, X., Wierzbicka, A., Wichniak, A., Jernajczyk, W., Riener, R., Buhmann, J., Achermann, P. (2018). Automatic human sleep stage scoring using deep neural networks. Frontiers in Neuroscience, 12: 781. https://doi.org/10.3929/ethz-b-000304711
[40] Zhao, D.C., Wang, Y., Wang, Q.Q., Wang, X. (2019). Comparative analysis of different characteristics of automatic sleep stages. Computer Methods and Programs in Biomedicine, 175: 53-72. https://doi.org/10.1016/j.cmpb.2019.04.004
[41] Yildirim, O., Baloglu, U.B., Acharya, U.R. (2019). A deep learning model for automated sleep stages classification using PSG signals. International Journal of Environmental Research and Public Health, 16(4): 599. https://doi.org/10.3390/ijerph16040599
[42] Ravan, M., Begnaud, J. (2019). Investigating the effect of short-term responsive VNS therapy on sleep quality using automatic sleep staging. IEEE Transactions on Biomedical Engineering, 66(12): 3301-3309. https://doi.org/10.1109/TBME.2019.2903987
[43] Jeon, Y., Kim, S., Choi, H.S., Chung, Y.G., Choi, S.A., Kim, H., Yoon, S., Hwang, H., Kim, K.J. (2019). Pediatric sleep stage classification using multi-domain hybrid neural networks. IEEE Access, 7: 96495-96505. https://doi.org/10.1109/ACCESS.2019.2928129
[44] Huang, W., Guo, B., Shen, Y., Tang, X.D., Zhang, T., Li, D., Jiang, Z.H. (2020). Sleep staging algorithm based on multichannel data adding and multifeature screening. Computer Methods and Programs in Biomedicine, 187: 105253. https://doi.org/10.1016/j.cmpb.2019.105253
[45] Chriskos, P., Frantzidis, C.A., Gkivogkli, P.T., Bamidis, P.D., Kourtidou-Papadeli, C. (2019). Automatic sleep staging employing convolutional neural networks and cortical connectivity images. IEEE Transactions on Neural Networks and Learning Systems, 31(1): 113-123. https://doi.org/10.1109/TNNLS.2019.2899781
[46] Santaji, S., Desai, V. (2020). Analysis of EEG signal to classify sleep stages using machine learning. Sleep and Vigilance, 4(2): 145-152. https://doi.org/10.1007/s41782-020-00101-9
[47] Zhang, X.Q., Xu, M.K., Li, Y.R., Su, M.M., Xu, Z.Y., Wang, C.Y., Kang, D., Li, H.G., Mu, X., Ding, X., Xu, W., Wang, X.J., Han, D.M. (2020). Automated multi-model deep neural network for sleep stage scoring with unfiltered clinical data. Sleep and Breathing, 24(2): 581-590. https://doi.org/10.1007/s11325-019-02008-w
[48] Satapathy, S.K., Bhoi, A.K., Loganathan, D., Khandelwal, B., Barsocchi, P. (2021). Machine learning with ensemble stacking model for automated sleep staging using dual-channel EEG signal. Biomedical Signal Processing and Control, 69: 102898. https://doi.org/10.1016/j.bspc.2021.102898
[49] Grieger, N., Schwabedal, J.T.C., Wendel, S., Ritze, Y., Bialonski, S. (2021). Automated scoring of pre-REM sleep in mice with deep learning. Scientific Reports, 11(1): 1-14. https://doi.org/10.1038/s41598-021-91286-0
[50] Satapathy, S.K., Loganathan, D. (2021). Prognosis of automated sleep staging based on two-layer ensemble learning stacking model using single-channel EEG signal. Soft Computing, 25(9): 15445-15462. https://doi.org/10.1007/s00500-021-06218-x
[51] Satapathy, S.K., Loganathan, D. (2021). Machine learning approaches with automated sleep staging system based on two-layer heterogeneous ensemble learning stacking model. International Journal of Computing and Digital Systems, 11(1): 725-742. https://doi.org/10.12785/ijcds/110159
[52] Abdollahpour, M., Rezaii, T.Y., Farzamnia, A., Saad, I. (2020). Transfer learning convolutional neural network for sleep stage classification using two-stage data fusion framework. IEEE Access, 8: 180618-180632. https://doi.org/10.1109/ACCESS.2020.3027289
[53] Fraiwan, L., Alkhodari, M. (2020). Neonatal sleep stage identification using long short-term memory learning system. Medical & Biological Engineering & Computing, 58: 1383-1391. https://doi.org/10.1007/s11517-020-02169-x
[54] Eldele, E., Chen, Z.H., Liu, C.Y., Wu, M., Kwoh, C.K., Li, X.L., Guan, C.T. (2021). An attention-based deep learning approach for sleep stage classification with single-channel EEG. IEEE Transactions on Neural Systems and Rehabilitation Engineering, 29: 809-818. https://doi.org/10.1109/TNSRE.2021.3076234
[55] Santaji, S., Desai, V. (2020). Analysis of EEG signal to classify sleep stages using machine learning. Sleep and Vigilance, 4(2): 145-152. https://doi.org/10.1007/s41782-020-00101-9
[56] Liu, G.R., Lin, T.Y., Wu, H.T., Sheu, Y.C., Liu, C.L., Liu, W.T., Yang, M.C., Ni, Y.L., Chou, K.T., Chen, C.H., Wu, D., Lan, C.C., Chiu, K.L., Chiu, H.Y., Lo, Y.L. (2021). Large-scale assessment of consistency in sleep stage scoring rules among multiple sleep centers using an interpretable machine learning algorithm. Journal of Clinical Sleep Medicine, 17(2): 159-166. https://doi.org/10.5664/jcsm.8820
[57] Haghayegh, S., Khoshnevis, S., Smolensky, M.H., Diller, K.R. (2020). Application of deep learning to improve sleep scoring of wrist actigraphy. Sleep Medicine, 74: 235-241. https://doi.org/10.1016/j.sleep.2020.05.008
[58] Peker, M. (2016). An efficient sleep scoring system based on EEG signal using complex-valued machine learning algorithms. Neurocomputing, 207: 165-177. https://doi.org/10.1016/j.neucom.2016.04.049
[59] Loh, H.W., Ooi, C.P., Vicnesh, J., Oh, S.L., Faust, O., Gertych, A., Acharya, U.R. (2020). Automated detection of sleep stages using deep learning techniques: A systematic review of the last decade (2010-2020). Applied Sciences, 10(24): 8963. https://doi.org/10.3390/app10248963
[60] Phan, H., Mikkelsen, K. (2022). Automatic sleep staging of EEG signals: recent development, challenges, and future directions. Physiological Measurement, 43(4): 1-30. https://doi.org/10.1088/1361-6579/ac6049
[61] https://www.compumedics.com.au/en/, accessed on June 1, 2022.