Ye Wang![]()
© 2023 IIETA. This article is published by IIETA and is licensed under the CC BY 4.0 license (http://creativecommons.org/licenses/by/4.0/).
OPEN ACCESS
Obstacles in the realm of target detection, tracking accuracy, real-time performance, and robustness have been identified within the context of intelligent logistics sorting systems, which incorporate image recognition technology. Furthermore, the critical role of detecting anomalous states in augmenting sorting efficiency and curtailing errors is underscored. Image recognition technologies of a conventional nature tend to suffer from limitations in their applicability and robustness. In practical working environments, a paucity of abnormal data from logistics sorting targets is observed, which inhibits the application of supervised learning methods of deep learning. Addressing these challenges, an unsupervised deep learning method is introduced for the detection of anomalous states in logistics sorting targets. This approach reinterprets the detection of logistics sorting targets as an anomaly detection problem and utilizes Variational AutoEncoders (VAE) for modeling the distribution of normal data. This method's dependency rests exclusively on normal data for training, thereby circumventing the need for a substantial quantity of abnormal samples. In practical deployments, the anomalous state of logistics sorting targets is discerned by the method through the computation of similarity and implementation of labeling algorithms, evidencing robustness, generalizability, and adaptability. Overall, this method is presented as an effective solution for the detection of anomalous states within intelligent logistics sorting scenarios, serving to decrease labeling costs, enhance detection accuracy and efficiency, and satisfying the practical requisites of logistics sorting systems for abnormal state detection.
image processing, logistics sorting, target anomaly detection
With the exponential surge in global e-commerce, there is an increasingly high demand placed upon the logistics industry, specifically in the domain of package sorting [1, 2]. This process, a vital bridge between the departure of goods from warehouses and their eventual delivery to customers, directly impacts not only the operational costs but also customer satisfaction. Traditional manual sorting methods suffer from several drawbacks such as low efficiency, high error rates, and substantial costs. Thus, the emergence of intelligent logistics sorting systems stands as a significant industry development [3-6].
Image recognition technology, a crucial component of computer vision, plays a pivotal role in intelligent logistics sorting [7, 8]. By processing and analyzing images gathered through cameras, these technologies aid in the identification, localization, and tracking of items. This assistance facilitates automated equipment in performing sorting tasks. However, current applications of image recognition technologies in intelligent logistics sorting systems exhibit several deficiencies and limitations [9-11].
Presently, the application of image recognition technologies in intelligent logistics sorting faces numerous challenges including accuracy, real-time performance, and the robustness of object detection and tracking [12-16]. Primarily, several factors, such as lighting conditions, object occlusion, and motion blur, can negatively affect the accuracy of object detection and tracking. In realistic logistics scenarios, variations in lighting conditions can impair image quality, occlusions can render some targets challenging to identify, and high-speed moving items can produce motion blur, thereby affecting recognition accuracy [17, 18]. These factors can result in an increase in object detection and tracking errors, consequently impacting the accuracy of the sorting system. Secondly, there is a considerable computational time requirement in existing image recognition technologies, particularly those based on deep learning methods. These technologies often fail to meet the real-time demands of logistics sorting systems [19-22]. In high-speed sorting scenarios, a delay could lead to asynchrony in equipment operations, diminishing sorting efficiency. Finally, when presented with complex scenarios, multiple targets, and objects of various shapes and sizes, current technologies may suffer a performance decline [23-26]. For instance, in environments with a mix of items, recognition algorithms may struggle to distinguish between items, leading to recognition errors.
This research's main objectives center around three aspects: logistics sorting target semantic segmentation based on the optical flow field, a real-time location algorithm for logistics sorting targets based on CenterNet, and unsupervised anomaly detection for logistics sorting targets based on deep learning. The logistics sorting target semantic segmentation method, based on the optical flow field, intends to improve the accuracy of object detection and tracking. It employs the information from the optical flow field to enhance the algorithm's resilience against changes in lighting conditions, occlusion, and motion blur. Furthermore, the real-time location algorithm for logistics sorting targets, based on CenterNet, is designed to increase computational efficiency, thereby satisfying the real-time needs of intelligent logistics sorting systems. Lastly, the unsupervised anomaly detection for logistics sorting targets, based on deep learning, aims to automatically detect and identify abnormal states, thereby improving the system's stability and safety.
This research's findings are anticipated to deliver more precise, real-time, and robust image recognition technologies for intelligent logistics sorting systems. It is likely to propel technological advancement and facilitate practical applications in this field.
Within the domain of intelligent logistics sorting, image recognition technology is employed, and a crucial role is fulfilled by the Feature Flow Module (FFM). Resolution disparities between varying feature maps are effectively managed through the FFM, facilitating an efficient resolution to the pixel position deviation issue instigated by down-sampling operations. This approach notably boosts the alignment precision amongst differing resolution feature maps and consequently elevates overall semantic segmentation performance.
The fundamental principles of FlowNet, a methodology adept at capturing optical flow fields between successive video frames, are integrated into this technique. This integration furnishes the methodology with superior capabilities to overcome challenges presented by changing lighting conditions, target occlusions, and motion blur. Such issues frequently inhibit image recognition precision in intricate logistics sorting settings.
This investigation presents a real-time semantic segmentation technique for logistics sorting targets premised on the optical flow field. While processing image data in real time, the method concurrently captures the pixel shift relationships across various resolution feature maps. These capabilities enhance the real-time performance of the intelligent logistics sorting system and fulfill the requirements of high-speed sorting scenarios.
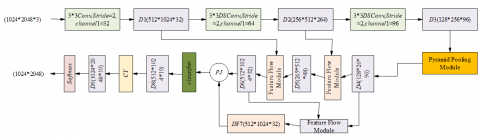
A noteworthy characteristic of the FFM lies in its ability to adaptively evaluate discrepancies between feature maps at assorted levels, and discern the apt pixel shift flow field. This endows the FFM with a robust adaptability, permitting automatic parameter adjustment in order to accommodate a variety of logistics sorting scenarios, multiple targets, and objects of diverse shapes and sizes. Figure 1 presents the constructed network architecture.
Assume that the feature maps with the same channel dimension are represented by Dm and Dm-1, the bilinear interpolation upsampling operation is represented by CY1, the concatenation operation is represented by PJ, the 3*3 convolution layer is represented by JJm, the offset relationship between feature maps is represented by ∆m-1, the upsampling operation based on ∆m- is represented by CY2, and the pixel-wise addition operation is represented by XJ. The following formula presents the workflow of the FFM:
$\Delta_{m-1}=J J_m\left(P J\left(C Y_1\left(D_m\right), D_{m-1}\right)\right)$ (1)
$O P=J J_m\left(X J\left(C Y_2\left(D_m, \Delta_{m-1}\right), D_{m-1}\right)\right)$ (2)
The operational sequence of the FFM, with the assumption of identical channel dimension feature maps designated as Dm and Dm-1, is detailed as follows:
Initially, feature extraction is conducted on the input image. Utilizing convolution kernels and strides of varying sizes facilitates the capturing of feature information at disparate levels, represented by D1, D2 and D3.
Subsequently, multi-scale feature information is extracted to capture target objects of differing scales. D3 is input into the pyramid pooling module, extracting contextual information, and resulting in D4 through channel-based concatenation operations.
The pixel position offset problem, introduced by the down-sampling operation, is addressed using the FFM to conduct up-sampling operations on the feature map. D4 and D2 are input into the FFM for up-sampling operations, generating D5. The process is repeated with D5 and D1, and D6 and D4, yielding D6 and D7, respectively.
The up-sampled feature map is then amalgamated with the original resolution feature map. Through this feature fusion process, the incorporation of feature information at various scales is achieved, thereby augmenting the efficacy of semantic segmentation. A channel dimension-based feature fusion operation is performed on D7 and D6.
A classifier, such as a fully connected or convolutional layer, is subsequently employed on the feature map, following feature fusion. Each pixel is classified, and the respective logistics sorting target category is predicted. The fused features are input into the classifier module, producing D8.
Bilinear interpolation is utilized to up-sample D7, ensuring size alignment with the original logistics sorting target image, generating D9.
Finally, a semantic segmentation prediction map of the logistics sorting target is created based on the classifier's prediction results. Each pixel is assigned a class label. The Softmax function is deployed to categorize D9 on a pixel-by-pixel basis.
This exploration of the described methodology and network architecture offers promising potential for application within the field of intelligent logistics sorting and beyond. The adaptability and efficiency of the approach attest to the feasibility of integrating such techniques into current operations to enhance real-time performance and accuracy. The innovative application of the FFM in handling resolution discrepancies and pixel position shift problems contributes valuable knowledge to the field, with potential implications for future research and technological development. The detailed steps outlined in this paper can serve as a blueprint for the practical application and refinement of the methodology, providing valuable guidance for other researchers and practitioners. Further research is encouraged to expand on these findings and explore the broader implications of this work for the field of intelligent logistics.
Figure 1. Logistics sorting target semantic segmentation network structure
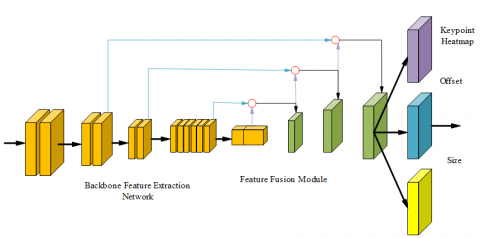
In this section, an advanced algorithm is explored for real-time location of targets in logistics sorting. With a pressing need for rapid positioning and sorting of a multitude of items in a short span, logistics sorting scenarios demand a precise, real-time approach. The proposed adaptation of the CenterNet method addresses these demands, providing highly accurate real-time locations for logistics sorting targets. The high degree of precision afforded by the enhanced method reduces the risk of sorting errors.
The complex, diverse nature of the items encountered in logistics sorting – differing widely in type, shape, size, and color – presents a significant challenge. This enhanced CenterNet method, however, demonstrates robust resilience, accurately locating target areas of a broad array of items. An illustration of the architecture of the real-time location model for logistics sorting targets is provided in Figure 2.
Figure 2. Illustration of the architecture of the real-time location model for logistics sorting targets
For the main feature extraction network, the proposed method employs MobileNet, significantly reducing the model's computational complexity. In contrast to the four feature extraction networks employed by CenterNet, MobileNet uses fewer parameters and computations, thereby easing the computational burden during the inference process. This efficiency boosts the detection speed, a critical element in the fast-paced logistics sorting scenarios. Although a degree of accuracy may be sacrificed with the use of MobileNet, a compensatory feature fusion module based on the Feature Pyramid Network (FPN) is incorporated. This module effectively combines high and low-level features, enhancing the model's precision in the task of logistics sorting target detection. The module also helps the model adapt to different scales and shapes of items, improving detection performance. The detection portion of the model remains consistent with the original CenterNet, detecting logistics sorting targets by identifying keypoints and regressing offset and size properties. This detection method demonstrates good flexibility, making it adaptable to different types of items and scenarios.
MobileNet, a lightweight convolutional neural network model, is designed specifically for embedded devices. With significantly fewer parameters and computations than comparable networks, such as Hourglass-104, DLA-34 and ResNet-101, it is ideally suited for logistics sorting scenarios, requiring less hardware. The crux of the MobileNet network is depthwise separable convolution, which effectively lessens the computational complexity of the model by dividing the standard convolution into depth and point convolution steps. Thus, MobileNet can achieve quicker computation speeds in logistics sorting scenarios, meeting the demands of real-time logistics sorting tasks.
This section further analyzes the difference in computation between standard convolution and depthwise separable convolution. Under the assumption that the model input feature map size matches the output feature map size, with both image width and height represented by FD, and channel numbers represented by L and B respectively, the convolution kernel size is represented by FJ×FJ. The computational complexity formula for standard convolution is outlined as follows:
$F_J \times F_J \times L \times B \times F_D \times F_D$ (3)
For the depthwise separable convolution employed in this paper, assume that the computation amount of the depthwise convolution is represented by FJ×FJ×L×FD×FD, and the computation amount of the pointwise convolution is represented by L×B×FD×FD. Then, the total computation amount formula is:
$F_J \times F_J \times L \times F_D \times F_D+L \times B \times F_D \times F_D$ (4)
The following formula provides the computation amount ratio between depthwise separable convolution and standard convolution:
$\frac{F_J \times F_J \times L \times F_D \times F_D+L \times B \times F_D \times F_D}{F_J \times F_J \times L \times B \times F_D \times F_D}=\frac{1}{B}+\frac{1}{F_J^2}$ (5)
MobileNet is a lightweight network designed for speed prioritization, and its feature extraction capability is slightly inferior compared to more complex backbone networks like Hourglass-104. The introduction of the FPN (Feature Pyramid Network) module can help fuse high-level and low-level features extracted by MobileNet, compensating for the shortcomings in feature extraction capability and improving detection accuracy. By merging features from different levels, the FPN module can effectively handle targets of various scales. In logistics sorting scenarios, there is a wide range of item sizes, and the incorporation of the FPN module contributes to enhancing the model's detection performance for multi-scale targets.
The architecture described implements a feature fusion module for various object sizes found in logistics sorting scenarios. The integration of features at different levels allows the model to detect multi-scale targets effectively, improving the accuracy of object detection of diverse sizes. The fusion process is achieved by deconvoluting and channel stacking different level feature maps, allowing high-level and low-level features to intertwine. This method enhances the model's feature representation capacity at different scales and abstraction levels, consequently improving the detection performance. Figure 3 provides a schematic of the feature fusion module.
Figure 3. Schematic of the feature fusion module
The loss function of the network is represented by Eq. (6). It is assumed that the loss of the center of the logistics sorting target, the loss of center offset, and the loss of the target size are represented by lossj, lossp, and lossa respectively, with the weights of lossa and lossp represented by ηa and ηp.
$\operatorname{loss}=\operatorname{loss_{j}}+\eta_a \operatorname{loss} s_a+\eta_p \operatorname{los} s_p$ (6)
As shown in Eq. (7), the Focal loss can be further used to calculate the loss of the logistics sorting target key points, lossj. The predicted and actual keypoint heatmaps are represented by $\hat{T}_{z t v}$ and Tztv, respectively. The Focal loss hyperparameters are represented by β and α, while the number of keypoints on image U is represented by B.
$\operatorname{loss}_j=\frac{-1}{B} \sum_{z t v}\left\{\begin{array}{l}\left(1-\hat{T}_{z t v}\right)^\beta \operatorname{LN}\left(\hat{T}_{z t v}\right), I F T_{z t v}=1 \\ \left(1-T_{z t v}\right)^\alpha\left(\hat{T}_{z t v}\right)^\beta I N\left(1-\hat{T}_{z t v}\right), \text { Otherwise }\end{array}\right.$ (7)
Lastly, Eqns. (8) and (9) detail the computation of the loss of center offset and size loss for the logistics sorting target. The predicted center offset and target size are denoted by $\hat{P}_j$ and $\hat{A}_j$, while the actual center offset and target size derived from real labels are represented by $\hat{P}_j$ and $\hat{A}_j$.
$\operatorname{loss}_p=\frac{1}{B} \sum_{j=1}^B\left|\hat{P}_j-P_j\right|$ (8)
$\operatorname{loss}_a=\frac{1}{B} \sum_{j=1}^B\left|\hat{A}_j-A_j\right|$ (9)
Traditional methods for anomaly detection in logistics sorting targets may be constrained by specific scenarios and types of anomalies, resulting in a narrow application scope. Additionally, the volume of abnormal data in actual working conditions is often insufficient to support supervised learning methods in deep learning. An unsupervised method based on deep learning is proposed, demonstrating robust generalizability across various logistics sorting scenarios. By modeling the distribution of normal data through a Variational AutoEncoder (VAE), a high degree of robustness is ensured when encountering different types of items and scenarios. Furthermore, this approach only requires modeling the distribution of normal data through unsupervised learning, eliminating the need for a large number of abnormal samples for training and overcoming the scarcity of abnormal data. The structure of the Variational AutoEncoder is displayed in Figure 4.
Figure 4. Structure of the Variational AutoEncoder
The Variational AutoEncoder (VAE) is a generative model capable of learning the latent representation of data and generating new data based on these representations. In the context of logistics sorting scenarios, employing a VAE facilitates learning the latent distribution of data, thus enabling the generation of logistics sorting targets. This approach assists in simulating and understanding various possible scenarios.
The theoretical basis of the Variational AutoEncoder is the Gaussian Mixture Model. In a VAE, the distribution O (z) of the original logistics sorting target image data can be estimated based on the superposition of Gaussian distributions as shown in Eq. (10):
$O(z)=\int_x O(x) O(z \mid x) f x$ (10)
It is assumed that the parameters to be estimated are represented by ω(x) and δ(x), where x~N(0,U) and z|x~N(ω(x),δ(x)). Given the complex distribution of the logistics sorting target data O(z), a neural network decoder has been constructed to facilitate the calculation of O(z|x) and its mean and variance.
To address the challenge posed by large latent variable dimensions that complicate integral operations, a second neural network encoder w(z|x) has been built to approximate O(z|x). The model expects to maximize O(z) as shown in Eq. (11). By equating w(z|x) with the above formula, Eq. (12) is derived.
$M A X M=\sum_z \log O(z)$ (11)
$\begin{aligned} & \log (z)=\int_x w(x \mid z) \log O(z) d x \\ & =\int_x w(x \mid z) \log \frac{O(x, z)}{O(x \mid z)} d x \\ & =\int_x w(x \mid z) \log \frac{O(x, z) w(x \mid z)}{O(x \mid z) O(x \mid z)} d x \\ & =\int_x w(x \mid z) \log \frac{O(x, z)}{w(x \mid z)} d x+\int_x w(x \mid z) \log \frac{w(x, z)}{O(x \mid z)} d x \\ & =\int_x w(x \mid z) \log \frac{O(x, z)}{w(x \mid z)} d x+J M(w(x \mid z) \| O(x \mid z))\end{aligned}$ (12)
The lossn, given as ∫xw(x|z)log(O(x,z)/w(x|z))dx, is represented in Eq.(13):
$\log (z)=M_n+J M(w(x \mid z) \| O(x \mid z)) \geq L_{n M}$ (13)
where, JM stands for the KL divergence. An approximation of logO(z) is provided, which allows the adjustment of the size of logO(z) to ensure lossn equals logO(z). As lossn is a lower bound, solving MAX logO(z) is equivalent to solving MAXlossn.
$\begin{aligned} & M_n=\int_x w(x \mid z) \log \frac{O(x, z)}{O(x \mid z)} d x \\ & =\int_x w(x \mid z) \log \frac{O(z, x) O(z)}{w(x \mid z)} d x \\ & =\int_x w(x \mid z) \log \frac{O(x)}{w(x \mid z)} d x+\int_x w(x \mid z) \log (z \mid x) d x \\ & =-J M(w(x \mid z) \| O(x \mid z))+\int_x w(x \mid z) \log (z \mid x) d x\end{aligned}$ (14)
Notably, the maximization of MAX logO(z) can be considered as solving the minimum of JM(w(x|z)||O(x)) and the maximum of ∫xw(x|z)logO(z|x)dx. Minimizing JM(w(x|z)||O(x)) is also seen as ensuring the smallest divergence between the encoding distribution and the standard Gaussian distribution, as shown in Eq. (15):
$\int_x w(x \mid z) \log (z \mid x) d x=R_{\operatorname{wx}(x \mid z)}\,\,\,[\log (z \mid x)]$ (15)
Consequently, the value of O(z|x) given w(x|z) can be kept as high as possible. The loss function of the autoencoder is given in Eq. (16):
loss $=-J M(w(x \mid z) \| O(x))+R_{w(x \mid z))}\,\,\,[\log (z \mid x)]$ (16)
Table 1 delineates the experimental outcomes of various semantic segmentation algorithms. A noticeable disparity in performance is observed on two metrics - mean Intersection over Union (mIoU) and Frames per Second (FPS). Among these methods, the highest mIoU (77.5%) is achieved by FCN, indicating its superior segmentation precision. However, the FPS of FCN is a mere 3, hinting at its lack of real-time efficiency. This could be attributed to the multiple upsampling and downsampling operations during the computation process, leading to slower processing speeds. U-Net yields an mIoU of 61.2%. Although this is lower than FCN, its FPS of 121 substantially exceeds that of other methods, indicating U-Net's ability to maintain good real-time efficiency while retaining a certain segmentation accuracy. The symmetric structure and skip connections of U-Net, preserving more context information during computation, contribute to its increased processing speed. DeepLab's mIoU, resting at 68.6%, lies between FCN and U-Net. With its FPS at 33, it surpasses FCN but falls short of U-Net. It suggests DeepLab strikes a commendable balance between segmentation precision and real-time efficiency. The introduction of techniques like dilated convolutions and conditional random fields allows DeepLab to enhance segmentation precision without significantly impacting processing speed. The mIoU achieved by the method proposed in this study is 71.3%, exceeding U-Net and DeepLab but falling behind FCN. However, its FPS of 84, higher than both FCN and DeepLab, albeit slightly lower than U-Net, shows the proposed method maintains good real-time efficiency while preserving high segmentation precision.
Figure 5 portrays the mIoU performance of the proposed semantic segmentation algorithm under different training Epochs. At the onset of training, the model's mIoU is 0.04, as the model has not yet been trained and cannot accurately carry out target segmentation. As the number of training Epochs increases, the model's mIoU gradually rises. At 50 Epochs, the mIoU reaches 0.57, indicating that the model possesses a certain segmentation ability. However, mIoU fluctuates during the subsequent training process, possibly due to the model encountering local optimal solutions or overfitting. When the training Epochs reach 760, the model's mIoU hits 0.61, suggesting improved segmentation capability. Later, at 1000 Epochs, the mIoU further ascends to 0.68, indicating a significant boost in segmentation performance after a sufficient number of training Epochs.
Table 1. Experimental outcomes of various semantic segmentation algorithms
|
Method |
Image size |
mloU (%) |
Frames per second |
|
FCN |
1024*2048 |
77.5 |
3 |
|
U-Net |
1024*2048 |
61.2 |
121 |
|
DeepLab |
1024*2048 |
68.6 |
33 |
|
The method used in this paper |
1024*2048 |
71.3 |
84 |
Figure 5. mIoU curve plot
Table 2. Precision and recall rates under different MSE thresholds
|
Threshold setting |
Normal precision rate |
Normal recall rate |
Abnormal precision rate |
Abnormal recall rate |
|
4750 |
84.36% |
88.24% |
67.23% |
67.82% |
|
5000 |
85.19% |
91% |
72.36% |
64.32% |
|
5250 |
84.26% |
93.52% |
77.63% |
61% |
|
5500 |
83.19% |
95.56% |
80.99% |
61% |
|
5750 |
81.48% |
95.63% |
76.95% |
45.68% |
Table 3. Precision and recall rates under different MI thresholds
|
Threshold setting |
Normal precision rate |
Normal recall rate |
Abnormal precision rate |
Abnormal recall rate |
|
0.55 |
81.95% |
84.23% |
81.62% |
43.56% |
|
0.56 |
82.31% |
93.68% |
77.32% |
50% |
|
0.57 |
82.34% |
92.45% |
72.31% |
50% |
|
0.58 |
81.64% |
89.26% |
61.36% |
50% |
|
0.59 |
83.62% |
83.82% |
60% |
60% |
Table 4. Precision and recall rates under different SSIM thresholds
|
Threshold setting |
Normal precision rate |
Normal recall rate |
Abnormal precision rate |
Abnormal recall rate |
|
0.70 |
86.44% |
98.46% |
96% |
68.57% |
|
0.72 |
90.14% |
98.46% |
95% |
87% |
|
0.74 |
90.48% |
94.21% |
89.64% |
86% |
|
0.76 |
95.24% |
91.67% |
86.45% |
85.47% |
|
0.78 |
95.79% |
87.14% |
68.27% |
94.20% |
Analysis can be conducted based on data provided in Table 2 and Table 3, examining the precision and recall rate under different MSE and MI thresholds. The data analysis reveals that as the MSE and MI thresholds increase, the recall rate for normal instances is higher, but the precision rate for anomalies is lower. This suggests that in intelligent logistics sorting scenarios, the choice of MSE and MI thresholds plays a minimal role in balancing the performance of normal and anomalous classifications.
Tables 2 and 4 present precision and recall rates under different MSE and SSIM (Structural Similarity Index Measure) thresholds, respectively. Table 4 reveals the precision and recall rates under different SSIM thresholds. Based on the given data, an analysis can be made on precision and recall rates at varying SSIM thresholds. At an SSIM threshold of 0.70, the normal precision rate is 86.44%, the normal recall rate is 98.46%, the abnormal precision rate is 96%, and the abnormal recall rate is 68.57%. When the SSIM threshold is increased to 0.72, the normal precision rate improves to 90.14% while the abnormal recall rate increases to 87%, compared to the threshold of 0.70. Upon further increasing the SSIM threshold to 0.74 and 0.76, the normal precision rate rises to 90.48% and 95.24% respectively, however, the normal recall rate slightly drops. When the SSIM threshold is at 0.78, the normal precision rate is 95.79% with an abnormal recall rate of 94.20%. As the SSIM threshold changes, the normal precision rate, normal recall rate, abnormal precision rate, and abnormal recall rate are generally ideal. Depending on the practical needs and circumstances, the best SSIM threshold can be selected to balance the precision and recall rates.
(1)
(2)
(3)
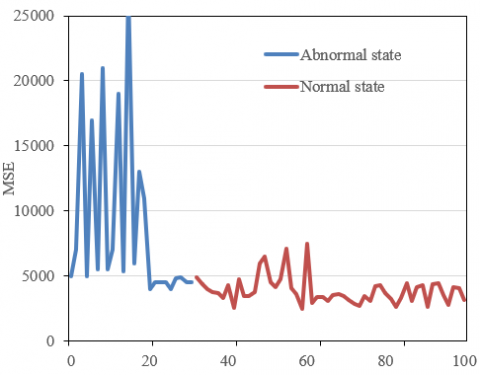
Figure 6. Curve of different similarity indices
Figure 6 presents the curve of different similarity indices in the intelligent logistics sorting scene based on image processing. After training a VAE model with a normal dataset (consisting of images of logistics sorting targets without abnormalities), the to-be-tested data (potentially containing images with abnormal logistics sorting targets) can be inputted for reconstruction. The VAE, having learned the distribution characteristics of normal data during training, will essentially keep the normal data unchanged during reconstruction, while abnormal data would be automatically repaired to conform to the distribution of normal data. Then, the similarity between the to-be-tested data and its corresponding reconstructed data must be calculated. Finally, by comparing the calculated similarity value with a pre-set threshold, the to-be-tested data can be determined as abnormal or normal.
Figure 6 includes the MSE, MI, and SSIM curves for different similarity indices. An analysis of Figure 6(1) indicates that the MSE value is generally higher in abnormal states, which suggests a larger difference between the to-be-tested data and the reconstructed data. This may be due to the VAE primarily learning the distribution characteristics of normal data, so when reconstructing abnormal data, it tries to repair it to normal data, resulting in a significant difference from the original abnormal data. In normal states, the MSE value is relatively lower, implying a smaller difference between the to-be-tested and reconstructed data, since the VAE has learned the distribution characteristics of normal data. A similar conclusion can be drawn from the curve analysis of MI and SSIM.
The study under discussion explores, and seeks to optimize, image recognition technology within intelligent logistics sorting systems. A semantic segmentation method for logistics sorting targets, predicated upon an optical flow field, was proposed with an intent to amplify the accuracy of target detection and tracking. A real-time logistics sorting target positioning algorithm, founded on CenterNet, was further developed to enhance computational efficiency, thereby addressing the instantaneous demands of intelligent logistics sorting systems. Lastly, a method for monitoring the abnormal states of logistics sorting targets, based on unsupervised deep learning, was put forth, promising to automate the detection and identification of irregular states, and consequently bolstering the stability and safety of the sorting systems.
On examination of experimental data, several conclusions can be drawn:
(1) Image processing technology has been demonstrated as an invaluable tool in automatically identifying and categorizing normal and abnormal items in an intelligent logistics sorting scenario. Such automated classification enhances the efficiency and accuracy of sorting.
(2) The choice of an appropriate image similarity measurement method and threshold is integral to efficient identification of normal and abnormal items. MSE and Structural Similarity Index (SSIM), which respectively focus on pixel differences and visual perceptual differences, stand out as common measurement methods.
(3) The optimal threshold must be carefully selected, striking a balance between precision and recall rates in response to business needs and practical circumstances. As dictated by real-world data and scenarios, this optimal threshold might warrant adjustments.
(4) Upon deployment and application of the technology, different image similarity measurement methods and thresholds can be jointly employed for more precise classification of normal and abnormal items. Exploration of other advanced image processing methods to further enhance recognition accuracy is also encouraged.
Given these conclusions, further research could delve into exploring different combinations of image similarity measurement methods and threshold values in various real-world scenarios. Such investigations may help determine more accurate and efficient methods of normal and abnormal item classification in intelligent logistics sorting systems. Additionally, the study has illuminated the potential benefits of integrating these findings with other advanced image processing methods, further enriching the potential applications of image recognition technology in the domain of intelligent logistics.
[1] Zeng, Y., Zhou, Y., Peng, R., Huang, G. (2023). The design and implementation of the all-in-one machine for killing and sorting in the small and medium-sized logistics center. In 2023 IEEE 3rd International Conference on Power, Electronics and Computer Applications, ICPECA 2023, Shenyang, China, pp. 688-694. https://doi.org/10.1109/ICPECA56706.2023.10075764
[2] Zhang, C., Zheng, L., Pan, S. (2022). Suction grasping detection for items sorting in warehouse logistics using deep convolutional neural networks. In ICNSC 2022 - Proceedings of 2022 IEEE International Conference on Networking, Sensing and Control: Autonomous Intelligent Systems (ICNSC), Shanghai, China, pp. 1-6. https://doi.org/10.1109/ICNSC55942.2022.10004168
[3] Ye, Z., Li, Y., Zhang, Z., Chen, X., Liu, D., Ni, W. (2022). Research on campus logistics intelligent sorting system using robots. In Proceedings of the 7th International Conference on Cyber Security and Information Engineering, Brisbane QLD Australia, pp. 997-1001. https://doi.org/10.1145/3558819.3565233
[4] Fu, X., Jiang, H. (2022). Research on the optimal sorting path of intelligent logistics warehouse. In 2022 4th International Conference on Control and Robotics, ICCR 2022, Guangzhou, China, pp. 125-128. https://doi.org/10.1109/ICCR55715.2022.10053898
[5] Ghotb, S., Sowlati, T., Mortyn, J., Roeser, D., Griess, V.C. (2022). A goal programming model for the optimization of log logistics considering sorting decisions and social objective. Canadian Journal of Forest Research, 52(5): 716-726. https://doi.org/10.1139/cjfr-2021-0203
[6] Zhang, Q. (2021). Research on the architecture of cold chain logistics multimedia monitoring and tracking service platform based on fuzzy sorting and heuristic algorithm. Advances in Multimedia, 2021: Article ID 5998153. https://doi.org/10.1155/2021/5998153
[7] Ying, W., Zhang, L., Luo, S., Yao, C., Ying, F. (2023). Simulation of computer image recognition technology based on image feature extraction. Soft Computing, 27(14): 10167-10176. https://doi.org/10.1007/s00500-023-08246-1
[8] Liu, Z., Wang, H., Zhou, T., Shen, Z., Kang, B., Shelhamer, E., Darrell, T. (2023). Exploring simple and transferable recognition-aware image processing. IEEE Transactions on Pattern Analysis and Machine Intelligence, 45(3): 3032-3046. https://doi.org/10.1109/TPAMI.2022.3183243
[9] Nie, C.R., Guo, J., Tang, S.J., Qi, H.B. (2023). UAV path recognition and tracking based on image. Journal of Physics: Conference Series, 2460(1): 012156. https://doi.org/10.1088/1742-6596/2460/1/012156
[10] Qin, W., Zhang, H., Hong, R., Lim, E., Sun, Q. (2023). Causal interventional training for image recognition. IEEE Transactions on Multimedia, 25: 1033-1044. https://doi.org/10.1109/TMM.2021.3136717
[11] Sathya, R., Anirudh, N.N., Ganeshram, H. (2023). Teeth gap and position recognition system with intraoral scanner images using image processing. In 2023 IEEE International Students' Conference on Electrical, Electronics and Computer Science, SCEECS 2023, Bhopal, India, pp. 288-293. https://doi.org/10.1109/SCEECS57921.2023.10063102
[12] Wang, Q., Chen, A., Xue, Y. (2023). Liver CT image recognition method based on capsule network. Information, 14(3): 183. https://doi.org/10.3390/info14030183
[13] Chen, H., Yan, Y., Qin, J., Zhao, T., Guo, T. (2023). Recognition-oriented facial depth estimation from a single image. Applied Intelligence, 53(2): 1807-1825. https://doi.org/10.1007/s10489-022-03560-x
[14] Drăgulinescu, A. (2023). Optical correlators for cryptosystems and image recognition: A review. Sensors, 23(2): 907. https://doi.org/10.3390/s23020907
[15] Vezzu, H.S.S.K., Nalluri, S., Swetha, K., SaiKumar, V. (2023). Hand sign recognition using image processing. In 2023 International Conference on Intelligent Data Communication Technologies and Internet of Things (IDCIoT), Bengaluru, India, pp. 288-293. https://doi.org/10.1109/IDCIoT56793.2023.10053506
[16] Paul, M., Vivek, K., Joseph, P.J., Sharanjith, V.P., Malik, S., Rajeev, S. (2023). Artificial intelligence based image recognition system. Materials Today: Proceedings, 72: 3222-3227. https://doi.org/10.1016/j.matpr.2022.12.192
[17] Xiong, W., He, Y., Zhang, Y., Luo, W., Ma, L., Luo, J. (2020). Fine-grained image-to-image transformation towards visual recognition. In Proceedings of the IEEE/CVF Conference on Computer Vision and Pattern Recognition (CVPR), Seattle, WA, USA, pp. 5840-5849. https://doi.org/10.1109/CVPR42600.2020.00588
[18] López-Ávila, L.F., Álvarez-Borrego, J. (2020). Fractional Fourier transform for digital image recognition. International Journal of Pattern Recognition and Artificial Intelligence, 34(10): 2054025. https://doi.org/10.1142/S0218001420540257
[19] Riahi, M., Eslami, M., Safavi, S.H., Torkamani Azar, F. (2020). Human activity recognition using improved dynamic image. IET Image Processing, 14(13): 3223-3231. https://doi.org/10.1049/iet-ipr.2019.1739
[20] Zhang, S., Wu, Y., Chang, J. (2020). Survey of image recognition algorithms. In 2020 IEEE 4th Information Technology, Networking, Electronic and Automation Control Conference (ITNEC), Chongqing, China, pp. 542-548. https://doi.org/10.1109/ITNEC48623.2020.9084972
[21] Khaldi, Y., Benzaoui, A. (2020). Region of interest synthesis using image-to-image translation for ear recognition. In 2020 International Conference on Advanced Aspects of Software Engineering (ICAASE), Constantine, Algeria, pp. 1-6. https://doi.org/10.1109/ICAASE51408.2020.9380127
[22] Yu, W., Li, Y., Peng, H., Zhang, L. (2020). Image iterative method for handwritten Chinese character recognition. In Journal of Physics: Conference Series, 1684(1): 012101. https://doi.org/10.1088/1742-6596/1684/1/012101
[23] Bello, R.W., Talib, A.Z., Mohamed, A.S.A., Olubummo, D.A., Otobo, F.N. (2020). Image-based individual cow recognition using body patterns. Image, 11(3): 92-98.
[24] He, Y.M., Wang, B., Zhu, Z.M. (2020). An improved LeNet-5 model for image recognition. In Proceedings of the 2020 4th International Conference on Electronic Information Technology and Computer Engineering, Xiamen China, pp. 444-448. https://doi.org/10.1145/3443467.3443797
[25] Hu, Y., Wang, F. (2022). Multi-modal emotion recognition combining face image and EEG signal. Journal of Circuits, Systems and Computers, 32(7): 2350125. https://doi.org/10.1142/S0218126623501256
[26] Prasad, V.S.V.D., Reddy, I.R., Kumar, K.S. (2023). Surveillance of construction sites using image recognition techniques. International Journal of Computer Science and Network Security, 23(5).