Yang Wang*![]() | Wei Ning
| Wei Ning![]() | Xue Wang
| Xue Wang![]() | Shengyu Zhang
| Shengyu Zhang![]() | Duo Yang
| Duo Yang![]()
© 2023 IIETA. This article is published by IIETA and is licensed under the CC BY 4.0 license (http://creativecommons.org/licenses/by/4.0/).
OPEN ACCESS
Conventional forest fire monitoring methods, such as ranger patrol and satellite remote sensing, possess certain limitations. Unmanned Aerial Vehicles (UAVs) have been identified as valuable tools for firefighting due to their high mobility, rapid deployment, and low cost, enabling quick identification of fire sources during the initial stages. To maximize the potential of UAVs in forest fire monitoring, this study investigates a novel approach for analyzing infrared images captured by UAVs for forest fire monitoring purposes. Initially, a diagram illustrating the hardware utilized in a typical forest fire monitoring system is provided. Subsequently, based on static features (such as color and texture) and dynamic features (such as size, location, and shape) of the infrared images captured by UAVs, a new algorithm for detecting suspected fire areas is proposed and employed to make final judgments on potential forest fire regions. Finally, a forest fire identification model is developed based on an improved Probability Neural Network (PNN), and its effectiveness is verified through experimentation. The research presented in this paper could offer valuable insights for forest fire monitoring.
forest fire monitoring, Unmanned Aerial Vehicle (UAV), infrared image, Probability Neural Network (PNN)
The frequency of forest fires has increased in recent years due to the impacts of intensified global climate change and human activities, resulting in significant harm and loss to both human society and the ecological environment [1, 2]. Statistics indicate that millions of hectares of forests are destroyed by fire annually worldwide [3], leading to considerable loss of biodiversity [4] and increased carbon emissions [5]. Forest fires not only damage forest resources [6] and adversely affect the atmospheric environment [7], soil-water conservation [8], biodiversity [9], and quality of human life [10], but also contribute to the long-term failure of forest ecosystems with far-reaching impacts on soil structure and water resources [11]. As a result, strengthening forest fire monitoring and prevention is of great importance.
To prevent forest fires and minimize the ecological and environmental damages they cause, governments and research institutions worldwide have invested significant resources into researching forest fire monitoring methods [12]. Conventional monitoring methods, such as ranger patrol and satellite remote sensing, have their respective disadvantages [13]. Ranger patrol is time and labor-intensive, limited by natural conditions like topography and climate, and struggles to achieve rapid and accurate fire source discovery [14]. Moreover, patrolling forests in adverse weather or harsh terrain conditions poses high safety risks [15]. Although satellite remote sensing can cover wide areas and provide real-time feedback, its limited resolution hampers accurate fire source positioning during the early stages of a fire [16]. Additionally, factors such as cloud cover can affect the real-time fire source monitoring capabilities of satellite remote sensing [17]. Consequently, researchers face the pressing task of developing more efficient and accurate forest fire monitoring methods [18, 19].
Rapid advancements in Unmanned Aerial Vehicle (UAV) technology in recent decades have offered a new solution for forest fire monitoring, boasting numerous advantages such as high mobility, rapid deployment, and low cost [20]. UAVs can quickly locate fire sources in the initial stages and provide powerful support for firefighting efforts [21]. Infrared images effectively detect temperature distribution in target areas, accurately identifying fire sources and proving useful for fire source detection. The combination of UAVs and infrared imaging can significantly improve the accuracy and real-time performance of forest fire monitoring.
This study aims to investigate an analysis method for infrared images captured by UAVs for forest fire monitoring. In the second section, a diagram illustrating the hardware utilized in a typical forest fire monitoring system is provided. Based on the static features (such as color and texture) and dynamic features (such as size, location, and shape) of the infrared images captured by UAVs, a new algorithm for detecting suspected fire areas is proposed and applied to make final judgments on potential forest fire regions. In the third section, a forest fire identification model is developed based on an improved PNN. Finally, the effectiveness of the proposed method is verified through experimentation. The research findings obtained in this study could serve as a reference for future studies on forest fire monitoring.
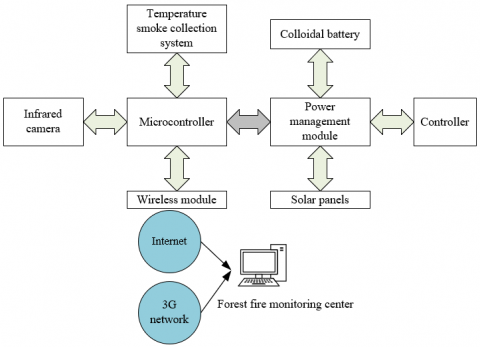
Figure 1 gives a diagram showing the hardware structure of a typical forest fire monitoring system. The fire detection algorithms used in existing detection systems are mostly multi-feature fusion algorithms, but as the number of extracted feature types of suspected fire area gets higher, the effect of such multi-feature fusion algorithms gets worse. Considering the complexity of feature extraction of suspected forest fire area, this study proposed a new algorithm for detecting suspected fire area based on color and texture features of infrared images taken by UAV and applied it to the final judgement of suspected fire area.
Figure 1. Hardware structure of forest fire monitoring system
The YCbCr color space separates the brightness information (Y channel) of an image from its chromaticity information (Cb and Cr channels), which means that Cb and Cr channels only represent color information and are irrelevant to brightness. In fire detection, such separation is helpful to eliminating the influence of light change on color feature extraction and improving the stability and accuracy of the detection algorithm. In the meantime, the color range of flames usually concentrates in warm tone areas such as red, orange, and yellow. In the YCbCr color space, these colors are represented as specific combinations of Cb and Cr channels, so through the feature distribution analysis of Cb and Cr channels, fire areas could be effectively identified, and this is the reason this study took the distribution of Cb and Cr channels in the YCbCr color space as the color features of suspected forest fire area.
Assuming: Z represents the calculated color eigenvector of a suspected forest fire area, zL1 represents the mean value of Cb component in the YCbCr color space, zA1 represents the corresponding standard deviation, zL2 represents the mean value of Cr component, zA2 represents the corresponding standard deviation, then the eigenvector of the suspected forest fire area is given by the following formula:
$Z=\left[\begin{array}{llll}z_{L 1} & z_{L 2} & z_{A 1} & z_{A 2}\end{array}\right]$ (1)
This study used energy, entropy, contrast and correlation to describe the texture information of suspected fire area, since they are metrics that can measure texture properties from different angles. Energy indicates texture uniformity, entropy indicates texture complexity, contrast indicates the distribution differences of grayscale in the texture, and correlation indicates the direction of texture. Together these four features depict the full properties of texture, which is conductive to improving the accuracy of fire detection. The texture features of flame areas are significantly different from those of non-flame areas, so the four indicators can effectively capture these differences and distinguish between flame and non-flame areas.
Assuming: NL represents energy, SH represents entropy, DBD represents contrast, XGX represents correlation. By normalizing the gray-level co-occurrence matrix of infrared images of forest fire taken by UAV, a matrix O with u rows and k columns could be attained. Assuming: ωb and ωl represent the mean values in directions u and k, δb and δl represent the standard deviations in directions u and k, then the calculation formulas of NL, SH, DBD and XGX are:
$N L=\sum_{b=0}^u \sum_{l=0}^k O(l, b)^2$ (2)
$S H=-\sum_{b=0}^l \sum_{l=0}^k O(b, l) L O O(b, l)$ (3)
$D B D=\sum_{b=0}^u \sum_{l=0}^k(b-l)^2 O(b, l)$ (4)
$X G X=\frac{\left[\sum\,_{b=0}^u \,\,\,\sum\,_{l=0}^k\,\,\,(b l)\,\,\, O(b, l)\right]-\omega_b\, \omega_l}{\delta_b \delta_l}$ (5)
Assuming: ZHYWL represents the texture eigenvector of suspected forest fire area attained from the calculation of the gray-level co-occurrence matrix; the mean values and standard deviations of NL, SH, DBD and XGX are represented by zL3, zL4, zL5, zL6 and zA3, zA4, zA5, zA6, then ZHYWL can be written as:
$\begin{aligned} & Z_{H 1 W L}= & {\left[\begin{array}{llllllll}z_{L 3} & z_{L 4} & z_{L 5} & z_{L 6} & z_{A 3} & z_{A 4} & z_{A 5} & z_{A 6}\end{array}\right]}\end{aligned}$ (6)
By combining the features of the YCbCr color space and the suspected forest fire area, a single sample feature Z of the infrared image can be expressed as:
$Z=\left[\begin{array}{ll}Z_{\text {TVVVe }} & Z_{H \Gamma W L}\end{array}\right]$ (7)
In actual applications, moving objects in infrared images are sometimes mistakenly reported. Via dynamic feature extraction, changes in the location and shape of suspected fire area can be analyzed so as to distinguish them from other moving objects and eliminate the interference. By analyzing multiple continuously-shot infrared images, changes in the suspected fire area in the time dimension could be captured, which is conduce to distinguishing between real fires and accidental flame phenomena, thereby reducing misjudgments. Dynamic features such as the size, location and shape of suspected fire area can reflect the trend of fire development. In this study, the area change rate was used to represent the velocity of fire spread, and the displacement of mass center was adopted to represent the direction of fire spread, in this way, combining with the static and dynamic features such as color and texture, the suspected fire area could be described more comprehensively, which can further improve the accuracy and reliability of fire detection.
Assuming: U1(z,t) and U2(z,t) represent two consecutive infrared images of a suspected forest fire area; SU1 and SU2 respectively represent the area of U1(z,t) and U2(z,t), then the formula for calculating the area change rate of forest fire is:
$C_{M Z}=\frac{S_{U 2}-S_{U 1}}{S_{U 1}}$ (8)
If the infrared images are collected at very short time intervals, then the area growth and stability features should be fully considered. This study adopted the idea of average filtering to improve the above calculation method. Assuming: S represents the area of forest fire, C represents the area change rate, $\bar{C}$ represents the average area change rate, then there are:
$C_{u j}=\frac{S_{u+j}-S_u}{j}$ (9)
$\overline{C_{u j}}=\frac{1}{b} \sum_{u=1}^b C_{u j}$ (10)
In terms of the determination of mass center displacement, the suspected fire area was subjected to binarization processing. A threshold was set to divide pixel values within the suspected fire area into two categories: flame pixels (value is 1) and non-flame pixels (value is 0). The mass center was the central coordinate of the fire area. Assuming U1(z,t) and U2(z,t) represent two consecutive infrared images of suspected forest fire area, (Z1, T1) and (Z2, T2) respectively represent the center of the suspected fire area in the two images, the size was both L*B, then the center of the suspected fire area (Z,T) can be calculated by the following formula:
$Z=\frac{\sum U(z, t) \times z}{U(z, t)}, T=\frac{\sum U(z, t) \times t}{U(z, t)}$ (11)
Then the mass center displacement of the suspected fire area in U1(z,t) and U2(z,t) can be calculated as follows:
$F_{J J}=\sqrt{\left(Z_2-Z_1\right)^2+\left(T_2-T\right)_1^2}$ (12)
The edges of a fire usually appear as irregular and fast-changing contours. By analyzing the jittering edges, the dynamic features of flame edges can be captured to help identify the real fire area. Interferents such as flash light and reflection exhibit static features similar to those of a fire area, but their edge jittering features are quite different, so analyzing the significance of changes in the number of sharp angles can effectively reduce false positives. Assuming: OJJrepresents the number of sharp angle changes in the suspected fire area, $\overline{O_{J J}}$ represents the average number of sharp angle changes, V represents the number of sharp angles, then there are:
$O_{J J}=\left|V_2-V_1\right|$ (13)
$\overline{O_{J J}}=\frac{\left|V_b-V_{b-1}\,\,\,\right|+\ldots+\left|V_3-V_2\right|+\left|V_2-V_1\right|}{b-1}$ (14)
The analysis of jittering edges is not affected by illumination or occlusion, thus it has a good adaptability, and this makes it possible to maintain a high detection performance in various environments by making judgments based on the significance of changes in the number of sharp angles.
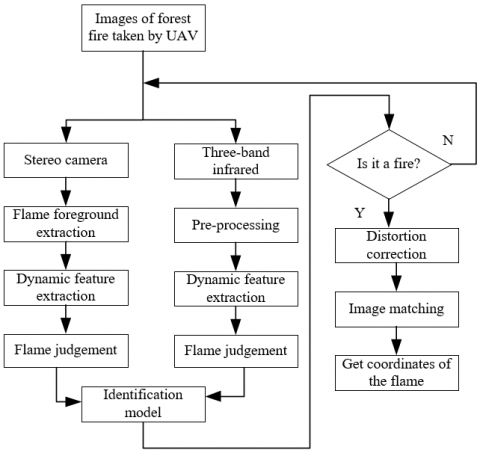
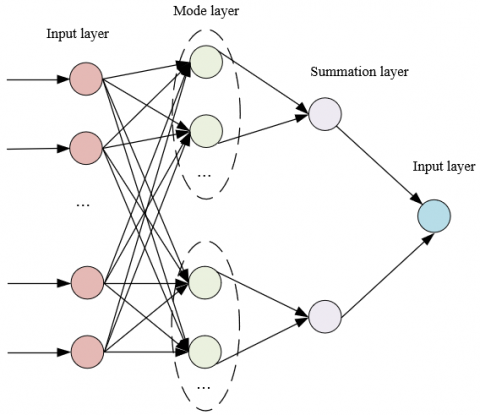
Figure 2 plots the flow of the overall forest fire identification scheme. Compared with other neural network models, PNN has a faster training speed. The main training process of PNN is to calculate the probability density function, and no iterative optimization is required, thus the model training can be completed within a short time. PNN model uses kernel function to realize nonlinear classification, thus it can quickly solve complex classification problems. In terms of forest fire identification tasks, since fire and non-fire areas exhibit nonlinear distribution in the feature space, PNN has a good classification performance. Figure 3 shows the structure of PNN model.
Figure 2. Flow chart of the overall forest fire identification scheme
Figure 3. Structure of PNN
Assuming: X=(x1,x2, x3,...,xn) represents the dynamic features of suspected forest fire area of a single sample input into the model, Z represents the vector of b×m, Zuk represents the dynamic features of suspected forest fire area of the k-th input sample in the u-th category, δ represents the smoothing factor, then the output of the model mode layer Puk can be calculated by the following formula:
$P_{u k}=\frac{1}{\left(2 \tau \delta^2\right)^{\frac{\tau}{2}}} e^{\left(-\frac{\left(z-z_{i k}\right)\,\,\,^{\mathrm{T}}\left(z-z_{i k}\,\right)}{2 \delta^2}\,\,\,\,\right)}$ (15)
The size of Puk indicates the probability of each sample belonging to different categories of forest fire identification. Further, the weighted sum of Puk was calculated in the network summation layer of the model. Assuming Bu represents the number of the u-th type of samples, μuk represents the weight of each type of samples, then there is:
$H_u=\sum_{k=1}^{B_u} \mu_{u k} P_{u k}$ (16)
Assuming: J represents the sample tag type, then the final classification decision of forest fire could be given based on the Bayes decision rule of minimum risk, and the calculation formula of the model output layer is:
$T=\underset{1 \leq u \leq J}{\arg \max } H_u$ (17)
The Expectation Conditional Maximization (ECM) algorithm is an iterative algorithm used for parameter optimization of hidden variable models. The ECM algorithm guarantees the convergence of the objective function, that is, as the number of iterations increases, the value of the objective function tends to be stable, and this enables the ECM algorithm to have a better stability when dealing with the parameter optimization problem of PNN models.
Assuming: Z represents the data of dynamic features of suspected forest fire area of the input sample, A represents the data of hidden variable, ϕ=(δ1,δ2,...,δg) represents the model parameter vector to be optimized, O(Z|ϕ) represents the probability distribution of Z, O(Z, A|ϕ) represents the joint probability distribution of Z and A, then the specific implementation steps of the ECM algorithm are:
(1) Set appropriate initial values for parameters in the model, including the initial probability distribution of hidden variable and the probability distribution of observed variable, etc.
(2) Calculate the posterior probability distribution of hidden variable, and then calculate the expectation of logarithmic likelihood function of complete data according to the posterior probability distribution. Assuming ϕy represents the estimated value of parameter ϕ in the y-th iteration, 1gO(Z,A|ϕ) represents the logarithmic likelihood function of complete data, then define function W in step E, that is W(ϕ,ϕy)=AMQ(ϕ,ϕy).
(3) Then, in step CM, decompose the maximization step into multiple sub-steps. In each sub-step, only optimize one parameter or one group of related parameters, while other parameters remain unchanged. Parameters can be updated by solving the maximization sub-problem. Maximize Q(ϕ,ϕy) and find ϕy+1=argmaxQ(ϕ,ϕy). Parameters are divided and represented as ϕ=(ϕ1,ϕ2,...,ϕy), then under constraints, the conditional maximization calculation is performed for m times, and finally the optimal parameters can be attained.
(4) Use the value of ϕy+1 to update ϕy, repeat the calculations in above two steps, and check whether the objective function (such as logarithmic likelihood function) converges; when ||ϕy+1-ϕy|| satisfies the condition, the iteration can be terminated.
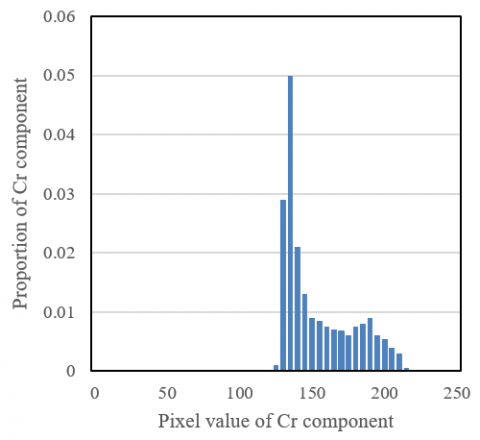
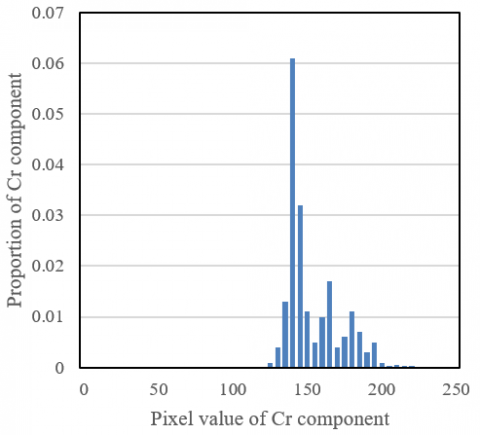
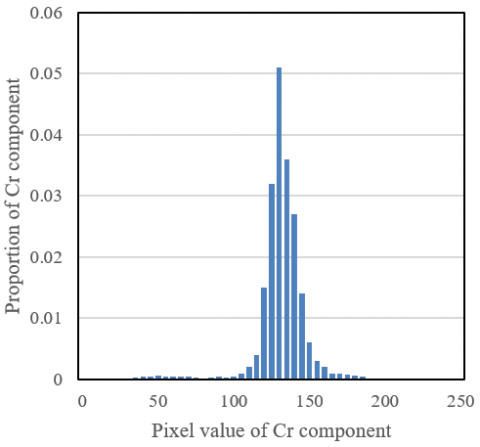
Figure 4. Proportion of Cr component under flame, flame-like substance, and no-fire conditions
In the YCbCr color space, the Cb channel represents the difference between the blue component and the brightness, and the Cr channel represents the difference between the red component and the brightness. Generally, the proportion of Cr component in the flame is higher because there is more red component in the flame; while for flame-like substance and no-fire conditions, the proportion of Cr component in lower. In the meantime, the proportion of Cb component in the flame is lower because there is less blue component in the flame. By analyzing the distribution of Cb and Cr channels, the flame, flame-like substance and no-fire conditions could be distinguished effectively. Figure 4 gives the proportion of Cr component under flame, flame-like substance and no-fire conditions, as can be known from the figure, flame colors usually have high sharpness, and the Cr channel of the YCbCr color space can well describe the red component in the flame, which helps to distinguish flame from other substances.
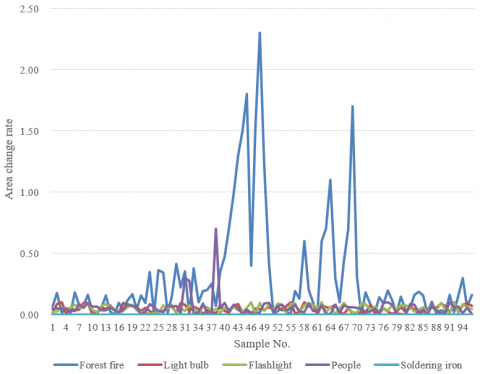
Figure 5. The change of area change rate of suspected forest fire area with frame number
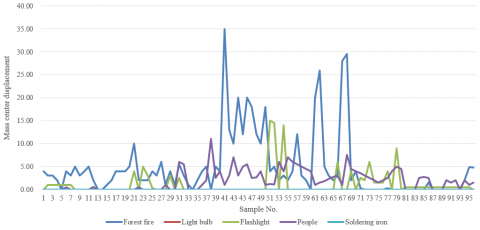
Figure 6. The change of mass center displacement of suspected forest fire area with frame number
Figures 5 and 6 respectively show the variation of area change rate and mass center displacement of suspected forest fire area with the frame number, based on the two figures, by observing and analyzing the data, it can be known that the variation of area change rate and mass center displacement of suspected forest fire area with the frame number is greater than that of light bulb, flashlight, people, and soldering iron, and this phenomenon indicates that the area change rate of suspected forest fire area is an effective dynamic feature that can be used to distinguish fire from other substances. Applying this dynamic feature to fire identification can improve the accuracy of fire detection in real-time. The model can analyze video data captured by cameras in real time, so that fire disasters can be quickly identified and alarms could be sounded at once, then fire fighting and preventive measures could be taken in a timely manner. The experimental results suggest that it is feasible to extract dynamic features from the area change rate and mass center displacement of suspected forest fire area and apply them to fire identification. This method can improve the accuracy and real-time performance of fire detection, and help to deal with fire risks more effectively.
Data in Table 1 give the change rate of image shape parameter of nine samples under three conditions of smoldering fire, flashlight and luminous incandescent light bulb. In terms of smoldering fire, the average change rate of image shape parameter of the nine samples is 0.2846, which is a relatively high value, and this indicates that there are great changes in the shape parameter of the image feature of smoldering fire, and this is related to the heat generated by the fire and the spread of the fire. In terms of flashlight, the average change rate of image shape parameter of the nine samples is 0.0639, which is a relatively low value, indicating that there are significant differences in shape parameter between flashlight and smoldering fire, and this is conductive to distinguishing between fire and non-fire situations. In terms of luminous incandescent light bulb, the average change rate of image shape parameter of the nine samples is 0.0384, which is the lowest, indicating that the change of shape parameter of light bulb is relatively small, which helps to further distinguish fire and non-fire situations. Therefore, by analyzing the change rate of image shape parameter of smoldering fire and interferents, it can be found that the change of shape parameter of smoldering fire is greater, while for flashlight and light bulb, the change is not that big, indicating that the change rate of shape parameter can be taken as an effective feature to assist the identification of fire and non-fire situations under different circumstances, in this way, the accuracy and robustness of the model can be improved further.
Table 1. Change rate of image shape parameter of smoldering forest fire and interferents
|
Sample No. |
Smoldering fire |
Flashlight |
Luminous incandescent light bulb |
|
1 |
0.0738 |
0.0862 |
0.0284 |
|
2 |
0.1383 |
0.0973 |
0.0473 |
|
3 |
0.1836 |
0.1846 |
0.0183 |
|
4 |
0.2947 |
0.0183 |
0.0783 |
|
5 |
0.1836 |
0.0294 |
0.0183 |
|
6 |
0.2463 |
0.1946 |
0.0183 |
|
7 |
0.1823 |
0.0384 |
0.0183 |
|
8 |
0.2946 |
0.0183 |
0.0384 |
|
9 |
0.3862 |
0.0974 |
0.0435 |
|
Mean |
0.2846 |
0.0639 |
0.0384 |
Figure 7. Test effect of improved model
Figure 7 shows the test effect of the improved model. In this study, the infrared images taken by forest fire UAV were tested, and the analysis of test results and test errors shows that, the forest fire identification model built based on improved PNN has high accuracy and robustness in fire detection. The test errors are low, indicating that the proposed model had extracted dynamic and static features that are helpful for fire identification based on the characteristics of infrared images, the distinguishing ability of the model had been enhanced, false alarms and missed alarms had been effectively reduced, and the accuracy of fire identification had been improved.
Figure 8. ROC curves of different models
Figure 8 shows the change of FPR (false positive rate) of different models with the TPR (true positive rate), it can seen that the proposed model had a high TPR and a low FPR in most cases, suggesting that the model can effectively identify fire and reduce false positives. Other models (Naive Bayes, NIR+HMM, CNN, NIR+SVM, and PNN) showed a high FPR in some cases, especially in those with a low TPR, indicating that when attempts are made to improve the fire detection accuracy of these models, a high rate of false positives would show up, while the proposed model could maintain a low FPR over the entire TPR range, indicating better balance and robustness with it. Thus, the proposed model performed well in the trend analysis of FPR with TPR, and it could effectively reduce the rate of false positives while maintaining a high fire identification accuracy.
Table 2. Test performance of different models
|
Model |
Correct rate |
Error rate |
False positive rate |
|
Naive Bayes |
97.84% |
1.54% |
0.86% |
|
NIR+HMM |
98.72% |
1.65% |
1.76% |
|
CNN |
99.74% |
2.98% |
1.56% |
|
NIR+SVM |
96.93% |
1.76% |
2.89% |
|
PNN |
96.91% |
1.26% |
2.58% |
|
The proposed model |
98.73% |
1.12% |
1.65% |
From the Table 2, the test performance of different models could be observed, including correct rate, error rate, and false positive rate, and here is an analysis of the performance of each model. In terms of the Naive Bayes model, although its correct rate reaches 97.84%, its error rate and false positive rate are 1.54% and 0.86%, respectively, so its performance is just average among the various reference models. In terms of the NIR+HMM model, its correct rate is 98.72%, suggesting a high level, but its error rate and false positive rate are 1.65% and 1.76%, both are high. In terms of the CNN model, its performance is the best among all models, the correct rate reaches as high as 99.74%, and its error rate and false positive rate are 2.98% and 1.56%, respectively, the overall performance is good, but the error rate is relatively high. In terms of the NIR+SVM model, its correct rate is 96.93%, a relatively low value, and its error rate and false positive rate are 1.76% and 2.89%, respectively, its performance is the worst among all models. In terms of the PNN model, its correct rate is 96.91%, a relatively low value, its error rate is 1.26%, also relatively low, and its false positive rate is 2.58%, which is relatively high. As for the proposed model, its correct rate is 98.73%, a relatively high value, the error rate is 1.12%, which is the lowest among all model, and its false positive rate is 1.65%, a relatively low value. If correct rate, error rate and false positive rate are considered comprehensively, the performance of the proposed model is the best among all references models, its correct rate is high, error rate is low, and false positive rate is relatively low, indicating that the model exhibited high accuracy and robustness in the fire identification task. Compared with other models, the proposed model could provide more effective support for early warning and response of forest fire.
Table 3. Test sample input vectors and test results
|
Sample No. |
Detected temperature of the target |
Area change rate |
Shape change rate |
Is there a smoldering fire or not? |
Output value |
|
1 |
201.5 |
0.1856 |
0.3829 |
Yes |
0.973635872 |
|
2 |
235.1 |
0.0964 |
0.0738 |
Yes |
0.782734627 |
|
3 |
241.6 |
0.2758 |
0.1874 |
Yes |
0.972253479 |
|
4 |
321.7 |
0.1183 |
0.1836 |
Yes |
0.975237492 |
|
5 |
214.6 |
0.0863 |
0.2957 |
Yes |
0.982646848 |
|
6 |
113.6 |
0.0057 |
0.0973 |
No |
0.002857394 |
|
7 |
132.6 |
0.0012 |
0.0381 |
No |
0.003976834 |
|
8 |
57.8 |
0.0036 |
0.1836 |
No |
0.000176488 |
|
9 |
101.4 |
0.0042 |
0.0973 |
No |
0.002947588 |
|
10 |
113.9 |
0.0124 |
0.0146 |
No |
0.002874968 |
|
11 |
210.4 |
0.0482 |
0.0682 |
No |
0.004743834 |
|
12 |
214.6 |
0.0592 |
0.0246 |
No |
0.392746484 |
|
13 |
219.4 |
0.1948 |
0.0183 |
No |
0.038194694 |
|
14 |
211.5 |
0.0294 |
0.0384 |
No |
0.098326484 |
|
15 |
214.7 |
0.0873 |
0.0184 |
No |
0.019463484 |
The Table 3 lists the input vectors (detected temperature, area change rate, shape change rate, and whether there is a smoldering fire) and corresponding output values of 15 test samples. “Yes” means there is a fire in Samples 1-5, their output values are mostly close to 1 (between 0.78-0.98), indicating that the model had successfully identified these fire samples. As for Samples 6-15, “No” means there isn’t a fire in these samples, and their output values are generally low (between 0.0002-0.39), indicating that the model had successfully identified these non-fire samples. As a result, the proposed model performed well on all test samples, it had accurately identified fire and non-fire samples based on the input vectors (detected temperature, area change rate, shape change rate, and whether there is a smoldering fire), which further verified that the model’s effectiveness and practicability in the forest fire identification task.
This study explored a new method for analyzing infrared images taken by UAV for forest fire monitoring. At first, the hardware structure of a typical forest fire monitoring system was plotted; then, based on the static features (color and texture) and dynamic features (size, location, and shape) of the infrared images, a new algorithm for detecting suspected fire area was proposed and applied to make final judgement on suspected forest fire area; after that, a forest fire identification model was built based on an improved PNN. Through experimental verification, the following conclusions could be drawn:
1. Through data observation and analysis, it is found that the change of dynamic features such as the area change rate of suspected forest fire area with the frame number is greater than that of light bulb, flashlight, people, and soldering iron, and this proves that such dynamic features can be used to distinguish fire from other substances.
2. It is feasible to apply dynamic and static features of suspected forest fire area (such as the area change rate) to fire identification, and this method can improve the accuracy and real-time performance of fire detection and to cope with fire risks more effectively.
3. Compared with other models, the proposed model provides more effective support for the early warning and response of forest fire. Combining with the proposed model, the video data captured by camera can be analyzed in real time, so that the fire could be identified immediately and alarms could be sounded at once.
This study was supported by the Project of Science and Technology of Shenzhen Polytechnic (Grand No.: 6021310025K0).
[1] Chugunkova, A.V., Pyzhev, A.I. (2020). Impacts of global climate change on duration of logging season in Siberian boreal forests. Forests, 11(7): 756. https://doi.org/10.3390/f11070756
[2] Yair, Y. (2018). Lightning hazards to human societies in a changing climate. Environmental Research Letters, 13(12): 123002. https://doi.org/10.1088/1748-9326/aaea86
[3] Nesha, M.K., Herold, M., De Sy, V., Duchelle, A.E., Martius, C., Branthomme, A., Pekkarinen, A. (2021). An assessment of data sources, data quality and changes in national forest monitoring capacities in the Global Forest Resources Assessment 2005–2020. Environmental Research Letters, 16(5): 054029. https://doi.org/10.1088/1748-9326/abd81b
[4] Gelles, R.V., Davis, T.S., Stevens-Rumann, C.S. (2022). Wildfire and forest thinning shift floral resources and nesting substrates to impact native bee biodiversity in ponderosa pine forests of the Colorado Front Range. Forest Ecology and Management, 510: 120087. https://doi.org/10.1016/j.foreco.2022.120087
[5] Romanov, A.A., Tamarovskaya, A.N., Gloor, E., Brienen, R., Gusev, B.A., Leonenko, E.V., Krikunov, E.E. (2022). Reassessment of carbon emissions from fires and a new estimate of net carbon uptake in Russian forests in 2001–2021. Science of The Total Environment, 846: 157322. https://doi.org/10.1016/j.scitotenv.2022.157322
[6] Stevens, N., Bond, W., Feurdean, A., Lehmann, C.E. (2022). Grassy ecosystems in the anthropocene. Annual Review of Environment and Resources, 47: 261-289. https://doi.org/10.1146/annurev-environ-112420-015211
[7] Lapere, R., Mailler, S., Menut, L. (2021). The 2017 mega-fires in central chile: Impacts on regional atmospheric composition and meteorology assessed from satellite data and chemistry-transport modeling. Atmosphere, 12(3): 344. https://doi.org/10.3390/atmos12030344
[8] Yu, M., Liang, S., Dai, Z., Li, Y., Luo, Y., Tang, C., Xu, J. (2021). Plant material and its biochar differ in their effects on nitrogen mineralization and nitrification in a subtropical forest soil. Science of the Total Environment, 763: 143048. https://doi.org/10.1016/j.scitotenv.2020.143048
[9] Orumaa, A., Agan, A., Anslan, S., Drenkhan, T., Drenkhan, R., Kauer, K., Metslaid, M. (2022). Long-term effects of forest fires on fungal community and soil properties along a hemiboreal Scots pine forest fire chronosequence. Science of The Total Environment, 851: 158173. https://doi.org/10.1016/j.scitotenv.2022.158173
[10] Kolanek, A., Szymanowski, M., Raczyk, A. (2021). Human activity affects forest fires: The impact of anthropogenic factors on the density of forest fires in Poland. Forests, 12(6): 728. https://doi.org/10.3390/f12060728
[11] James, J.A., Kern, C.C., & Miesel, J.R. (2018). Legacy effects of prescribed fire season and frequency on soil properties in a Pinus resinosa forest in northern Minnesota. Forest Ecology and Management, 415-416: 47-57. https://doi.org/10.1016/j.foreco.2018.01.021
[12] Tlig, M., Bouchouicha, M., Sayadi, M., Moreau, E. (2022). Infrared-visible images’ fusion techniques for forest fire monitoring. In 2022 6th International Conference on Advanced Technologies for Signal and Image Processing (ATSIP), Sfax, Tunisia, pp. 1-6. https://doi.org/10.1109/ATSIP55956.2022.9805812
[13] Velizarova, E., Nedkov, R., Avetisyan, D., Radeva, K., Stoyanov, A., Georgiev, N., Gigova, I. (2019). Application of remote sensing techniques for monitoring of the climatic parameters in forest fire vulnerable regions in Bulgaria. In Seventh International Conference on Remote Sensing and Geoinformation of the Environment (RSCy2019), 11174, 451-462. https://doi.org/10.1117/12.2533656
[14] Abdusalomov, A.B., Islam, B.M.S., Nasimov, R., Mukhiddinov, M., Whangbo, T. K. (2023). An improved forest fire detection method based on the detectron2 model and a deep learning approach. Sensors, 23(3): 1512. https://doi.org/10.3390/s23031512
[15] Costa, D., Sutter, C., Shepherd, A., Jarvie, H., Wilson, H., Elliott, J., Macrae, M. (2022). Impact of climate change on catchment nutrient dynamics: insights from around the world. Environmental Reviews. 31(1): 4-25. https://doi.org/10.1139/er-2021-0109
[16] Filizzola, C., Corrado, R., Marchese, F., Mazzeo, G., Paciello, R., Pergola, N., Tramutoli, V. (2016). RST-FIRES, an exportable algorithm for early-fire detection and monitoring: Description, implementation, and field validation in the case of the MSG-SEVIRI sensor. Remote Sensing of Environment, 186: 196-216. https://doi.org/10.1016/j.rse.2016.08.008
[17] Marcos, B., Gonçalves, J., Alcaraz-Segura, D., Cunha, M., Honrado, J.P. (2023). Assessing the resilience of ecosystem functioning to wildfires using satellite-derived metrics of post-fire trajectories. Remote Sensing of Environment, 286: 113441. https://doi.org/10.1016/j.rse.2022.113441
[18] Bouguettaya, A., Zarzour, H., Taberkit, A.M., Kechida, A. (2022). A review on early wildfire detection from unmanned aerial vehicles using deep learning-based computer vision algorithms. Signal Processing, 190: 108309. https://doi.org/10.1016/j.sigpro.2021.108309
[19] Liu, W., Yang, Y., Hao, J. (2022, May). Design and research of a new energy-saving UAV for forest fire detection. In 2022 IEEE 2nd International Conference on Electronic Technology, Communication and Information (ICETCI), Changchun, China, pp. 1303-1316. https://doi.org/10.1109/ICETCI55101.2022.9832311
[20] Nihei, K., Kai, N., Maruyama, Y., Yamashita, T., Kanetomo, D., Kitahara, T., Segah, H. (2022). Forest Fire Surveillance using Live Video Streaming from UAV via Multiple LTE Networks. In 2022 IEEE 19th Annual Consumer Communications & Networking Conference (CCNC), Las Vegas, NV, USA, pp. 465-468. https://doi.org/10.1109/CCNC49033.2022.9700621
[21] Yandouzi, M., Grari, M., Berrahal, M., Idrissi, I., Moussaoui, O., Azizi, M., Elmiad, A.K. (2023). Investigation of combining deep learning object recognition with drones for forest fire detection and monitoring. International Journal of Advanced Computer Science and Applications, 14(3): 377-384.