Nawanol Theera-Ampornpunt![]() | Panisa Treepong*
| Panisa Treepong*![]()
© 2023 IIETA. This article is published by IIETA and is licensed under the CC BY 4.0 license (http://creativecommons.org/licenses/by/4.0/).
OPEN ACCESS
Automated food logging is an essential component of modern dietary management, and food recognition plays a crucial role in this process. However, the recognition of dishes and food items unique to specific cultures or regions remains a less explored area. In this study, we focus on the automatic recognition of Thai cuisine, employing transfer learning techniques and comparing the performance of 20 state-of-the-art convolutional neural networks. We investigate the impact of hyperparameters, such as batch size and image resolution, as well as image preprocessing methods on classification accuracy and training time for the top-performing models. Our evaluation, using the THFOOD-50 dataset consisting of 15,688 images across 50 classes, demonstrates that the optimal model achieves top-1 and top-5 classification accuracies of 90.44% and 99.97%, respectively, representing a significant improvement over previous results. We find that increasing image resolution substantially enhances accuracy, while batch size exerts a negligible effect. Moreover, cropping the edges of images can further improve accuracy, but this technique is only effective when employing low image resolution. Our findings contribute to the development of advanced food recognition algorithms, with potential applications in dietary management and nutrition planning.
food computing, image recognition, object recognition, Thai food
Food logging or journaling, the practice of recording consumed food types and quantities, offers numerous benefits. It enables users to track calorie and nutrient intake, which is particularly valuable for weight management, managing medical conditions (e.g., diabetes), and maintaining a balanced diet. Food logs can also help users identify foods that trigger issues such as irritable bowel syndrome or allergies and optimize eating habits by examining meal timing and frequency. While consumers generally know what they eat, manually logging food intake can be cumbersome, even with smart mobile applications. Barcode scanning offers a solution for packaged products but fails to address homemade meals or restaurant dishes. Consequently, an automatic food labeling system based on food images would greatly enhance convenience and support healthier lifestyles.
Our focus is on food recognition, rather than the estimation of consumed amounts, which is challenging to determine from images alone. We concentrate on Thai cuisine, a less explored area in food recognition, necessitating a large, labeled food image database for model training. We employ Convolutional Neural Networks (CNNs), a class of artificial neural networks well-suited for classifying images, videos, and audio, as our classification model. Food recognition can be considered a subtask of object recognition, where many models have been created and improved. However, food images typically represent a small subset of object classes in datasets, and generating highly accurate models requires a vast dataset. Publicly available food recognition datasets, especially those focused on Thai food, do not yet meet this criterion. Thus, we utilize transfer learning to adapt state-of-the-art models pretrained on larger object recognition datasets to our task.
While transfer learning has been successfully implemented in food image classification models, previous works often evaluate only a few models, overlooking key factors such as preprocessing methods, image resolution, and hyperparameter tuning. Our study aims to bridge this research gap through extensive model comparison and exploration of how model hyperparameters, image resolution, and preprocessing methods affect performance. We achieve a 90.44% top-1 accuracy on the THFOOD-50 dataset, demonstrating that higher image resolutions significantly improve classification accuracy, while batch size has a minimal effect. We also find that edge cropping is beneficial at low image resolutions but detrimental at higher resolutions.
The remainder of the paper is organized as follows: Section 2 presents the literature review. Section 3 describes the dataset, models, and methods used in the study. Section 4 evaluates the proposed method and presents the results. Conclusions are provided in Section 5.
Automatic object recognition and image classification have been extensively researched, with numerous successful models developed and refined. Notable networks include AlexNet [1], VGGNet [2], ResNet [3], InceptionV3 [4], MobileNet [5], GoogLeNet [6], and DenseNet [7]. Advanced object detection methods, such as Faster R-CNN [8] and YOLOv7 [9], combine object recognition and localization tasks. Pretrained versions of these networks on comprehensive public datasets like ImageNet [10] can be directly applied to tasks with labels overlapping with the original dataset or indirectly via transfer learning when labels differ. CNNs have been employed for image classification and object detection across various domains, including medical image classification [11, 12], plant disease recognition [13-15], face recognition [16], and document classification [17, 18].
Previous research on automated food image recognition has leveraged state-of-the-art CNN models trained on specific food datasets [19-25], consistently employing transfer learning to enhance prediction accuracy. These studies typically evaluate a limited number of CNN models, providing little insight into the performance of alternative models. Moreover, they often neglect the time-consuming process of hyperparameter optimization, omitting valuable information on how hyperparameters impact results and optimal values. Critical factors like preprocessing methods and image resolution are also rarely investigated.
Our work addresses these gaps by focusing on model comparison and hyperparameter optimization, streamlining further research in this area. As food is region and culture-specific, it is vital to collect and make publicly available datasets from around the world to develop accurate models for each region. A survey of datasets [26] reveals a lack of datasets for many regions, including Thailand. Currently, the only publicly available Thai food image dataset is THFOOD-50 [27], containing 15,688 images across 50 classes. We use this dataset to build and evaluate our models, extending the work done in studies [27-29] by applying, comparing, and optimizing recent state-of-the-art models. Our findings are expected to be applicable to other datasets and tasks due to the similarities in food image patterns across cultures.
In this work we aim to achieve highest prediction accuracy possible using existing models and datasets. This is done by finding the best way to preprocess the images, finding the best model for the task, and optimizing the important model hyperparameters.
3.1 Dataset
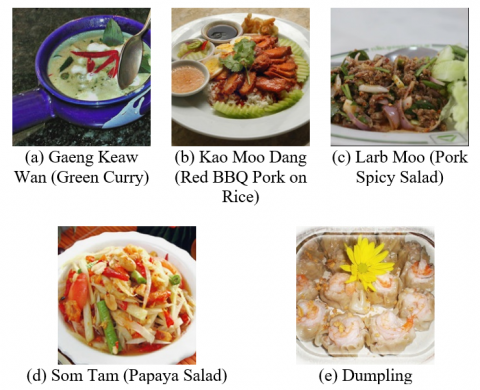
Figure 1. Examples of images in the THFOOD-50 dataset
We use THFOOD-50 dataset [27] to train and evaluate models. It contains 15,688 images of Thai food in 50 classes, chosen from commonly consumed dishes in Thailand. Only dishes generally consumed as main courses are included. The images were collected from the Internet using three search engines: Google, Bing, and Flickr. Each image contains only a single dish. Each class contains 183 to 677 images. The images are in their original resolution, which allows us to evaluate the models at multiple resolutions. The dataset is already divided into training and test sets, in 90:10 ratio. We further divide the training set into a smaller training set and validation set in 70:20 ratio to find the optimal number of training epochs. Examples of images are shown in Figure 1.
3.2 Preprocessing
Images in the THFOOD-50 dataset has already been labeled and prepared. The only preprocessing steps necessary are cropping and/or resizing the images. All models evaluated in this work support arbitrary image sizes, as long as they are not too small. However, as all of the models are designed for and trained on square-shaped images, we first center-crop all images to have a square shape. The images are then optionally further edge cropped before they are resized to the size expected by the models.
3.3 Models
Many CNN models have been introduced in recent years. One of the most commonly used datasets to benchmark these models is ImageNet [10] which is much larger than the THFOOD-50 dataset. While the patterns found in images of nature and everyday objects in ImageNet may have some similarities with those found in images of food, there are still significant differences. As a result, classification accuracy or ranking of models in food recognition task cannot be directly inferred from their results in the object recognition task. Therefore, we aim to include as many state-of-the-art models as possible in the comparison. The details of the models are shown in Table 1.
Table 1. State-of-the-art models included in the comparison
|
Model |
Number of parameters |
|
MobileNet [5] |
3.2M |
|
MobileNetV2 [30] |
2.3M |
|
MobileNetV3Small [31] |
0.9M |
|
MobileNetV3Large [31] |
3.0M |
|
NASNetMobile [32] |
4.3M |
|
EfficientNetV2B0 [33] |
5.9M |
|
EfficientNetV2B1 [33] |
6.9M |
|
EfficientNetV2B2 [33] |
8.8M |
|
EfficientNetV2B3 [33] |
12.9M |
|
EfficientNetV2S [33] |
20.3M |
|
DenseNet121 [7] |
7.0M |
|
RegNetX016 [34] |
7.9M |
|
RegNetY016 [34] |
9.9M |
|
RegNetX032 [34] |
14.4M |
|
RegNetY032 [34] |
18.0M |
|
Xception [35] |
20.9M |
|
InceptionV3 [4] |
21.8M |
|
ResNet50 [3] |
23.6M |
|
ResNet50V2 [36] |
23.6M |
|
InceptionResNetV2 [37] |
51.8M |
Figure 2. Two-step model training process
All models used are pre-trained using ImageNet dataset, with the weights fixed. A 2D global average pooling layer is put on top of the base model, followed by a dropout layer with dropout rate of 0.2, before the output layer with 50 classes in one-hot encoding format. The loss function used is categorical cross entropy loss. Training is done with Adam optimizer with default parameters. Each time any model is evaluated, the number of training epochs is set using the following two-step process:
1. The model is first trained using the training set and validated using the validation set until the validation loss no longer improves for 10 consecutive epochs. The epoch with the lowest validation loss, averaged over a window of 5 epochs, is recorded.
2. The model is trained from scratch again using the training set and validation set combined, and tested using the test set, using the number of epochs from step 1.
A diagram of the process is shown in Figure 2. This process ensures that the optimal number of epochs is used for all models in all settings, as we have empirically found that the optimal value varies significantly between different settings and across models.
4.1 Experiment setup
The classification accuracy of the models is evaluated using the THFOOD-50 dataset. The TensorFlow library is used to process data, train, and test all the models. The main evaluation metrics are top-1 and top-5 accuracy on the test dataset, defined as the number of images that are correctly classified divided by the total number of images, where the prediction is considered correct if any of the top 1 and 5 classes, respectively, matches the correct label. The experiments are run on a computer with Intel Core i5-12400F CPU, 64 GB of memory, and Nvidia GeForce RTX 3090 GPU, running Ubuntu 22.10 operating system.
We design 4 experiments, with the goal of each being finding the optimal value of a hyperparameter or an aspect of the model, as follows:
Experiment 1: Finding the best model
Experiment 2: Optimizing batch size
Experiment 3: Optimizing input image resolution
Experiment 4: Removing edges of images
4.2 Experiment 1: Finding the best model
First, we compare different classification models in their default settings described in Section 3.3. The batch size is fixed at 256 and the input image resolution is 448×448. Edge cropping is not performed. The results are shown in Table 2.
Table 2. Comparison of state-of-the-art models
|
Model |
Top-1 accuracy |
Top-5 accuracy |
Training time (s) |
|
MobileNet |
81.50% |
99.18% |
447 |
|
MobileNetV2 |
80.87% |
99.50% |
510 |
|
MobileNetV3Small |
85.37% |
98.73% |
441 |
|
MobileNetV3Large |
89.56% |
99.81% |
340 |
|
NASNetMobile |
70.38% |
97.23% |
1,632 |
|
EfficientNetV2B0 |
89.56% |
99.84% |
624 |
|
EfficientNetV2B1 |
89.00% |
99.93% |
825 |
|
EfficientNetV2B2 |
89.31% |
99.89% |
769 |
|
EfficientNetV2B3 |
90.44% |
99.97% |
1,109 |
|
EfficientNetV2S |
89.31% |
99.89% |
1,644 |
|
DenseNet121 |
85.69% |
98.67% |
2,338 |
|
RegNetX016 |
86.06% |
99.38% |
3,992 |
|
RegNetY016 |
88.00% |
99.40% |
2,767 |
|
RegNetX032 |
87.94% |
99.57% |
8,023 |
|
RegNetY032 |
88.50% |
99.72% |
3,450 |
|
Xception |
83.81% |
99.75% |
2,464 |
|
InceptionV3 |
79.94% |
99.38% |
1,168 |
|
ResNet50 |
86.50% |
99.94% |
1,427 |
|
ResNet50V2 |
82.44% |
99.64% |
790 |
|
InceptionResNetV2 |
83.31% |
99.21% |
3,497 |
Focusing on top-1 accuracy, there is considerable variation among the models. EfficientNetV2B3 performs the best, achieving top-1 accuracy of over 90% and top-5 accuracy close to 100%. All models produce good top-5 accuracy. This indicates that most models generally make correct classifications, and when they are incorrect, the correct label is still in the top 5 labels in vast majority of cases.
For the remaining experiments, we only include the top model and models that achieve accuracy close to the top model. These models are MobileNetV3Large, EfficientNetV2B0, EfficientNetV2B1, EfficientNetV2B2, EfficientNetV2B3, and EfficientNetV2S. In addition, as top-5 accuracy of these models is very similar and close to 100%, we will focus only on top-1 accuracy as the benchmark metric.
4.3 Experiment 2: Optimizing batch size
During training, images are grouped into batches and all images in each batch is processed before the network’s weights are updated. Higher batch size has an averaging effect which can prevent overfitting, or cause underfitting if it is too high. When training using accelerators such as GPUs, it also enables a higher degree of parallelization, leading to lower training time per epoch. However, the number of epochs needed could be higher. Larger batches also require more memory on accelerators. We vary the batch size from 32 to 512. The results are shown in Figure 3.
Overall, batch size’s effect on top-1 accuracy is small, with less than 1% variation within each model. There is no clear trend, but on average, increasing batch size slightly increases accuracy, up to batch size of 256. Batch size of 512 produces slightly lower accuracy. EfficientNetV2B3 achieves highest accuracy at all batch sizes.
On the other hand, batch size’s effect on training time is large. Although higher batch sizes increase GPU utilization and thus lower training time per epoch, the optimal numbers of epochs are much larger. The end result is that higher batch sizes increase training time. The takeaway is that the batch size that gives lowest training time can be chosen without worrying about classification accuracy. Since batch size of 256 produces highest top-1 accuracy on average, we use this value for the remaining experiments.
Figure 3. How batch size affect top-1 accuracy (top) and training time (bottom)
4.4 Experiment 3: Optimizing input image resolution
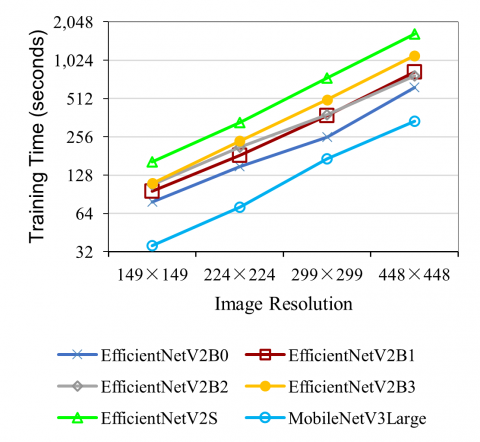
While images may come in any resolution, each trained CNNs model can only work with images of a single, fixed resolution. Fortunately, all models used in this work allow us to choose any resolution when building the model architecture. Higher resolution images provide more detail while significantly increasing computational requirements including computation time, main memory, and GPU memory, during both training and prediction phases. This is because an image with double the height and width contains four times the number of pixels, and this number is generally proportional to the computational requirements. Therefore, a tradeoff is often necessary. All models are pretrained using 224×224 images in the ImageNet dataset. We vary the image resolution from 149×149 to 448×448. The results are shown in Figure 4.
Figure 4. How image resolution affect accuracy (top) and training time (bottom)
The results show that image resolution has a significant impact on accuracy, especially on the lower end, with higher resolution always resulting in higher accuracy regardless of model. Although the top model can still achieve 81% accuracy with lowest image resolution of 149×149, a small percentage of images do not contain enough detail at this resolution, so higher resolution is required. The improvement from increasing image resolution is not the same for all models, however. At 149×149 and 224×224, EfficientNetV2B1 performs best. At 299×299 and 448×448 however, EfficientNetV2B3 achieves the highest accuracy. This is due to the fact that more complex models are better able to capture the detailed patterns in higher image resolutions, but they suffer from overfitting at lower image resolutions. Therefore, image resolution should be taken into account when making the choice of which CNN model to use.
Training time increases roughly proportionally to the size of the images. The effect is similar for all models. Interestingly, increasing image resolution only slightly increases the optimal number of epochs.
4.5 Experiment 4: Removing edges of images
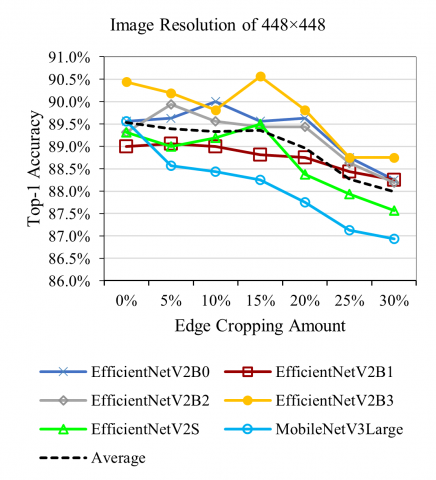
In an image of food, regions with actual food are typically in the center, while the edges often contain the food container such as a plate, or irrelevant background. Removing the edges of an image before it is resized to a specific resolution can therefore indirectly improve the resolution of the regions of actual food. However, removing too much edge may result in important regions missing from the image. We vary the amount of edges of image to remove from 0% to 30% in increments of 5%. The removal amount indicated applies to both the height and the width of the image. For example, a 1000×1000 image becomes 850×850 with 15% edge removal, before it is resized to the resolution expected by the model. The results are shown in Figure 5.
This experiment is performed at two image resolutions, 224×224 and 448×448, because there is an interrelation between image resolution, edge cropping amount, and top-1 accuracy. At image resolution of 224×224, the trend is different for each model, but on average, edge cropping does improve classification accuracy. The optimal edge cropping amount is 20%. On the other hand, at image resolution of 448×448, the general trend is that the higher the edge cropping amount, the lower the accuracy. The likely explanation for this is that image resolution of 448×448 is already high enough for the models to capture the fine details. Cropping edges of images may remove important information from some images, while the increased detail of the remaining portion does not improve accuracy much. Therefore, image cropping should be considered when using low resolution images, taking into account the parts of the image providing essential information for the particular task.
To summarize the results from all experiments, higher classification accuracy for image resolution of 448×448 is achieved with the EfficientNetV2B3 model, at 90.44% and 99.97% top-1 and top-5 accuracy, respectively, using batch size of 256 and no edge cropping. The best result for image resolution of 224×224 is achieved with the EfficientNetV2B1 model, at 87.44% and 99.88% top-1 and top-5 accuracy, respectively, using batch size of 256 and 20% edge cropping.
4.6 Discussion
The best previous results on the THFOOD-50 dataset are obtained by Termritthikun and Kanprachar, with top-1 and top-5 accuracy of 83.07% and 97.04%, respectively, using 224×224 image resolution [29]. Our best model lowers the top-1 error rate by 25.81% using the same image resolution. With higher resolution of 448×448, the top-1 error rate is lower by 43.53%. Very high top-5 accuracy means that when used in a mobile food logging application, the user can choose the correct food label from a list of 5 labels, in the case that the top label is incorrect. While there may be further room of improvement with better models and preprocessing techniques, significant gains will likely require larger datasets.
Our results also provide rough guidelines for choosing and tuning a model for the food recognition task. The EfficientNetV2 series of models work particularly well for this dataset. While other (generally larger) models perform better on the large ImageNet dataset, smaller models are better suited for smaller datasets such as the one for this task. Batch size only has a small effect on accuracy, with the optimal amount likely depending on the dataset. It is important to note that models trained using lower batch size converges faster, leading to lower overall training time.
Figure 5. How removing edge of images affect accuracy
Image resolution significantly impacts classification accuracy as well as computational requirements. Resolution of 224×224, typically used in image classification research, is not enough to provide optimal accuracy. Therefore, higher resolution should always be used as long as hardware and the computational budget permit. When low image resolution (such as 224×224) is unavoidable, edge cropping can help indirectly increase resolution by removing unimportant parts of the images, which are often the edges of the images. These guidelines can be applied when using convolutional neural networks in other image classification tasks as well.
This paper proposes a method for automatically recognizing Thai food from image, which is essential for automated food logging. In the model training pipeline, there are many important choices to be made, including CNN model, model hyperparameters, preprocessing method, image resolution, and image cropping. These choices have a large impact on the results, so it is important to optimize them. Previous studies on this task do not focus on this aspect, so the aim of this study is to make an extensive comparison of these choices to provide some guidelines for further research.
We evaluated 20 state-of-the-art CNN models on the THFOOD-50 dataset and were able to achieve 90.44% top-1 accuracy using transfer learning and by tuning batch size and image resolution. The important findings are as follows: there is a significant variation of the prediction accuracy of the CNN models. Overall, models that work well for the task include MobileNetV3Large, EfficientNetV2 group, and RegNet group of models, with smaller models being better at lower resolution and larger models being better at higher resolution. We found that image resolution significantly effects classification accuracy, but batch size does not. However, higher resolution requires more computational power and memory, proportional to image size. When using lower image resolution such as 224×224, classification accuracy can be improved by cropping edges of images, with 20% cropping being optimal for this dataset. The reason behind this is that in images of food, actual food is usually in the middle, while the edges do not contain useful information. Cropping the edges essentially increases the resolution of the important parts. At higher resolution however, edge cropping actually reduces classification accuracy, because it removes important information in a small portion of the images, and the effective increase of resolution is no longer as beneficial. We hope to see more studies placing a greater emphasis on model comparison, hyperparameter tuning, and image resolution, as they can have a large impact on the prediction performance and give us insights about the models and the task, potentially leading to ideas for further improvements.
This work is supported by the College of Computing, Prince of Songkla University (Grant Number COC6604032S).
[1] Krizhevsky, A., Sutskever, I., Hinton, G.E. (2017). Imagenet classification with deep convolutional neural networks. Communications of the ACM, 60(6): 84-90. https://doi.org/10.1145/3065386
[2] Simonyan, K., Zisserman, A. (2014). Very deep convolutional networks for large-scale image recognition. arXiv preprint arXiv:1409.1556. https://doi.org/10.48550/arXiv.1409.1556
[3] He, K., Zhang, X., Ren, S., Sun, J. (2016). Deep residual learning for image recognition. Proceedings of the IEEE Conference on Computer Vision and Pattern Recognition, Vegas, NV, USA, pp. 770-778. https://doi.org/10.1109/cvpr.2016.90
[4] Szegedy, C., Vanhoucke, V., Ioffe, S., Shlens, J., Wojna, Z. (2016). Rethinking the inception architecture for computer vision. Proceedings of the IEEE Conference on Computer Vision and Pattern Recognition, Vegas, NV, USA, pp. 2818-2826. https://doi.org/10.1109/cvpr.2016.308
[5] Howard, A.G., Zhu, M., Chen, B., Kalenichenko, D., Wang, W., Weyand, T., Andreetto, M., Adam, H. (2017). MobileNets: Efficient convolutional neural networks for mobile vision applications. arXiv Preprint arXiv:1704.04861. https://doi.org/10.48550/arXiv.1704.04861
[6] Szegedy, C., Liu, W., Jia, Y., Sermanet, P., Reed, S., Anguelov, D., Erhan, D., Vanhoucke, V., Rabinovich, A. (2015). Going deeper with convolutions. Proceedings of the IEEE Conference on Computer Vision and Pattern Recognition, Boston, MA, USA, pp. 1-9. https://doi.org/10.1109/cvpr.2015.7298594
[7] Huang, G., Liu, Z., Van Der Maaten, L., Weinberger, K.Q. (2017). Densely connected convolutional networks. Proceedings of the IEEE Conference on Computer Vision and Pattern Recognition, Honolulu, HI, USA, pp. 4700-4708. https://doi.org/10.1109/cvpr.2017.243
[8] Ren, S., He, K., Girshick, R., Sun, J. (2015). Faster R-CNN: Towards real-time object detection with region proposal networks. Advances in Neural Information Processing Systems, 28.
[9] Wang, C.Y., Bochkovskiy, A., Liao, H.Y.M. (2022). YOLOv7: Trainable bag-of-freebies sets new state-of-the-art for real-time object detectors. arXiv preprint arXiv:2207.02696. https://doi.org/10.48550/arXiv.2207.02696
[10] Deng, J., Dong, W., Socher, R., Li, L.J., Li, K., Fei-Fei, L. (2009). ImageNet: A large-scale hierarchical image database. 2009 IEEE Conference on Computer Vision and Pattern Recognition, Miami, FL, USA, pp. 248-255. https://doi.org/10.1109/CVPR.2009.5206848
[11] Wajeed, M.A., Sreenivasulu, V. (2019). Image based tumor cells identification using convolutional neural network and auto encoders. Traitement du Signal, 36(5): 445-453. https://doi.org/10.18280/ts.360510
[12] Mohammedhasan, M., Uğuz, H. (2020). A new early stage diabetic retinopathy diagnosis model using deep convolutional neural networks and principal component analysis. Traitement du Signal, 37(5): 711-722. https://doi.org/10.18280/ts.370503
[13] Mao, C.Z., Meng, W.L., Shi, C,Y., Wu, C.C., Zhang, J. (2020). A crop disease image recognition algorithm based on feature extraction and image segmentation. Traitement du Signal, 37(2): 341-346. https://doi.org/10.18280/ts.370221
[14] Yadav, D., Yadav, A.K. (2020). A novel convolutional neural network based model for recognition and classification of apple leaf diseases. Traitement du Signal, 37(6): 1093-1101. https://doi.org/10.18280/ts.370622
[15] Bayram, H.Y., Bingol, H., Alatas, B. (2022). Hybrid deep model for automated detection of tomato leaf diseases. Traitement du Signal, 39(5): 1781-1787. https://doi.org/10.18280/ts.390537
[16] Huang, Y., Wang, Y., Tai, Y., Liu, X., Shen, P., Li, S., Li, J., Huang, F. (2020). Curricularface: adaptive curriculum learning loss for deep face recognition. Proceedings of the IEEE/CVF Conference on Computer Vision and Pattern Recognition, Seattle, WA, USA, pp. 5901-5910. https://doi.org/10.1109/cvpr42600.2020.00594
[17] Akhter, M.P., Jiangbin, Z., Naqvi, I.R., Abdelmajeed, M., Mehmood, A., Sadiq, M.T. (2020). Document-level text classification using single-layer multisize filters convolutional neural network. IEEE Access, 8: 42689-42707. https://doi.org/10.1109/access.2020.2976744
[18] Banerjee, I., Ling, Y., Chen, M.C., Hasan, S.A., Langlotz, C.P., Moradzadeh, N., Chapman, B., Amrhein, T., Mong, D., Rubin, D.L., Farri, O., Lungren M.P. (2019). Comparative effectiveness of convolutional neural network (CNN) and recurrent neural network (RNN) architectures for radiology text report classification. Artificial Intelligence in Medicine, 97: 79-88. https://doi.org/10.1016/j.artmed.2018.11.004
[19] Sahoo, D., Hao, W., Ke, S., Wu, X., Le, H., Achananuparp, P., Lim, E.P., Hoi, S.C. (2019). FoodAI: Food image recognition via deep learning for smart food logging. Proceedings of the 25th ACM SIGKDD International Conference on Knowledge Discovery & Data Mining, pp. 2260-2268. https://doi.org/10.1145/3292500.3330734
[20] Jiang, L., Qiu, B., Liu, X., Huang, C., Lin, K. (2020). DeepFood: Food image analysis and dietary assessment via deep model. IEEE Access, 8: 47477-47489. https://doi.org/10.1109/access.2020.2973625
[21] Ciocca, G., Napoletano, P., Schettini, R. (2016). Food recognition: A new dataset, experiments, and results. IEEE Journal of Biomedical and Health Informatics, 21(3): 588-598. https://doi.org/10.1109/jbhi.2016.2636441
[22] He, H., Kong, F., Tan, J. (2015). DietCam: Multiview food recognition using a multikernel SVM. IEEE Journal of Biomedical and Health Informatics, 20(3): 848-855. https://doi.org/10.1109/jbhi.2015.2419251
[23] Pouladzadeh, P., Shirmohammadi, S. (2017). Mobile multi-food recognition using deep learning. ACM Transactions on Multimedia Computing, Communications, and Applications (TOMM), 13(3s): 1-21. https://doi.org/10.1145/3063592
[24] Min, W., Wang, Z., Liu, Y., Luo, M., Kang, L., Wei, X., Wei, X., Jiang, S. (2021). Large scale visual food recognition. arXiv preprint arXiv:2103.16107. https://doi.org/10.48550/arXiv.2103.16107
[25] Mao, R., He, J., Shao, Z., Yarlagadda, S.K., Zhu, F. (2021). Visual aware hierarchy based food recognition. International Conference on Pattern Recognition, pp. 571-598. Springer, Cham. https://doi.org/10.1007/978-3-030-68821-9_47
[26] Tahir, G.A., Loo, C.K. (2021). A comprehensive survey of image-based food recognition and volume estimation methods for dietary assessment. Healthcare, 9(12): 1676. https://doi.org/10.3390/healthcare9121676
[27] Termritthikun, C., Muneesawang, P., Kanprachar, S. (2017). NU-InNet: Thai food image recognition using convolutional neural networks on smartphone. Journal of Telecommunication, Electronic and Computer Engineering (JTEC), 9(2-6): 63-67.
[28] Termritthikun, C., Kanprachar, S. (2017). Accuracy improvement of Thai food image recognition using deep convolutional neural networks. 2017 International Electrical Engineering Congress (IEECON), Pattaya, Thailand, pp. 1-4. https://doi.org/10.1109/IEECON.2017.8075874
[29] Termritthikun, C., Kanprachar, S. (2018). Nu-ResNet: Deep residual networks for Thai food image recognition. Journal of Telecommunication, Electronic and Computer Engineering (JTEC), 10(1-4): 29-33.
[30] Sandler, M., Howard, A., Zhu, M., Zhmoginov, A., Chen, L.C. (2018). MobileNetV2: Inverted residuals and linear bottlenecks. Proceedings of the IEEE Conference on Computer Vision and Pattern Recognition, Lake City, UT, USA, pp. 4510-4520. https://doi.org/10.1109/cvpr.2018.00474
[31] Howard, A., Sandler, M., Chu, G., Chen, L.C., Chen, B., Tan, M., Wang, W., Zhu, Y., Pang, R., Vasudevan, V., Le, Q.V., Adam, H. (2019). Searching for MobileNetV3. Proceedings of the IEEE/CVF International Conference on Computer Vision (ICCV), Seoul, Korea (South), pp. 1314-1324. https://doi.org/10.1109/iccv.2019.00140
[32] Zoph, B., Vasudevan, V., Shlens, J., Le, Q.V. (2018). Learning transferable architectures for scalable image recognition. Proceedings of the IEEE Conference on Computer Vision and Pattern Recognition, Salt Lake City, UT, USA, pp. 8697-8710. https://doi.org/10.1109/cvpr.2018.00907
[33] Tan, M., Le, Q. (2021). EfficientNetV2: Smaller models and faster training. International Conference on Machine Learning, pp. 10096-10106. https://doi.org/10.48550/arXiv.2104.00298
[34] Radosavovic, I., Kosaraju, R.P., Girshick, R., He, K., Dollár, P. (2020). Designing network design spaces. Proceedings of the IEEE/CVF Conference on Computer Vision and Pattern Recognition, Seattle, WA, USA, pp. 10428-10436. https://doi.org/10.1109/cvpr42600.2020.01044
[35] Chollet, F. (2017). Xception: Deep learning with depthwise separable convolutions. Proceedings of the IEEE Conference on Computer Vision and Pattern Recognition, Honolulu, HI, USA, pp. 1251-1258. https://doi.org/10.1109/cvpr.2017.195
[36] He, K., Zhang, X., Ren, S., Sun, J. (2016). Identity mappings in deep residual networks. European Conference on Computer Vision, pp. 630-645. Springer, Cham. https://doi.org/10.1007/978-3-319-46493-0_38
[37] Szegedy, C., Ioffe, S., Vanhoucke, V., Alemi, A.A. (2017). Inception-v4, Inception-ResNet and the impact of residual connections on learning. Proceeding of the Thirty-First AAAI Conference on Artificial Intelligence, 31(1). https://doi.org/10.1609/aaai.v31i1.11231