Ranjani Mohan*![]() | Supraja Perumal
| Supraja Perumal![]()
© 2023 IIETA. This article is published by IIETA and is licensed under the CC BY 4.0 license (http://creativecommons.org/licenses/by/4.0/).
OPEN ACCESS
Electroencephalography (EEG) is a test performed to assess the electrical signals spontaneously produced during brain activities. In recent years, it is popularly used for studying both normal and pathological changes occurring in the human brain. With the World Health Organization (WHO) listing psychological disorders as a major health issue faced by the modern society, the current work focuses on this niche. It categorizes cognitive impairment like depression and anxiety using a computer-aided machine learning approach called Convolutional Neural Network. The deep CNN is trained using EEG signals from 30 patients suffering from depression and 30 others suffering from anxiety. Initially, the signal is preprocessed using Fractional Order Butterworth Filter (FOBF). The work considers the occurrence of ultra-damped, hyper-damped, and under-damped poles while designing a FOBF in a composite w-plane (w=sq; where, q is a real number). As usually executed for integer order filters in a composite w-plane, the primary initial fractional Butterworth filter is employed. The characteristics of each electrode's gamma, theta, delta, beta, alpha, and full-band EEG are then analyzed. This results in the removal of 270 nonlinear and linear characteristics. The feature space’s dimensions are then reduced using a feature selection approach called Minimal-Redundancy-Maximal-Relevance (MRMR). The EEG characteristics are finally categorized by utilizing the suggested deep CNN, Artificial Neural Network (ANN) and K-Nearest Neighbor (KNN). The accuracy of classification of the proposed approach is evaluated and found to be 97.6%. This shows it is promising for detecting depression and anxiety symptoms accurately and cost-effectively.
detection, depression, anxiety, EEG signal, CNN, classification, brain, cognitive disorders
The brain is a vital organ that enables an individual to communicate, think rationally, make moral decisions, and be creative. It is liable for a person's actions, memories, character, and insight on the universe. Additionally, it also oversees the insensate physiological processes like breathing and digestion. It is a large organ with over 100 billion nerve cells that harmonize bodily activities. Emotions play a strong role in in the daily lives of human beings. Rash emotions lead to cognitive disorders, of which the two common ones are anxiety or depression.
These disorders change the electrical and chemical processes in the brain. Researchers monitor these variations by obtaining images and brain signals. Psychiatrists often come across situations where they need to diagnose patients suffering from anxiety or depression.
Anxiety disorder is a condition in which the individual suffers from a variety of pathological qualms and abnormal anxieties. A persistent dread of an object or circumstance is known as phobic disorder. It might also entail long-term behavioral changes and continuing anxiety or concern about the consequences.
Depression is another condition in which an individual's feelings, thoughts, behavior, and physical well-being are affected by a mood disorder, characterized by distaste to action. Depressed persons may experience anxiety, feelings of sadness, irritability or restlessness, emptiness, worthlessness, and guilt. Such psychosomatic illnesses can be identified by analyzing emotions based on the brain's impulses.
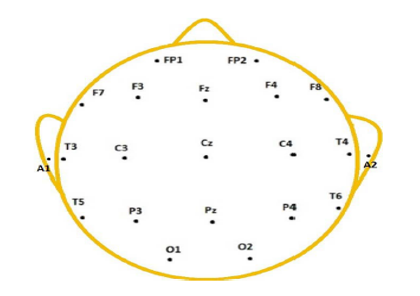
An EEG assesses the brain's impulsive electrical activity due to the existence of neurons [1]. Electric impulses moving amidst brain cells in the brain’s cerebral cortex area produce an EEG signal. The rapidity of these electrical changes lead to specific temporal precision in the microsecond or millisecond range [2, 3]. Electrical energy produced by brain vs time graphs are shown as EEG recordings. The potential variance between two electrodes positioned at a distance is used to create an EEG channel, which is subsequently used to record the summed potential of neurons. EEG is often recorded by means of a 10-20 electrode setup as shown in Figure 1.
In recent years, studying EEG to better apprehend human reasoning processes, brain illness diagnostics and mechanisms, fundamental brain activities, and the realm of Brain Computer Interface (BCI) has garnered a lot of interest. For, EEG provides a greater temporal resolution, a simpler operating approach, and cheaper maintenance costs than Computed Tomography (CT) and functional Magnetic Resonance Imaging (fMRI). Further, it serves as a nonintrusive technique for studying reasoning behavior and disease symptoms like sleep problem, epilepsy, and insomnia. EEG has aided in diagnosing mental illnesses like psychosis, sadness, and anxiety. EEG may serve as the right tool to trace brain functioning corresponding to aberrant activity related to depression. For, depression is manifested by evident emotional fluctuation, sluggish thinking, and severe unhappiness.
Figure 1. The 10–20-electrode positioning system displaying the positions of 19 electrodes
The EEG signal frequency could be categorized into five (5) wave bands: theta wave (4–8Hz), which is typically noticed when somebody is sleepy; delta wave (4Hz), which is observed during slow-wave sleep in adults; gamma wave (30–50Hz), which is associated with situations like meditation; beta wave (14–30Hz), which is detected when someone is actively thinking; and alpha wave (8–14Hz), which is characteristically observed when the individual is calm and relaxed. An ideal feature matrix for the anxiety and depression categorization process is created using a feature selection approach. On the basis of EEG data, an original deep CNN structure has been proposed to categorize anxious and depressed individuals. The suggested method's performance, in terms of testing precision and training outcomes, is evaluated alongside that of popular classification algorithms.
The following is the paper's structure: Section 2 reviews literature pertaining to the current work. Section 3 explains the research methodology employed in the current study for dataset description, preprocessing, feature extraction, and classification. Section 4 discusses the result outcomes viz., training and testing accuracy of the proposed approach and popular classification algorithms. Section 5 concludes the study.
A DeprNet, DL-based CNN was proposed by Seal and co for categorizing EEG information from healthy and depressed patients [4]. It examined DeprNet's performance in two trials, i.e., subject-wise split and record-wise split. The record-wise split data brought about a 0.9937 accuracy and a low Receiver Operating Characteristic (ROC) curve of value of 0.999. Such low performances ruled out these approaches as unsuitable for real world application. In the studies carried out before this, single-channel raw EEG data was fed into the network as input, using DL models, wherein the spatial information for categorization was entirely lost [5].
The performance of Decision Tree (DT), Support Vector Machine (SVM) and KNN was assessed by Cai et al. [6] on an identical data set. Of those, the KNN model was found to be the most accurate, with an accuracy of 89.98 percentage. The creation of a psychophysiological databank of 213 participants (121 healthy controls and 92 depressive patients) was discussed by Cai et al. [7]. A three-electrode EEG device, which is extensively used in prefrontal lobe, was used to capture EEG signals of all the subjects during sound stimulation and at rest. It was found that KNN generated the greatest accuracy of 79.27 percent. The findings revealed that the complete strength of theta wave could be a useful indicator of depression. It was concluded that the commonly available three-electrode EEG collection equipment can facilitate depression detection.
Martínez-Rodrigo et al. [8] utilized a renowned deep learning system, AlexNet, to assess 3-D and 2-D spectral pictures produced through shared thirty-two (32) channels of EEG data for distinguishing between distressed and calm emotional conditions. Deep learning algorithms are recently utilized for detecting various mental diseases such as epilepsy [9, 10], dementia [11], depression [12], and Parkinson's disease [13].
CNN techniques are most frequently utilized in the niche of emotion recognition [14] as well as in the broader context of deep learning [15]. Contrary to conventional machine learning techniques, CNN automatically grasps the complicated features by integrating the weights of many convolutional filters to classify the signals. The majority of experiments on emotion identification utilizing CNN was fed with 2-D EEG spectrograms [16-18]. These spectrograms, however, provide data from a single channel, independently assessing each area of the brain. So, a holistic and coordinated brain information is not available. However, the brain functions as a network and mental activities are built on the harmonized functioning of various sections, says studies [19]. Therefore, simultaneous investigation of all brain regions is needed [20] for a comprehensive evaluation of the fundamental brain dynamics leading to various emotions.
Li et al. [21] proposed a new method for detecting mild depression using electroencephalography. The findings suggested that combining CNN with functional connectivity matrix is effective in detecting moderate depression. In another study by Hosseinifard et al. [22], it was discovered that nonlinear characteristics are also efficient for interpreting EEG data.
Faust et al. [23] used Probabilistic Neural Networks (PNN) to leverage other nonlinear characteristics and wavelet packet decomposition to equate the results obtained from right and left electrodes. In addition, the outcomes of seven traditional categorization methods were also equated. Despite the approaches being quite accurate, they have significant limitations. For, the study did not consider feature redundancy and skipped the stage of feature selection. Furthermore, because the data was split into testing and training segments in a record-by-record manner, the great precision claimed to be attained could be due to such over fittings.
Acharya et al. [24] came up with a depression diagnostic index using nonlinear techniques and Support Vector Machine (SVM) for classification. By combining nonlinear characteristics in an intelligent way, a depression diagnostic index was also developed. The utilization of depression diagnostic index for categorization is dubious, as there is no indication of a connection between the nonlinear characteristics employed in the study for outlining depression and depression diagnosis index.
Convolutional Neural Networks (CNN), are frequently utilized in image processing and have good performance in terms of accuracy. Three machine learning methods such as logistic regression, K-Nearest Neighbor (KNN), and Artificial neural network (ANN) are implemented in huge EEG recordings. Dataset are collected from 90 patients (45 depressed and 45 normal). The correlation dimension, a useful nonlinear characteristic, is employed for evaluating EEG data and distinguishing between non-depressed and depressed patients. The proposed model on combining nonlinear and linear characteristics will improve recognition accuracy.
3.1 Description of data and procedure
The EEG signals investigated in this work were obtained Database for Emotion Analysis using Physiological (DEAP) signals [25]. 6,000 recordings including 3,000 from anxious patients and 3,000 depressive patients acquired from the dataset. These pertained to the right and left brain hemispheres, which corresponded to two conditions viz., eyes closed and eyes opened, respectively. The data so collected was from 30 depressed patients (age between 20 and 50 years) and 30 anxiety-affected patients (aged between 20 and 50 years). An ethics committee of senior physicians gave the ethics approval for the EEG data collected for this study.
Figure 2. Sample anxiety EEG recording
Figure 3. Sample depression EEG recording
Bipolar montage established on the conventional 10-20 electrode placement technique is used to capture EEG data. The left half, FP1-T3; and right half, FP2 –T4 related to brain is utilized for obtaining the EEG data. Figure 2 depicts depressed person’s sample EEG recordings and Figure 3 depicts a sample EEG recording of an anxiety-affected person. The samples so obtained are five-minute recordings in eyes-closed and eyes-opened conditions. EEG signals are experimented at the rate of 256 hertz.
3.2 Data pre-processing
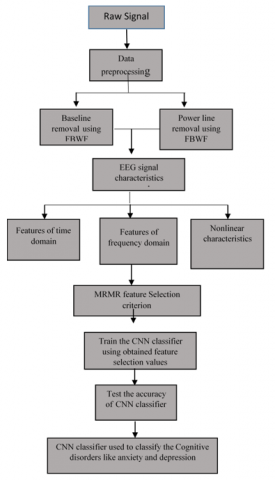
The MATLAB Programme version R2014a is used for all preprocessing and data analysis carried out in this investigation. The brainwave activity's physiological signal is gathered by employing a noninvasive technique called EEG. Usually, the EEG so obtained is mixed with interferences from surrounding settings like baseline wander and nearby power line. EEG sensors can also find and record other physiological signals including Electrooculogram (EOG), Electromyography (EMG), and Electrocardiogram (ECG) [26]. The entire raw data must be de-noised for achieving accurate feature classification and selection results. The recommended approach’s general block diagram is shown in Figure 4.
Figure 4. General block diagram
During the preprocessing phase, noise in the incoming EEG signal gets eliminated. The physiological signal of brainwave activity which is being recorded, is only a few uV in amplitude. So, the signal to noise ratio is very low. However, interfering signals may bear hundreds of uV amplitude. Therefore, to eliminate obtrusive signals, FOBF is constructed in the w-plane. This study also takes into account the W plane, which may be written as (w 14 sq; qR+). It comprises of all likely pole kinds viz., hyper, under, and ultra-damped. A diagnostic filter design has been applied in the w-plane, and specific pole position criteria, including stable and unstable, have been identified. According to the standard butterworth filter principle, the poles whose radius is the same as the cutoff frequency are situated along the circle's perimeter. These have been discovered to be unaffected by fractional order derivation. As a result, the suggested formulation accounts for all stable poles.
By obtaining the transfer function, and then, rebinding into the s-plane, the relation s=w(1/q) can be applied for the w-plane. The corresponding reaction curves are obtained. These demonstrate the existence of a maximally flat butterworth. The ensuing complexity in a fractional domain would make the of generalization filters more challenging, and the benefits of adding more flexibility will exceed the costs of fabrication. Therefore, a relative tradeoff between accuracy and complexity has been taken into consideration when designing the system. To ensure that the overall order is a fraction, the filter has been cut short to the first decimal. The frequency domain features can be improved in terms of accuracy by making intuitive assessments. The FBW filter is designed according to the integer order BW filter by taking into account the stability of fractional linear systems [27].
Figure 5. Preprocessing using FBWF for depression results
Figure 6. Preprocessing using FBWF for anxiety results
Pole positions of every real order FO Butterworth low-pass filter P/Q, (P, Q)∈Z+ is calculated by wk= $= \pm j \Omega_c e^{j(2 k-1) \frac{\pi}{2 P}}$, where, k=1, 2, .., p and the criterion to root stability is calculated by $\arg \, \left|W_k\right|>\frac{q \pi}{2}$, where q=1/Q is commensurate order and P denotes the quantity of poles dispersed on Q Riemann sheets. A pre-processed EEG signal of depression and anxiety are respectively shown in Figures 5 and 6.
3.3 Construction of features matrix
Features matrix comprises of m columns and n rows, with n and m respectively representing the quantity of EEG data and the quantity of characteristics derived from every EEG. The following are the three steps used in the current study to create an effective training features matrix:
(1) Recognize and extract all effective features from each batch of EEG data, wherein each row signifies a feature vector.
(2) From every row of the features matrix, which contains all the recovered features, the best relevant feature is chosen to generate a final feature vector.
(3) Depression and anxiety are labeled in every row of the feature vectors.
3.3.1 Feature extraction
EEG signals inherently have complicated dynamics, and are nonlinear, feeble, and time-sensitive. An alteration in the emotional state results in the modification of the EEG characteristics. EEG data analysis that has been employed in recent work revealed several linear characteristics like variance, peak, and skewness. Nonlinear characteristics of disorder signals, such as Correlation Dimension, have been ascertained and proved to be helpful markers of those disorders. It is necessary to primarily extract the features from pre-treated EEG for creating a feature matrix. Frequency Domain Features and Time Domain Features are the two kinds of EEG features. This work excerpts nonlinear characteristics like Shannon Entropy and Correlation Dimension due to the arbitrariness and nonlinearity of EEG signal. The characteristics listed below were finally chosen for extraction.
Time domain features. The utmost instinctive EEG characteristics are in the time domain. EEG signals are gathered at a specific frequency and time. The traces in time domain of the EEG signals are eliminated unfalteringly, and important data is recovered as a feature in the time domain. This might be utilized for the finding those ceaseless long-term EEG. This work retrieves time domain characteristics including skewness, peak, kurtosis, and variance including Hjorth parameter. In signal processing of time domain, Hjorth parameters represent numerical characteristics. Therefore, these considerations are often employed for extracting features EEG data.
Frequency domain features. The technique employed for identifying, and then analyzing EEG data is the domain of frequency. The characteristics of this domain are absolute power, relative power, absolute centroid frequency, and relative centroid frequency.
Nonlinear features. EEG signals are nonlinear as well as unpredictable as they possess some nonlinear dynamic characteristics. So, using the nonlinear dynamics theory to examine and process EEG signals has become a new field in research work. This work focuses on nonlinear characteristics including Kolmogorov Entropy, Power-Spectral Entropy, C0-complexity, Shannon Entropy, and Correlation Dimension. This enhances the better performance improvement in proper feature selections and their multiple feature combinations.
The C0-complexity is designed as per Lempel-Ziv Complexity (LZC) for solving issues in over-coarse graining preprocessing. The C0-complexity describes the fraction of irregularities and deconstructs the sequence into irregular and regular components. Greater the complexity of time domain signal, nearer it is to a random sequence and bigger is the fraction of its share. The concept assumes that the signal may be broken down into stochastic and regular part. The ratio of A1 and A0 is C0-complexity, where A0 is a signal measurement and A1 is the measurement related to stochastic component. Eqns. (1) and (2) are used to evaluate the power of stochastic component A1, while Eq. (3) measures the C0-complexity.
$A_1=\sum_{n=0}^{N-1}|x(n)-y(n)|^2$ (1)
$A_0=\sum_{n=0}^{N-1}|x(n)|^2$ (2)
$C_0=\frac{A_1}{A_0}$ (3)
The rate of information loss per unit time is measured using Kolmogorov Entropy. The dynamic and time series behind the phenomena are chaotic when the entropy is finite and positive. Zero entropy in the space dimension indicates a regular occurrence. Infinite entropy is a nondeterministic and stochastic occurrence. As shown in Eq. (4), the average rate at which data loss occurs is termed as Kolmogorov Entropy.
$\mathrm{KE}=-\lim _{\tau=\pi} \lim _{\epsilon \rightarrow 0} \lim _{n \rightarrow \infty} \frac{1}{n \tau} \sum_{i_0 \,.. i_n} P_{i_0 \,.. i_n-1} \ln P_{i_0 \,.. i_n-1} \mathrm{~s}$ (4)
A Mathematical Theory of Communication is introduced by Shannon Entropy. It goes as amount of data in a message is proportional to its uncertainty. In other words, the improbability of random variable’s measure and random signal is known as Shannon Entropy. The higher the entropy, the more is the unpredictability and uncertainty. For the purpose of calculating skewness and uncertainty, the current work views EEG as a measure of signal order, and uses entropy to process it [28]. Entropy is calculated using Eq. (5). It includes an approved probability distribution for random variables.
$H(X)=\sum_{x \in \chi} p(x) \log p(x)$ (5)
where, X is a random variable having an alphabet set $\chi$ and probability distribution p(x).
The dynamic characteristics of EEG signals are shown by Correlation Dimension. A time series graph is used to determine the Correlation Dimension, which is a fractal dimension. It is a single-data-vector-based, simplified phase space diagram. Procacia and Grassberger proposed the basic Correlation Dimension method, which is evaluated using Eq. (6).
$\mathrm{CD}=\lim _{r \rightarrow 0}\left(\frac{\ln C(r)}{\ln r}\right)$ (6)
where, r is the radial distance around every reference point and C(r) is the correlation integral.
Power Spectral Entropy is a series of power densities with a Fourier frequency distribution. It is the computed entropy of power spectrum, which is simple to construct. Power Spectral Entropy has been utilized to evaluate temporal signals in EEG data. In order to assess the intensity and quality of brain activity, entropy may be used as a physical metric. When the entropy is more, the brain will be more active [29].
3.3.2 Feature selection
The feature assessment function sometimes includes duplicated characteristics that affect learning accuracy and outcomes. Feature selection not only minimizes the noise, but also reduces the complexity of classification issue by eliminating irrelevant features. It is utilized for selecting a meaningful subset comprising of all existing features. It facilitates the determination of the features that are ideal for identifying EEG signal by examining the characteristics picked by the technique employed. MRMR method is utilized in the current study for selecting the features. Feature selection using MRMR resolves the problem by concurrently assessing relevance and feature redundancy. In specific, maximization of the pertinence of a feature subset S to the class label c is defined as max D(S, c). A feature subset's relevance is evaluated using Eq. (7).
$\operatorname{Max} \mathrm{D}(\mathrm{S}, \mathrm{c})=\frac{1}{|S|} \sum_{f_i \in S} \Phi\left(f_i, \mathrm{c}\right)$ (7)
where, feature relevance $f_i$ to c is given as $\Phi\left(f_i, c\right)$. One can evaluate $\Phi$ by utilizing any correlation measure.
The pairwise feature dependency is employed to determine if there is any feature redundancy. If two important features strongly resemble one another, the power of class discrimination does not alter drastically when one of them is removed. A feature subset of mutually exclusive characteristics is selected using min-redundancy, or min (S). Eq. (8) is used to evaluate the min-redundancy.
$\operatorname{Min} \mathrm{R}(\mathrm{S})=\frac{1}{|S|^2} \sum_{f_i f_j \epsilon S} \Phi\left(f_i, f_j\right)$ (8)
MRMR is a simple operator that maximizes D and lowers R in that order. The incremental search approach is employed to search for a near-optimal feature. An m-order feature that optimizes Eq. (9) is chosen from the feature subset Sm-1 of the m-1 selected feature.
$\max _{f_{j \in S_{m-1}}} \Phi\left(f_i, c\right)-\frac{1}{m-1} \sum_{f_{i \in S_{m-1}}} \Phi\left(f_i, f_j\right)$ (9)
3.3.3 Effective tagging
Every row in the feature matrix must be assigned an emotional tag. Since the experimental population in the present study is split into two groups viz., anxiety controls and depressed patients, the tags- depressed or anxiety are assigned to all the vectors.
3.4 Proposed deep CNN architecture
Finally, classification of EEG data as depressed and anxiety subjects is carried out by utilizing deep CNN. The shared information related to EEG comprises of all the nonlinear and linear features encompassed in it. Based on the features obtained from the EEG signal, the CNN classifier classifies the cognitive disorders as anxiety or depression. The proposed deep CNN is trained using the MRMR technique. This approach tends to choose a subset of features that are least correlated among themselves and most correlated with the class (output). This is done to lower the noise and decrease the complexity of classification. This in turn allows discovering the utmost pertinent characteristics for accurately categorizing the EEG signal. Thus, the reliability of the results is boosted. After training, the CNN is tested for its accuracy. In the post training and testing phases, the proposed deep CNN will be used for classifying EEG signals into either of the two classes, namely, depression and anxiety.
The inputs fed into CNN are order-3 tensors, which are monophonic channel images with W columns and H rows. A c-dimensional vector comes out as an output of the c-class classification task, as the entire network levels handle such inputs in a progressive order. The value in the k-th feature map related to l-th network layer at point (i, j) is expressed using the below given equation.
$Z_{i, j, k}^l=w_k^{l^T} x_{i, j}^l+b_k^l$ (10)
The indigenous input area for this layer and location is denoted as $\chi_{i, j}^l$, while $w_k^l$ and $b_k^l$ are weight and bias vectors corresponding to k-th filter at l-th layer, respectively. The time taken for the preparation is cut short because of the pooling of the convolution kernels demarcated by network weight masks $w_k^l$. The value obtained from calculating (10) is applied to the Rectified Linear Unit (ReLU) activation Eq. (11) to identify the nonlinear structures.
$a_{i, j, k}^l=\operatorname{ReLU}\left(Z_{i, j, k}^l\right)$ (11)
The activation function of CNN architecture is used to bring non-linearity into the method. Some common examples from among the numerous activation functions widely used in deep learning simulations include sigmoid function, Softmax, and ReLu. Owing to the data misplaced in input data, sigmoid activation function degrades the CNN. In the current study, the non-linear ReLu function that has its output as 0 obtained at an input, which is less than 0, is selected to be the activation function. Some of the benefits offered by the ReLU activation function include its resemblance to the humanoid nervous system, ease of usage, and capacity to quickly train bigger networks.
In Figure 7, two dense layers are retained in the completely connected layer in the subsequent five rounds of convolution, pooling layers, and batch normalization. The foremost layer has 16 neurons, whereas the immediately next layer has eight. The classifier here is the most commonly used fully-connected feed forward network. The neurons present in the preceding layer are linked to the neurons in the fully-connected layers. This layer computes the predicted classes by recognizing an EEG data by pooling together all of the features grasped by the preceding layers. The amount of all output classes is determined by the amount of classes available in the target database. It is found by this study that the CNN layers in the proposed technique can extract the key characteristics for identifying EEG signal and classify depression and anxiety after viewing the activation map of 15th layer. As a result, the fully-linked layers require lesser neurons. A dense layer having the Softmax activation function is the final layer that predicts the classification outcome. A set of possible outcomes probability distributions is signified by the Softmax function that provides a vector as its output. Two neurons are required to represent the two possible results in this scenario.
Figure 7. Deep convolution neural network architecture
Most of the EEG-related studies popularly use KNN and ANN as the categorization techniques. The current work evaluates the performance of KNN, ANN and the proposed deep CNN classifier in classifying the given EEG data as depression or anxiety. Every electrode's full-band EEG (Fpz, Fp2, and Fp1), delta wave, theta wave, alpha wave, beta wave, and gamma wave are used to extract all the nonlinear and linear characteristics. An overall of 270 characteristics are retrieved (3 electrodes, 6 frequencies, and 15 fundamental features). Features such as binary weight have been learned for training the classifier.
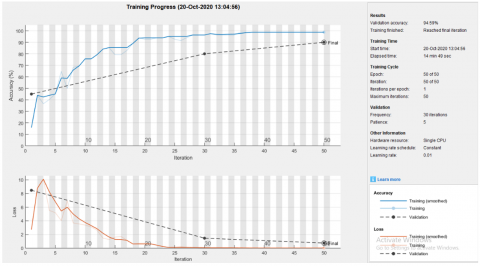
These features are obtained by segregating 80% of the trained and 20% of the test dataset. These are then classified using the proposed deep CNN model as anxiety and depression signals. The findings indicate that the proposed model attains a higher accuracy of 97.6% in classifying the EEG signals obtained from DEAP database. This is graphically represented in Figure 8.
Figure 8. The suggested deep CNN model’s training and testing accuracy
Figure 9. Training and testing accuracy of KNN
Figure 10. Training and testing accuracy of ANN
KNN is a nonparametric supervised machine learning technique employed for regression and classification. The KNN centered classifier does not need to be trained, and their computing complexity is associated with the amount of data in the training set. The KNN classifier's temporal complexity is O(n), if the amount of data in the training set is N.
By using a training dataset for additionally classifying the data points in accordance to their closeness to K in the training database, the feature spaces are categorized by KNN into multiclass and binary clusters. Figure 9 shows how KNN had achieved an accuracy of 80.30 percent with the static EEG data.
Classifying using an ANN-based model attains an accuracy of 94.54% as seen in Figure 10.
The ANN consists of an information processing network, comprising a large number of basic units connected parallel to each other. This is a classification approach is based on the function and structure of the biological neural network. This network resembles the human brain with respect to knowledge generalization, learning, and memory. There are seven hidden layers in the ANN model and each layer has eight neurons. The selected characteristics of the Bayesian method are independently retrieved from each channel. As a result, all of the characteristics of all the channels are integrated into a feature vector for feeding as an input to the ANN model.
By combining the features of absolute gamma wave power on Fp1, absolute beta wave’s centre frequency on Fp2, absolute theta wave power on Fp2, and absolute beta wave’s power on Fp2, the proposed deep CNN approach obtained the highest accuracy of 97.6% for static EEG data which is comparatively more than the other existing model (ANN, KNN, LSTM, RNN) as shown in Figure 11.
Figure 11. Comparative the validation accuracy based on categorizing depression and anxiety signal
Millions suffer from various cognitive mental disorders. This paper focuses on early diagnosis of depression and anxiety, which are two serious mental health problems faced by modern society. For, the existing approaches for identifying depression and anxiety are labor-intensive and reliant on the physician's proficiency. A smart deep-learning Convolutional Neural Network architecture that recognizes and classifies electroencephalography data into either of the two classes viz., anxiety or depression, has been proposed in this paper. It was applied to the electroencephalography signals obtained from Database for Emotion Analysis using Physiological signals. Before that, feature selection was done using the Minimal-Redundancy-Maximal-Relevance approach is employed in this study for feature selection The performance efficiency of the proposed model was evaluated against that of two existing approaches- Artificial Neural Network and K-Nearest Neighbor. The proposed deep CNN method attains the accuracy of 97.6% which is almost 3% higher than the existing methods. Artificial Neural Network-based model and K-Nearest Neighbor delivers the accuracy rate of 94.54% and 80.3% respectively. The accuracy enhancement in proposed method is due implementation of MRMR technique. The outcomes demonstrate that our suggested approach can greatly increase performance accuracy.
[1] Jindal, K., Upadhyay, R., Singh, H.S., Vijay, M., Sharma, A., Gupta, K., Gupta, J., Dube, A. (2018). Migraine disease diagnosis from EEG signals using non-linear feature extraction technique. In 2018 IEEE International Conference on Computational Intelligence and Computing Research (ICCIC), Madurai, India, pp. 1-4. https://doi.org/10.1109/ICCIC.2018.8782341
[2] Elzeiny, S., Qaraqe, M. (2018). Blueprint to workplace stress detection approaches. In 2018 International Conference on Computer and Applications (ICCA), Beirut, Lebanon, pp. 407-412. https://doi.org/10.1109/COMAPP.2018.8460293
[3] Doma, V., Pirouz, M. (2020). A comparative analysis of machine learning methods for emotion recognition using EEG and peripheral physiological signals. Journal of Big Data, 7(1): 1-21. https://doi.org/10.1186/s40537-020-00289-7
[4] Seal, A., Bajpai, R., Agnihotri, J., Yazidi, A., Herrera-Viedma, E., Krejcar, O. (2021). DeprNet: A deep convolution neural network framework for detecting depression using EEG. IEEE Transactions on Instrumentation and Measurement, 70: 1-13. https://doi.org/10.1109/TIM.2021.3053999
[5] Wan, Z., Huang, J., Zhang, H., Zhou, H., Yang, J., Zhong, N. (2020). HybridEEGNet: A convolutional neural network for EEG feature learning and depression discrimination. IEEE Access, 8: 30332-30342. https://doi.org/10.1109/ACCESS.2020.2971656
[6] Cai, H., Qu, Z., Li, Z., Zhang, Y., Hu, X., Hu, B. (2020). Feature-level fusion approaches based on multimodal EEG data for depression recognition. Information Fusion, 59: 127-138. https://doi.org/10.1016/j.inffus.2020.01.008
[7] Cai, H., Han, J., Chen, Y., Sha, X., Wang, Z., Hu, B., Yang, J., Feng, L., Ding, Z.J., Chen, Y.Q., Gutknecht, J. (2018). A pervasive approach to EEG-based depression detection. Complexity, 2018: 1-13. https://doi.org/10.1155/2018/5238028
[8] Martínez-Rodrigo, A., García-Martínez, B., Huerta, Á., Alcaraz, R. (2021). Detection of negative stress through spectral features of electroencephalographic recordings and a convolutional neural network. Sensors, 21(9): 3050. https://doi.org/10.3390/s21093050
[9] Zhou, M., Tian, C., Cao, R., Wang, B., Niu, Y., Hu, T., Guo, H., Xiang, J. (2018). Epileptic seizure detection based on EEG signals and CNN. Frontiers in Neuroinformatics, 12: 95. https://doi.org/10.3389/fninf.2018.00095
[10] Raghu, S., Sriraam, N., Temel, Y., Rao, S.V., Kubben, P. L. (2020). EEG based multi-class seizure type classification using convolutional neural network and transfer learning. Neural Networks, 124: 202-212. https://doi.org/10.1016/j.neunet.2020.01.017
[11] Ieracitano, C., Mammone, N., Bramanti, A., Hussain, A., Morabito, F.C. (2019). A convolutional neural network approach for classification of dementia stages based on 2D-spectral representation of EEG recordings. Neurocomputing, 323: 96-107. https://doi.org/10.1016/j.neucom.2018.09.071
[12] Acharya, U.R., Oh, S.L., Hagiwara, Y., Tan, J.H., Adeli, H., Subha, D.P. (2018). Automated EEG-based screening of depression using deep convolutional neural network. Computer Methods and Programs in Biomedicine, 161: 103-113. https://doi.org/10.1016/j.cmpb.2018.04.012
[13] Oh, S.L., Hagiwara, Y., Raghavendra, U., Yuvaraj, R., Arunkumar, N., Murugappan, M., Acharya, U.R. (2020). A deep learning approach for Parkinson’s disease diagnosis from EEG signals. Neural Computing and Applications, 32: 10927-10933. https://doi.org/10.1007/s00521-018-3689-5
[14] Suhaimi, N.S., Mountstephens, J., Teo, J. (2020). EEG-based emotion recognition: A state-of-the-art review of current trends and opportunities. Computational intelligence and neuroscience, 2020: 8875426. https://doi.org/10.1155/2020/8875426
[15] Aloysius, N., Geetha, M. (2017). A review on deep convolutional neural networks. In 2017 international conference on communication and signal processing (ICCSP), Chennai, India, pp. 0588-0592. https://doi.org/10.1109/ICCSP.2017.8286426
[16] Kwon, Y.H., Shin, S.B., Kim, S.D. (2018). Electroencephalography based fusion two-dimensional (2D)-convolution neural networks (CNN) model for emotion recognition system. Sensors, 18(5): 1383. https://doi.org/10.3390/s18051383
[17] Li, X., Song, D., Zhang, P., Hou, Y., Hu, B. (2017). Deep fusion of multi-channel neurophysiological signal for emotion recognition and monitoring. International Journal of Data Mining and Bioinformatics, 18(1): 1-27. https://doi.org/10.1504/IJDMB.2017.086097
[18] Mishra, A., Ranjan, P., Ujlayan, A. (2020). Empirical analysis of deep learning networks for affective video tagging. Multimedia Tools and Applications, 79: 18611-18626. https://doi.org/10.1007/s11042-020-08714-y
[19] Anzellotti, S., Coutanche, M.N. (2018). Beyond functional connectivity: investigating networks of multivariate representations. Trends in Cognitive Sciences, 22(3): 258-269. https://doi.org/10.1016/j.tics.2017.12.002
[20] Rabinovich, M.I., Muezzinoglu, M.K. (2010). Nonlinear dynamics of the brain: emotion and cognition. Physics-Uspekhi, 53(4): 357. https://doi.org/10.3367/UFNe.0180.201004b.0371
[21] Li, X., La, R., Wang, Y., Hu, B., Zhang, X. (2020). A deep learning approach for mild depression recognition based on functional connectivity using electroencephalography. Frontiers in Neuroscience, 14: 192. https://doi.org/10.3389/fnins.2020.00192
[22] Hosseinifard, B., Moradi, M.H., Rostami, R. (2013). Classifying depression patients and normal subjects using machine learning techniques and nonlinear features from EEG signal. Computer Methods and Programs in Biomedicine, 109(3): 339-345. https://doi.org/10.1016/j.cmpb.2012.10.008
[23] Faust, O., Ang, P.C.A., Puthankattil, S.D., Joseph, P.K. (2014). Depression diagnosis support system based on EEG signal entropies. Journal of Mechanics in Medicine and Biology, 14(03): 1450035. https://doi.org/10.1142/S0219519414500353
[24] Acharya, U.R., Sudarshan, V.K., Adeli, H., Santhosh, J., Koh, J.E., Puthankatti, S.D., Adeli, A. (2015). A novel depression diagnosis index using nonlinear features in EEG signals. European Neurology, 74(1-2): 79-83. https://doi.org/10.1159/000438457
[25] Koelstra, S., Muhl, C., Soleymani, M., Lee, J.S., Yazdani, A., Ebrahimi, T., Pun, T., Nijholt, A., Patras, I. (2011). Deap: A database for emotion analysis; using physiological signals. IEEE Transactions on Affective Computing, 3(1): 18-31. https://doi.org/10.1109/T-AFFC.2011.15
[26] Tatum, W.O., Dworetzky, B.A., Schomer, D.L. (2011). Artifact and recording concepts in EEG. Journal of Clinical Neurophysiology, 28(3): 252-263. https://doi.org/10.1097/WNP.0b013e31821c3c93
[27] Acharya, A., Das, S., Pan, I., Das, S. (2014). Extending the concept of analog Butterworth filter for fractional order systems. Signal Processing, 94: 409-420. http://dx.doi.org/10.1016/j.sigpro.2013.07.012
[28] Bruhn, J., Lehmann, L.E., Röpcke, H., Bouillon, T.W., Hoeft, A. (2001). Shannon entropy applied to the measurement of the electroencephalographic effects of desflurane. The Journal of the American Society of Anesthesiologists, 95(1): 30-35. https://doi.org/10.1097/00000542-200107000-00010
[29] Ranjani, M., Supraja, P. (2021). Classifying the autism and epilepsy disorder based on eeg signal using deep convolutional neural network (DCNN). In 2021 International Conference on Advance Computing and Innovative Technologies in Engineering (ICACITE), pp. 880-886. https://doi.org/10.1109/ICACITE51222.2021.9404634