OPEN ACCESS
The fluid-dynamic characterization of aerodynamic devices called trailing-edge serrations aimed at reducing wind turbine blades noise emissions is here presented. Nowadays, the development of aerodynamic noise mitigation solutions is a hot topic. However, a detailed fluid-dynamic analysis of such devices cannot be found in literature. The present work will discuss the results of an experimental test campaign carried out at the Environmental Wind Tunnel of the “Università Politecnica delle Marche” intended to study the induced effects of these devices when applied on a wing with NACA 642 014A airfoil operating in various conditions. Tests were based on both global measurements, performed with load balance, and local pressure measurements. In addition, frequency analysis of the balance signal and flow visualization tests were also performed. Global measurements showed that serrated edges are capable of countering trailing-edge separation in a not well-understood manner. On the other hand, local observations revealed that flow is accelerated along serration extension. Lastly, flow visualization tests pointed out a sort of flow deviation towards the skewed edge of the serration on the pressure side of the airfoil.
noise reduction, trailing edge serrations, wind turbines, wind tunnel testing
In recent years, the increasing interest of governments towards alternative power production technologies is realized with growing renewable sources plant installation. The wind power sector is quickly developing, thanks to the newest construction techniques that have led to wind turbine size growth and a resulting power production increase [1]. At the same time, new challenging issues related to new wind plants installation have emerged, including their acoustic impact. This is a key engineering problem since it is retained as one of the main causes of annoyance for people living nearby wind farms, particularly in rural or suburban areas.
The reduction of noise emission from most mechanical and electrical components has been largely faced in the available literature. Differently, the reduction of the aerodynamic noise shows several lacks of knowledge. Brooks et al. [2] gave a clear definition of the various aeroacoustic self-noise emission phenomena arising on an airfoil. One of the most important is the noise due to the turbulent boundary layer interacting with the trailing edge, namely Turbulent Boundary Layer – Trailing Edge Noise, TBL-TEN. This is emphasized by the flow separation conditions close to the stall, which could easily be present on wind turbine blades [3]. Therefore, TBL-TEN mitigation is of absolute scientific and industrial interest. As a matter of fact, recent acoustic investigations on operating wind turbines have proven that main aerodynamic noise sources are located on the rotor blades, with the major emission coming from the trailing edge (T.E.) [4].
Howe [5] firstly addressed the problem with an analytical approach, showing that the intensity of noise emission with TBL-TEN mechanism is proportional to the product of a characteristic length of the turbulence near the edge and the size of the edge itself. Howe proposed the use of serrated shapes as an effective way of reducing the characteristic length of the turbulence. Amiet [6] with his semi-empiric approach, pointed out, among key contributions for airfoil self-noise generation, the noise source strength in terms of surface pressure fluctuations within the turbulent boundary layer (TBL).
These first theoretical results led to the design of the sawtooth appendages named Trailing-Edge Serrations, TES, subject of this work. These have been conceived as fitting solutions for existing blades and have been subject of experimental tests for several years. In his wide work, Gruber [7] tested a rich set of TES devices proving a noise reductionup to 5 dB and demonstrating that beneficial effects occur for h/δ>0.25, where h is the serration amplitude and δ theboundary layer thickness at T.E. and that narrower and longerthe serration, better the effect. Recently, Vathylakis et al. [8] have tested several devices realized by coupling TES directlycut onto the wing and porous material inlays. Their resultshave confirmed Gruber findings, but an increase of the tonalnoise inversely proportional to serration amplitude was shown.Moreover, a noise mitigation with brushed type porousmaterials was found to be possible.
Alongside experimental tests, the available massively parallel computational resources are giving a broad use of numerical simulations tools in the field of Computational Aeroacoustics. Indeed, Large-Eddy Simulations (LES), or Direct Numerical Simulations (DNS) approaches have been more widely applied in recent years. One of the latest works of Sandberg and Jones [9], adopting DNS techniques, presented computations of the acoustic far field around a NACA 0012 airfoil with TES. Their results highlighted a noise reduction at higher frequencies. Nevertheless, negligible effects on the fluid-dynamic field due to the presence of the serration appeared.
The physical mechanisms undergoing TES devices noise reduction capabilities are still not well understood. Moreover, ongoing works on fluid-dynamic characterization of these devices applied on high performance airfoils are not known by the authors at the time of this writing. Therefore, the research here presented is intended to investigate the effect of such devices from both fluid-dynamic and acoustic points of view.
This paper discusses experimental tests regarding TES devices for wind turbine blades airfoils. A fluid-dynamic characterization including pressure and load balance measurements is presented.
Starting from the results of Howe and Amiet, a laminar airfoil has been chosen as TES devices test-bench, since it has a lower TBL development. Moreover, laminar airfoils have been considered as successful solution for modern utility-scale wind turbines thanks to their capacity to operate for a range angles of attack without increasing aerodynamic drag. The appendages applied on a wing model with NACA 642‑014A laminar airfoil were tested in the wind tunnel under various flow conditions. The assessment of the global aerodynamic performance was obtained via three-axes load balance. A frequency analysis of the balance signal was then used to clarify if any fluid-dynamic mechanism induced by TES devices was also carried out. Local effects on the surface pressure distribution, for a given wing section, were evaluated by means of pressure coefficient. Finally, a certain alignment of the flow over serrated edges emerged from flow visualization tests.
The paper is organized as follow. Section 2 describes the experimental setup, Section 3 presents the results and Section 4 contains conclusions and a brief description of design criteria for the experimental apparatus for the upcoming acoustic tests.
2.1 Test facility and the wing model
Experimental tests were carried out at the Environmental Wind Tunnel (EWT) of the “Università Politecnica delle Marche”. The EWT test chamber has a 1.8×1.8m cross section, is 9m long, and consists of three main parts: the first is used for aerodynamic tests requiring a uniform velocity distribution and a low turbulence level; the second is used to test reciprocal interference effects between slender bodies; the latter is used to test wind effects over buildings, structures and orography models which are subjected to fully developed environmental aboundary layers. The EWT is supplied by a fixed speed fan, with variable pitch that can ensure a regulated wind velocity between 5 m/s and 40m/s. Constant Temperature Hot Wire Anemometer (CTA HWA) measurements showed a lack of flow uniformity less than 2.5 % and a turbulence intensity level less than 0.3 % on an area larger than 90 % of the test cross section. The EWT is also equipped with a compact heat exchanger able to control temperature variations within a range of ±1°C.
The baseline wing model used for appendages installation is a rectangular wing with NACA 642-014A airfoil of 0.45m chord and 1.4m span. It is also equipped of end-plates for the abatement of finite wing vortex effects. The aerodynamic performances of the baseline model are well known thanks to previous numerical and experimental studies of D’Alessandro et al. [10]. Their outcomes will be considered as reference for the results obtained for the appendages here presented.
Figure 1. Pressure taps on the baseline wing model
Figure 2. Schematic of appendages set tested
The wing model is constrained to the first part of EWT test chamber by means of a specific framework in order to avoid mechanical vibration transmission. The angle of attack is set by a zero-backlash cycloidal gear train with a graduated indicator and a handwheel. The wing model is also equipped with 75 pressure taps drilled in the middle section and evenly-spaced over suction and pressure sides between positions 0<x/c<0.86, where c is the airfoil chord, as can be seen in Figure 1.
2.2 Implementation of aerodynamic appendages
Two sets of three appendages were prepared, one for the balance tests, the other for the pressure tests. The appendages were conceived as extensions of the baseline wing model to be installed by gluing on its suction side, close to the T.E., as in Figure 3. Each set consists of an appendage with straight profile (F), one with narrow sawtooth serration (L) and another with wide serration (2L), as drafted in Figure 2. The geometrical parameters of the serration are shown in Figure 4, where 2h is the streamwise length and "λ" is the spanwise width of the tooth. In Table 1 appendages dimensions are mentioned for all the cases. Note that all the appendages are designed with the same mean extension, so as to give identical plain area once fitted on to the model. The sawtooth serrations were created by choosing a geometrical state with the baseline wing chord, such as c/2h=0.2, according to experimental studies of Gruber, Joseph e Chong [11]. The model developed for the pressure measurements was also equipped with pressure taps on the upper surface at chord-based positions given in Table 2 and represented in Figure 5. These appendages were installed aligning pressure taps with those on the baseline model.
Figure 3. Comparison with baseline profile (up) and fitted one (down), dimensions are in mm
Figure 4. Detail of the serrations
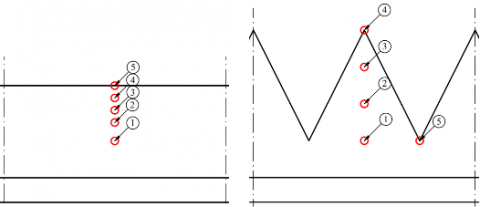
Figure 5. Pressure taps identification for “F” model (left) and “2L” and “L” models equivalently (right)
Figure 6. Schematic of wool strands over "2L" model
Table 1. Geometrical definition of appendages (see Figure 4)
|
Appendages |
2h (mm) |
λ (mm) |
|
F |
45 |
- |
|
L |
90 |
45 |
|
2L |
90 |
90 |
|
Appendages |
1 |
2 |
3 |
4 |
5 |
|
F |
1.0 |
1.03 |
1.05 |
1.08 |
1.1 |
|
L |
1.0 |
1.06 |
1.13 |
1.2 |
(1.0)1 |
|
2L |
1.0 |
1.06 |
1.13 |
1.2 |
(1.0)1 |
2.3 Fluid-dynamic test setup
A first experimental campaign was conducted by means of three-axes load balance for measuring overall aerodynamic forces. The load balance was constrained to the model according to the three main directions of Figure 1 and could be moved jointly with it. The balance has a voltage output signal of 0.05–10.2V with a typical error of less than 0.1 %. The full scale of the single strain-gauge reads ±100 N for x, ±20 N for y and ±1 Nm for z axes, with a division of 0.61∙10-3 N, 3.05∙10-3 N e 0.305∙10-3 Nm respectively.
Load balance measurements were conducted at wind tunnel velocities corresponding to Reynolds numbers ( $Re_c$ =ρVc/u , with μ being the air kinematic viscosity) Rec=175,000 and Rec=350,000, for angles of attack within the range ‑12°<α<+12 for the first case and ‑10°<α<+10 for the second one.
Pressure measurements were performed by means of low range differential pressure transducers from GEMS Sensors with ±250Pa full scale and typical error within ±2.5Pa. In this case wind tunnel velocity was regulated corresponding to Rec=175,000 and the angle of attack was adjusted in the range ‑8°<α<+8.
2.4 Flow visualization test setup
Flow visualization tests were conducted for “L” and “2L” appendages only. The aim of these tests was to identify any possible flow effect of the sawtooth edges. Wool strands were glued over the upper and lower surfaces, as can be seen in Figure 6. Red strands have been used for suction side, blue ones for pressure side. On both the airfoil sides the visualization tools have been arranged in rows and aligned with airfoil chord. Strands were of 40mm in length, 3mm wide and cover the wing surface from x/c=0.4 throughout full tooth extension with an even-space of 20 mm each other.
The tests have been carried out at a wind tunnel velocity corresponding to Rec=450,000 with angle of attack spanning within the range -8°<α<+8°. Imagery from three different points of view was produced at the same time. Two observation points were placed outside the EWT test section; in particular, they are orthogonal to the suction and pressure side, respectively. The last observation was as side view of the airfoil and it was performed inside the test section.
Note that, for our visualizations the Reynolds number was chosen for the sake of a good bending of the strands under flow action, and to allow the observation of the flow field structures. However, for the considered flow regime, it is reasonable to obtain similar flow structures at Rec=450,000 if compared to the Re numbers used in the other experimental techniques presented in this paper.
The wing model applied in this work has been subject of study in D’Alessandro et al. [10], where numerical simulations and experimental results carried out at the same EWT have showed a good agreement. We can therefore assume that a reliable model is used. Nevertheless, the installation of the appendages made a substantial change to the baseline airfoil, thus we retain acceptable the evaluation of “L” and “2L” serrated appendages operation strictly only with reference of “F” one.
In the following, experimental data from balance tests will be presented in terms of aerodynamic lift coefficient $c_l$, drag coefficient $c_d$ and momentum coefficient $c_m$:
$c_l=\frac{L}{\frac{1}{2}ρV_∞^2S}$; $c_d=\frac{D}{\frac{1}{2}ρV_∞^2S}$; $c_m=\frac{M}{\frac{1}{2}ρV_∞^2Sc}$,
where, L is the lift, D is the drag, M is the aerodynamic momentum, ρ is the air density, $V_∞$ is the free field flow speed, S is the wing span and c is the airfoil chord, while outcomes from pressure tests will be presented by means of pressure coefficient ($C_p$) for the inquired section, with $C_p$ being defined as:
$C_p=\frac{p-p_∞}{1/2ρV_∞^2}$
where, p is the pressure at the measurement point and $p_∞$ is the free field pressure. In all the cases the dependency from angle of attack α will be investigated.
3.1 Force measurement results
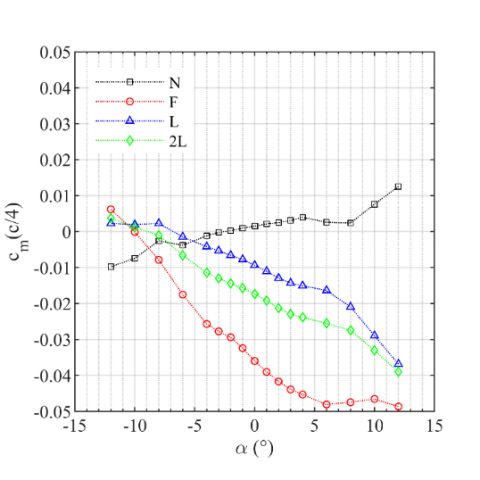
The application of the appendages causes a change in the original airfoil shape. Defining the “mean camber line” of an airfoil as the curve obtained by plotting the points that lie halfway between the upper and lower surfaces. The maximum distance between mean camber line and chord line is commonly known as the “camber” and it is a measure of the curvature of the airfoil. Being NACA 642-014A a bi‑convex symmetrical airfoil, it has a null camber. The “F” model presents an apparent non-symmetrical airfoil, with a certain camber in a position close to T.E., like a plain flap acts. Airfoils having backwarded maximum camber typically show asymmetrical trends of aerodynamic coefficients with respect to angle of attack. In particular $c_m$ shows a monotonous decreasing trend, having always negative values for all the angles of attack. Similar trends were also obtained in our tests.
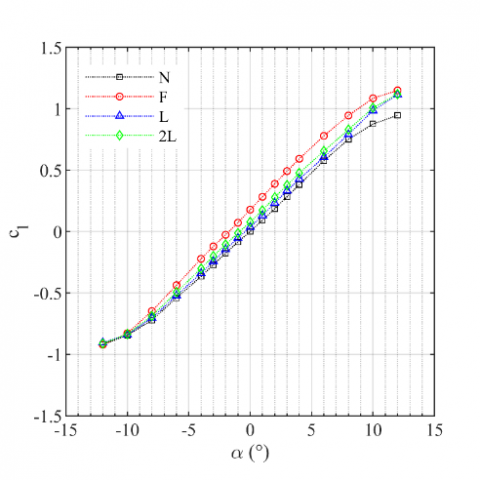
Figure 7. Lift coefficient "c" _"l" (175,000 Re)
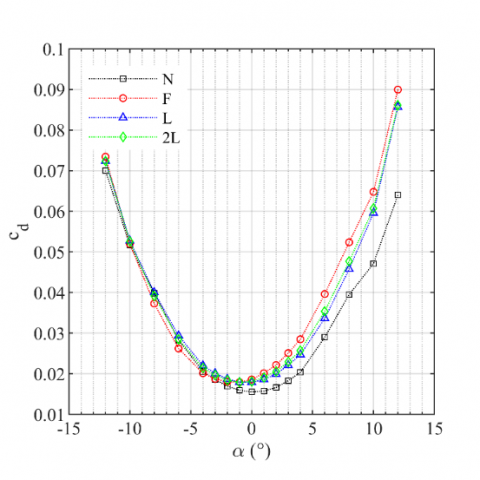
Figure 8. Drag coefficient "c" _"d" (175,000 Re)
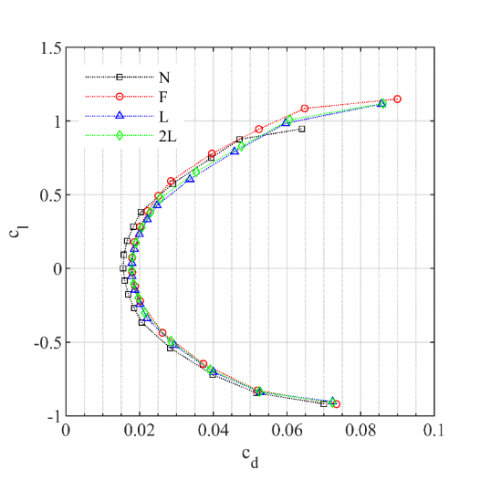
Drag coefficient $c_d(α)$ is reported in Figure 8. The behavior of “F” model is comparable to that of a flap, as it shows considerably higher $c_d$ values with increasing . This could be due to the augmented surface of the model against the baseline one. Serrated models put in evidence an almost identical values each other. It is worth noting that them reveal less drag of “F”, while having the same plain area.
Figure 7 shows lift coefficient $c_1(α)$ with respect to flow angle α at Rec=175,000. The lift coefficient curve for “F” model appears shifted upward compared to that of baseline model “N”. Both “N” and “F” displays the typical slope change of the $c_1(α)$ curve due to upcoming T.E. wake separation around α =+8°. For “L” and “2L” models curves exhibits similar trend of that of “N”, despite having plain areas and flap angle equal to that of “F” model. For higher α values $c_1(α)$ curves are close to that of “F” model. Moreover, “2L” model shows more lift capacity than “L”. Note that for serrated models the registered slope change of $c_1(α)$ curves occurs for α>+10, this is related to a limited wake separation provided by the sawtooth profile.
Figure 9. Momentum coefficient "c" _"m" at c/4 (175,000 Re)
Figure 10. Efficiency plot "c" _"l" "-" "c" _"d" (175,000 Re)
Figure 9 displays aerodynamic momentum curves $c_m(α)$. Models equipped with appendages exhibit the typical after-cambered airfoil behavior. The high-pressure gradient effect induced at the bottom side by the “F” appendage on the $c_m(α)$ plot is clearly evident; it reaches lower values and a higher slope. “L” and “2L” models show similar trends of “F”.
Finally, Figure 10 reports $c_1-c_d$ curves from which aerodynamic efficiency ε =c1/cd can be deduced. In general, serrated models attained less efficiency compared to “F” one, even for higher angles where they benefit from decreased wake separation.
For the sake of compactness, we report data only for Rec=175,000 corresponding flow speed; similar results are obtained for Rec=350,000.
In order to investigate phenomena that can be traced back to the fluid-dynamic alterations due to the presence of serrated appendages, load balance tests were accompanied by a spectral analysis of the registered signal. The three output channels from the balance were acquired at a sampling rate $f_s$=8,192 Hz to obtain a good spectral resolution in the mid-low frequency range. Is well-known that pressure fluctuation of boundary layer have frequency content ranging from 200 Hz to 1000 Hz. Frequency analysis performed on the baseline model gave evidence of noticeable contribution of the recorded forces within 100Hz–2000Hz. Within range of interest no significant effects were detected when working with appendages.
3.2 Local measurement results
Pressure investigations were carried out at wind tunnel flow speed corresponding to Rec=175,000 and flow angles α =0°, +4°and+8°. Note that following results apply to the measurement section only. The outcomes for “F” model could be representative of the whole 3-D model and compared to load balance results. The same cannot be said for “L” and “2L” models since sawtooth edges induce spanwise flow.
Furthermore, we have to take into account that the discussions are based on experimental evaluation of a very-complex fluid-dynamic phenomena and its representation could be partially hidden by the space resolution of the measurement points. Moreover, the inevitable forming imperfections of the model itself could affect the quality of the experiments.
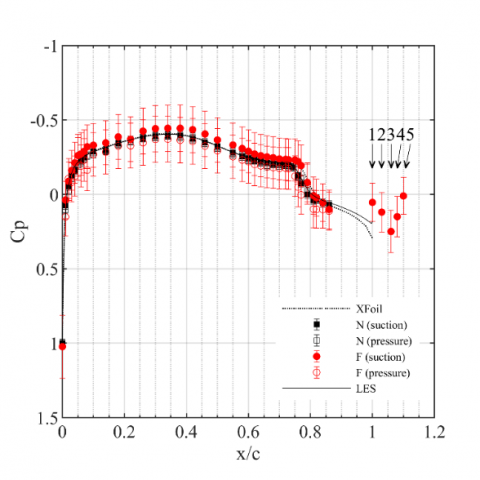
The first evident contribution to the surface pressure distribution is given by the application of flap-like appendage “F”. Indeed, this generates an apparent airfoil with non-zero camber with L>0 for α =0°, see Figure 1. As a matter of fact, Figure 11 reports pressure coefficient $C_p$ distribution for baseline “N” and “F” models.
Figure 11. Pressure coefficient for “F” model, "α" = 0°
Laminar separation bubble (LSB) is visible for both the models. LSB consists of a local separation of the boundary layer and it can occur in presence of some conditions that are briefly described: (i) a laminar separation of the boundary layer due to an adverse pressure gradient; (ii) a turbulent transition within the separated shear layer; (iii) a turbulent reattachment. Under these conditions a slow recirculating flow region characterized by an almost constant pressure is formed. LSB can be identified from pressure distribution plot around the knee of the $C_p$. More important is the knee extension, larger is the bubble extension.
“F” model shows a longer LSB followed by a stronger pressure recovery, partially caused by the presence of the bevelled leap of the appendage fixture on the suction side. The flow is then forced to overcome the leap resulting in a new acceleration, as shown by pressure tap n. 1 of Figure 11 (see Figure 5 for reference) by its lower pressure value. Downstream, taps n. 2 and 3 exhibit analogous trend of the baseline model with a steeper pressure recovery. Taps n.4 and 5 seem to experience a new flow acceleration: this is in complete contrast to the expected wake conditions for such model and will not be considered reliable.
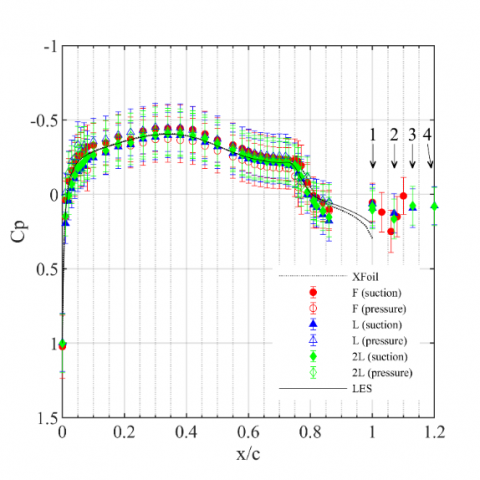
Figure 12. Pressure coefficients for appendages, "α" = 0°
In Figure 12 we compare $C_p$ at α =0° for serrated models against “F” one. Overall pressure distribution is affected by the applied appendages. For “L” and “2L” models the suction peak seems to be slightly moved downstream. For x/c>0.8, the pressure recovery after LSB is anticipated and enhanced, despite that the serrated appendages share the same thickness of the junction with the “F” appendage. Then, the flow undergoes a higher acceleration between 0.86<x/c<1, reaching indicatively the same pressure values for x/c=1, as registered by taps n.1. Focusing on pressure distribution over appendages extension, “L” and “2L” models experience a reduced pressure recovery compared with “F” model, see positions n. 1 and 2 in Figure 12. This could be correlated to the cross flow in the troughs of the sawtooth serration which is at a higher mean pressure. This effect is more evident for “L” model as it has short distance from tooth center line and root line. Further downstream, pressure taps n. 2, 3 and 4 highlight a slight flow acceleration towards tooth tip. The effect is similar to a presence of a sort of apparent curvature that cannot be attributed to any bending of the tooth.
Figures 13 and 14 displays $C_p$ at cases α=+4° and +8° for the same models. “F” model shows higher values for both cases, confirming balance tests results.
Figure 13. Pressure coefficients for appendages, "α" = +4°
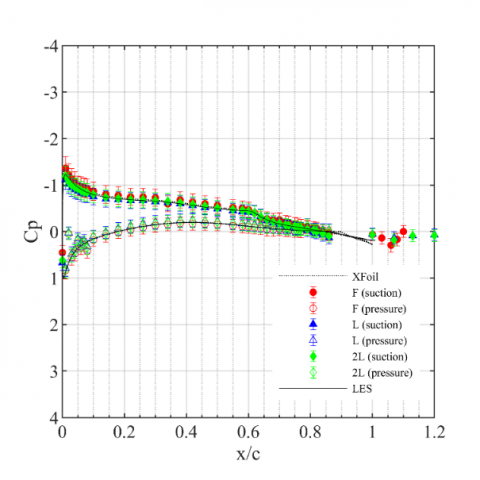
Figure 14. Pressure coefficients for appendages, "α" = +8°
With reference to Figure 13 for α=+4°, “L” and “2L” models present stronger turbulent flow reattachment after LSB on the suction side. Over the serration length pressure distributions are comparable with those for lower angles. Focusing on leading edge (L.E.) locations, $C_p$ at x/c=0 have positive values for all the models here considered; this element is clearly linked to the location of the stagnation point which is placed at 0<x/c<0.01 of the pressure side, as stated by XFoil simulations and LES data of D’Alessandro et al. [10]. It is worth noting that serrated models have values close to $C_p$ =1.0 and less than other model: this means that stagnation zone could be near L.E. more than in the case of “F” model, i.e. the effective flow angle is lower. As a consequence, the suction peak is less pronounced.
For higher angle of attack displayed in Figure 14, overall pressure distributions are similar to the baseline model for both “L” and “2L”. Along serration extension the flow acceleration is mostly more intense than for lower angles. In this case, at x/c=0 assumes negative values for all the models as the result of a strong acceleration over the L.E. curvature. Stagnation zone is reasonably shifted even downstream at positions 0.01<x/c<0.03 on the pressure side. As before, $C_p$ values at L.E. for “L” and “2L” are lower in module with respect to “F” model.
3.3 Flow visualization
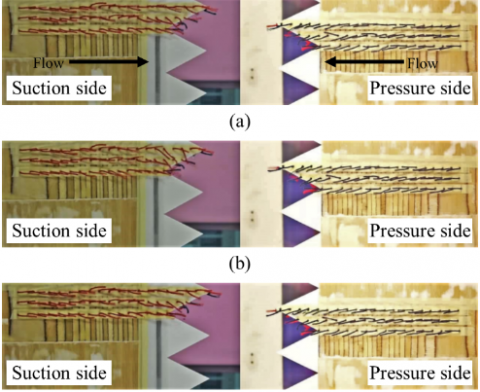
Images in Figure 15 are captured from flow visualization tests. Pictures are referred to points of view outside EWT test section for the case of “2L” model. The arrow in Figure 15(a) indicates the main flow direction.
Figure 15. Flow visualization for "2L" model, (a) "α" = 0°, (b) "α" = +4°, (c) "α" = +8°
It can be noted that first strands encountered by the flow are well aligned each other on both suction and pressure sides. As the angle of attack increases, strands on suction side are more affected by the TBL wake separation in the proximity of T.E. For example, looking at Figure 15(b), strands just before the appendage assume a random disposition compared to those in upstream positions. Instead, the corresponding strands on the pressure side of the model are always organized as the main flow direction thanks to a smaller TBL. This can also be seen in Figures 15(a) and 15(c) for other flow angles.
For what concerns the behavior of the strands over the serration extension, on suction side they have a completely random appearance except on sawtooth root line. On the pressure side they are generally well-arranged. At a closer look, the tip line shows a slight deviation of the strands towards the skewed edge of the tooth, which is mostly the same with increasing flow angle. The strands on central line appear in a similar fashion.
It is reasonable to observe oblique edges of the serrations, since they allow the flow fields at different pressure to interact, and they can let the flow to cross the troughs from pressure side to the suction one. The stream, still being directed chord-wise upstream the serration, is turned of a certain angle to pass the side edge of the tooth. This effect is more evident for the tip lines, whereas the root lines appears not affected anyway.
In the present work fluid-dynamic effects due to the application of sawtooth serration devices to a rectangular wing were investigated. Global performance of the tested models was evaluated by means of aerodynamic coefficients; local pressure coefficient distribution was also measured. Models fitted with serrated appendages were compared to an equivalent one with a flap-like appendage of the same plain area. Results have been accompanied with a frequency analysis of the load balance signal and flow visualisation tests. Experiments resulted very challenging to be performed due to the complexity of the phenomena induced by the appendages.
Aerodynamic performance of serrated models has been shown close to that of the reference model, with less aerodynamic drag and being capable of limiting wake separation increasing the angle of attack. However, they have been found generally less efficient. The model with wider teeth has revealed slightly more lift and drag against that with narrower teeth.
From the local point of view, effects on the upstream pressure distribution caused by the application of serrated appendages have been pointed out. Above all, some differences have emerged at the leading-edge pressure tap positions for non-zero angles of attack, whereas some flow acceleration have been highlighted along serration streamwise length, which is believed not to be due to any surface bending. Thus, other flow mechanisms are probably involved.
Unfortunately, frequency analysis of the load balance signal has not made evidence of significant contribution of the applied appendages. Instead, flow visualisation results have proved some deviation of the flow towards skewed edge of the sawtooth, on the pressure side of the serrated models only.
In summary, we can conclude that the application of such serrated appendages aimed at aerodynamic noise emission reduction made no noteworthy overall fluid-dynamic changes. Any other possible effect that can be led to a decreased noise emission must be inspected by means of accurate local measurements.
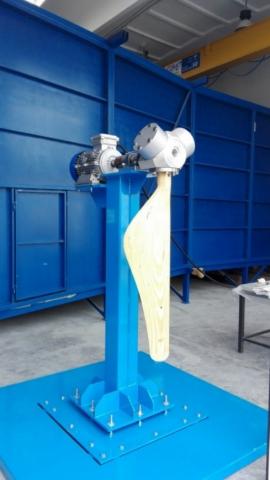
Ongoing work is devoted to acoustic tests which will be carried out at the semi-anechoic chamber of the “Università Politecnica delle Marche” on a set of aerodynamic appendages like those presented here. These will be applied on a test rig designed for the purpose, see Figure 16.
Figure 16. Test rig for acoustic measurements of TES devices
The test rig is basically a one-blade fan, supplied by a variable speed electric motor with a rated speed of 650 RPM. The purpose of the rotating blade model is to reproduce the flow conditions that can be found on real wind turbine blades without incoming flow in order to cancel its background noise. It is important to remark that the blade shape has been designed such that an equal both flow angle and flow velocity can be expected on a real-scale wind turbine blade. The same solidity parameter has also been retained. A single blade has been chosen to avoid blade-to-blade interference and the consequently, extraneous noise emission. The blade has a NACA 2420 airfoil. The reasons behind this choice are briefly described: (i) it can operate at high Reynolds number without suffering strong flow separation, so as to avoid stall condition and its undesired noise; (ii) its higher thickness ensure a louder noise emission to be clearly discriminated over external sources.
Acoustic tests will be performed by means of classical phonometry and newest beamforming techniques for global sound pressure level measurement and noise source assessment. Finally, the sound spectra will be compared to known theoretical prediction models for the noise emission estimation.
[1] Huang YF, Gan XJ, Chiueh PT. (2017). Life cycle assessment and net energy analysis of offshore wind power systems. Renewable Energy 102: 98-106. https://doi.org/10.1016/j.renene.2016.10.050
[2] Brooks TF, Pope DS, Marcolini MA. (1989). Airfoil self-noise and prediction. NASA Langley Research Center, Hampton, VA, Tech. Rep. NASA-RP-1218.
[3] Wagner S, Bareiss R, Guidati G. (1996). Wind Turbine Noise. Springer-Verlag. https://doi.org/10.1007/978-3-642-88710-9
[4] Oerlemans S, Sijtsma P, Méndez López B. (2007). Location and quantification of noise sources on a wind turbine. Journal of Sound and Vibration 299(4-5): 869-883. https://doi.org/10.1016/j.jsv.2006.07.032
[5] Howe MS. (1991). Aerodynamic noise of a serrated trailing edge. Journal of Fluids and Structures 5(1): 33-45. https://doi.org/10.1016/0889-9746(91)80010-B
[6] Amiet RK. (1975). Acoustic radiation from an airfoil in a turbulent stream. Journal of Sound and Vibration 41(4): 407-420. https://doi.org/10.1016/s0022-460x(75)80105-2
[7] Gruber M. (2012). Airfoil noise reduction by edge treatments. University of Southampton 229-229.
[8] Vathylakis A, Chong TP, Joseph PF. (2015). Poro-serrated trailing-edge devices for airfoil self-noise reduction. AIAA Journal 53(11): 3379-3394. https://doi.org/10.2514/1.J053983
[9] Sandberg RD, Jones LE. (2011). Direct numerical simulations of low Reynolds number flow over airfoils with trailing-edge serrations. Journal of Sound & Vibration 330(16): 3818-3831. https://doi.org/10.1016/j.jsv.2011.02.005
[10] D'Alessandro V, Clementi G, Giammichele L, Ricci R. (2019). Assessment of the dimples as passive boundary layer control technique for laminar airfoils operating at wind turbine blades root region typical Reynolds numbers. Energy 170: 102-111.
[11] Gruber M, Joseph P, Chong T. (2011). On the mechanisms of serrated airfoil trailing edge noise reduction. In 17th AIAA/CEAS Aeroacoustics Conf., Portland, OR. https://doi.org/10.2514/6.2011-2781