P. Suardana*![]() | M. Sumadiyasa
| M. Sumadiyasa![]() | Ni Wayan Sudatri
| Ni Wayan Sudatri![]() | W. G. Suharta
| W. G. Suharta![]() | Anak Agung Ngurah Gunawan
| Anak Agung Ngurah Gunawan![]()
© 2024 The authors. This article is published by IIETA and is licensed under the CC BY 4.0 license (http://creativecommons.org/licenses/by/4.0/).
OPEN ACCESS
The objective of this study was to synthesize α-Fe2O3 (hematite) crystals through a mechanical precipitation approach and investigate the influence of elevated annealing temperatures on their optical and magnetic properties. Initially, iron sand was mechanically ground into fine powder using an agate mortar. This powder was then solubilized in 400 mL of 37% HCl and subsequently filtered using Whatman filter paper No. 42. The resulting filtrate was stirred magnetically at 200 rpm while ammonium hydroxide was gradually introduced until a pH of 8 was achieved, precipitating the desired product. The precipitate was separated, washed with deionized water, and dried on a hot plate at 100℃ for one hour. The dried product was divided into four samples and each was subjected to annealing at temperatures of 300℃, 400℃, 500℃, and 550℃ for one hour, respectively. X-ray diffraction (XRD) analysis, corroborated by the Crystallographic Open Database (COD), confirmed that the synthesized hematite crystals exhibited a hexagonal structure belonging to the R-3c space group. A notable decrease in grain size was observed with increasing annealing temperature, shrinking from approximately 0.44 µm at 300℃ to around 0.36 µm at 500℃. This trend suggests that higher temperatures facilitate the disintegration of aggregates into finer particles. Vibrating Sample Magnetometry (VSM) revealed that the hematite crystals possessed high coercivity and remanence, both of which decreased with rising annealing temperatures, indicative of their ferromagnetic nature. UV-Visible spectroscopy identified maximum absorption within the 200-202 nm range, with the peak absorption occurring at 201.56 nm for crystals annealed at 500℃. Additionally, bandgap energy was observed to increase from 2.632 eV at an annealing temperature of 300℃ to 3.708 eV at 550℃. In conclusion, the mechanical precipitation method effectively produced ferromagnetic hematite microparticles from natural iron sand, with their properties significantly influenced by the annealing temperature. These findings offer insights into the tunable nature of hematite's optical and magnetic characteristics, with implications for their application in various technological domains.
band gap, ferromagnetic, hematite, iron sand, hysteresis magnetic, mechanical precipitation
Hematite (α-Fe2O3), also recognized as iron (III) oxide, garners significant interest due to its exceptional optical and magnetic properties. Notably, it absorbs light across the visible to near-infrared spectra and exhibits a band gap energy generally ranging from 2.0 to 2.2 eV in bulk form. At low temperatures, hematite displays weak ferromagnetism. Moreover, its environmental benignity, biocompatibility, and resistance to corrosion enhance its appeal for extensive research exploration. This introduction and literature review synthesizes the current state of knowledge concerning hematite's potential applications, as reported in recent studies.
Powell et al. [1] demonstrated that hematite nanorods could undergo radio frequency heating, yielding specific absorption rate (SAR) values surpassing those of bulk hematite. The promise of iron oxide nanoparticles (IONPs) in medical imaging has been highlighted by Avasthi et al. [2]. The synthesis of hematite nanorods from hydrothermally produced goethite nanorods, calcined at 5000℃ and their potential as MRI contrast agents and in photothermal therapy, were presented by Gulzar et al. [3]. The efficacy of magnetite hematite/carbon nanosphere composites as photocatalysts for N2/H2O reactions to synthesize ammonia was reported by Zhang et al. [4]. The biomedical applications of hematite nanoparticles were explored by Miri et al. [5]. The sol-gel synthesis of porous hematite nanostructures targeting supercapacitor applications was described by Shivakumara et al. [6]. Zeng et al. [7] observed that the introduction of oxygen vacancies through sol-gel synthesis and precursor calcination enhanced the electrochemical performance of hematite nanoparticles, deeming them suitable for lithium battery anodes.
The feasibility of employing hematite nanoparticles as photoanodes in dye-sensitized solar cells following Fe(III) photolysis was reported by Ali et al. [8]. Chihi et al. [9] investigated the biosynthesis of hematite nanoparticles, noting the influence of FeCl3 precursor concentration on particle size and band gap. The solvothermal synthesis of ellipsoidal hematite nanostructures using ethylenediamine was elucidated by Xu et al. [10]. The impact of the reducing agent NaBH4 on the morphology, structure, and magnetic properties of nano hematite was studied by Saravanakumar et al. [11]. PVP-assisted synthesis of ferromagnetic flower-like hematite utilizing a high-temperature solution method was described by Xu et al. [12]. The comparative analysis of hematite nanoparticles synthesized by polyol and precipitation methods, focusing on their structural, morphological, and optical properties, was conducted by Mansour et al. [13]. The sol-gel synthesis of ferromagnetic hematite nanoparticles was reported by Jayaseelan et al. [14]. Mechanochemical and magneto-chemical synthesis of hematite nanoparticles was detailed by Sorescu and Diamandescu [15]. Hosny et al. [16] explored the synthesis of hematite nanoparticles using Fe-doped POAP as a precursor.
Khoiroh et al. [17] discussed the thermal transformation of FeOOH into hematite pigment, while Rafi et al. [18] employed polysaccharide templates in the thermal decomposition method to synthesize hematite nanoparticles. The surfactant-free hydrothermal process for synthesizing hematite was presented by Srivastava et al. [19]. The thermal decomposition of iron (III) nitrate to form pomegranate-like hematite was reported by Tadic et al. [20]. The controlled hydrothermal synthesis of nano hematite was examined by Chen and Lin [21]. The influence of pH and fulvic acid concentration on the stability of hematite nanoparticles was studied by Palomino and Stoll [22]. The hydrothermal synthesis of polyhedron-shaped hematite using FeCl3 and NH4OH was reported by Khalil et al. [23]. Allia et al. [24] compared the magnetic properties of pure and doped hematite nanoparticles synthesized by wet reaction. Lastly, Almarasy et al. [25] discussed the potential of hematite nanoparticles as flocculants in the treatment of raw water for drinking purposes. An earlier study into the crystal structure of sand from Tegal Lenga beach revealed the presence of magnetite microparticles [26]. Understanding the optical and magnetic properties of metal oxide materials, particularly hematite nanoparticles, is crucial for assessing their suitability for varied application fields. This investigation reports on the effects of annealing on the optical and magnetic properties of hematite crystals synthesized via the mechanical precipitation method. Here, we seek to expand upon the existing knowledge base by providing further insight into these effects, aiming to contribute to the advancement of applications that leverage hematite's unique properties.
Iron sand is extracted from Lokapaksa beach sand. Lokapaksa Beach is an expanse of beach in Lokapaksa Village, Seririt Subdistrct, Buleleng Regency, Bali, Indonesia. The Lokapaksa Beach iron sand is visible on the top surface of the beach sand, it is shiny black which is different from the surrounding sand color, the grains are finer than other grains of sand, and are only found on the north coast of Bali Island.
Lokapaksa beach sand is cleaned of dirt, washed, rinsed with distilled water, and dried in the hot sun. Iron sand is separated from non-iron sand (non-iron sand is sand that is not attracted by a magnet) using a magnetic segregation method. To obtain the fine powder of iron sand, the iron sand that has been separated from the non-iron sand is crushed by an agate mortar and pestle for twenty hours. Non-magnetic dust (non-magnetic dust is dust that is not attracted by a magnet) is separated using the magnetic separation method and followed by washing, rinsing with ion-free water, and drying at 100℃ for one hour with a hotplate type SP 88857105.
To produce a hematite crystal phase, 200 grams of fine powder of iron sand is mixed with 400 milliliters of HCl (37%) solvent. At the same time, it was stirred with a hotplate magnetic stirrer (Hotplate SP 88857105) set at 200℃ and 500 rotations per minute for an hour. Next, the Whatman 42 filter paper was used to filter the solution of fine powder of iron sand and HCl 37%. The filtrate was stirred by a magnetic stirrer hotplate set at 100℃ and 100 rotations per minute for one hour while ammonium hydroxide was added slowly until the acidity level (pH) was 8 [17] and a precipitate was formed accompanied by a change in the color of the solution. The precipitate was separated from the solvent with Whatman filter paper No. 42, then washed with DI water to obtain a clean reddish-brown residue. Finally, this residue was heated on a hotplate at 100℃ for one hour.
The dried residue was divided into four equal amounts to be heated on a hotplate at 300℃, 400℃, 500℃, and 550℃ for 2 hours. To determine the phase and structure, surface morphology and granularity, magnetic properties, and optical properties of each synthesized sample, each sample was successively characterized using the following equipment: XRD equipment, brand: PANalytical, type: XPert PRO; SEM equipment, brand: JSM-6510LA Analytical Scanning Electron Microscope; VSM magnetometer, brand: VSM 250; and UV-Vis Spectrometer UV-1800 Series.
3.1 XRD characterization
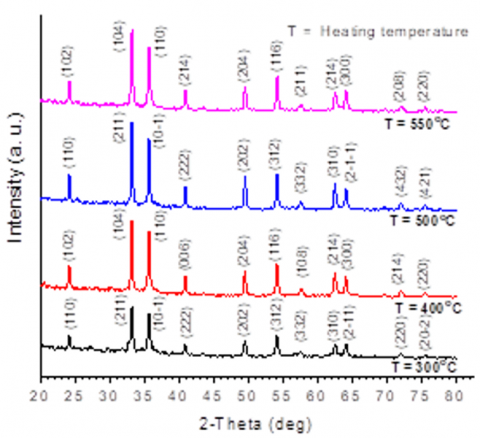
All iron sand fine powder metal oxide samples have been characterized using an XRD machine that has been set to λ = 1.5406 Å from the Cu anode, generator at 30 mA and 40 kV, the temperature at 25℃, measuring angle 2θ in the range 20o to 80o. The XRD patterns of all fine powder samples of natural iron sand that have been heated successively at 300℃, 400℃, 500℃, and 550℃ are shown in Figure 1. The results of XRD data analysis by matching the structure of each sample with the crystallography open database (COD) and using Match! and Rietica obtained cell parameters and viability values of each sample as shown in Table 1. This shows that by extracting Lokapaksa Beach fine powder of natural iron sand using the mechanical precipitation method, a hematite crystal phase with a hexagonal crystal system in the R-3c space group can be obtained. The structure and lattice parameters obtained are almost the same as those reported by previous researchers, namely hexagonal hematite (α-Fe2O3) with lattice constants a=b= 5.026 Å and c=13.735 Å which are in agreement with the standard values (ICSD code 415251) [17].
Figure 1. XRD pattern of hematite crystals from a fine powder of natural iron sand with heating temperatures of 300℃, 400℃, 500℃, and 550℃
In Figure 1, it can be seen that when heated to 300℃, 400℃, and 500℃ there is an increase in the height (intensity) of the diffraction peaks for the 2q-angle characteristic of the hematite crystal phase. There is also a narrowing in the full width at half maximum (FWHM) of the diffraction pattern peaks. The analysis results show a decrease in the goodness of fit (GoF) value (last column of Table 1) as the heating temperature increases. This indicates that up to the heating limit of 500℃, there is an increase in crystallinity in the sample. Meanwhile, at 550℃ heating, there was a decrease in peak height accompanied by a widening of the FWHM and a decrease in the GoF value compared to the diffraction pattern peaks at 500℃ heating. This indicates a decrease in the crystallinity quality of the sample. It is suspected that structural changes occur, as shown in Table 1, where when heated to 550℃ the lattice parameters in the c-axis direction change drastically.
Table 1. Lattice parameters and viability numbers of four iron sand fine powder sample
|
T (℃) |
COD Code |
Cell Parameters (Å) |
RP |
RWP |
Rexp |
GoF |
|
|
a = b |
c |
||||||
|
300 |
9015065 |
5.5168±0.0003 |
13.7602±0.0036 |
34.41 |
45.80 |
31.40 |
3.728 |
|
400 |
1546383 |
5.0335±0.0003 |
13.7503±0.0009 |
34.63 |
46.99 |
31.52 |
2.223 |
|
500 |
9015964 |
5.0309±0.0008 |
13.7747±0.0014 |
35.83 |
44.82 |
31.70 |
1.999 |
|
550 |
1546383 |
5.5168±0.0003 |
55.1009±0.0038 |
45.86 |
56.17 |
31.86 |
3.108 |
3.2 SEM characterization
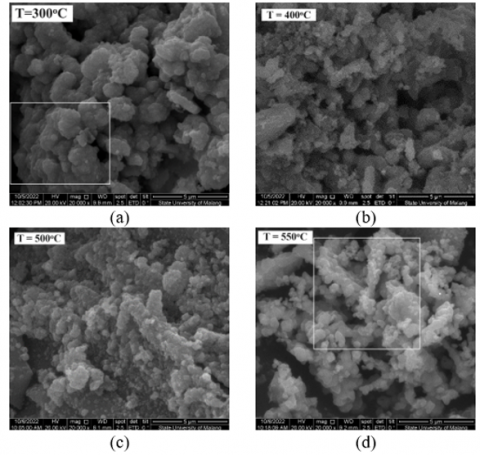
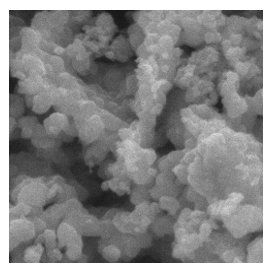
Figure 2 shows SEM images of the four synthesized hematite samples heated at 300℃, 400℃, 500℃, and 550℃, respectively. Figure 3(a), which is an excerpt from Figure 2(a), shows that heating at a temperature of 300℃ forms aggregates with an almost circular surface. Each aggregate is built up from a pile of grains. Increasing the heating temperature causes the aggregate shape to become less clear and grains that are close to spherical are formed, as seen in Figure 4.
Figure 2. SEM images of hematite crystal samples from a fine powder of natural iron sand heated at 300℃, 400℃, 500℃, and 550℃
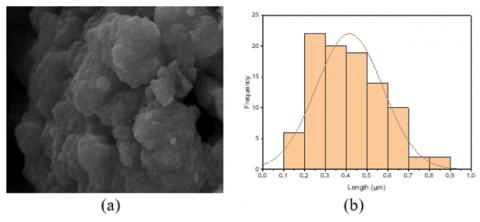
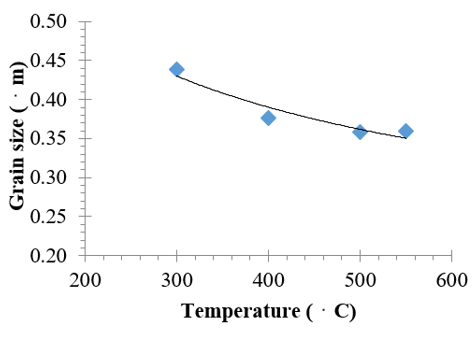
The grain diameter distribution for each heating temperature is shown in Figure 5. The grain diameter of the samples was observed to be in the range of 0.1-0.6 µm, and the average grain sizes of the samples heated at temperatures of 300℃, 400℃, 500℃, and 550℃, were 0.43909±0.02226 µm, 0.37643±0.0034 µm, 0.3587±0.00279 µm, and 0.3592±0.00371 µm, respectively. This grain size is larger than that obtained by Khoiroh et al. [17] namely 0.17±0.051 µm calculated by the Scherer method using XRD characterization data. It appears that the crystal size calculated using XRD data is different from the particle (grain) size obtained using SEM, this is because with the SEM what is measured is the grain size, whereas with the XRD what is measured is the crystal domain that makes up the grain [20].
Figure 3. (a) The aggregate layered structure is composed of a stack of planes (excerpted from Figure 2(a)); (b) Aggregate surface diameter distribution
Figure 4. Surface morphology of hematite grains (excerpted from Figure 2(d))
Figure 5. Distribution of grain diameters of hematite crystal samples from a fine powder of natural iron sand heated at 300℃, 400℃, 500℃, and 550℃
The pattern of changes in grain size is graphically as in Figure 6. It can be seen that the grain size tends to decrease with increasing heating temperature. This shows that increasing the heating temperature results in the decomposition of the aggregate into its constituent crystal parts.
Figure 6. The change in grain size
3.3 VSM characterization
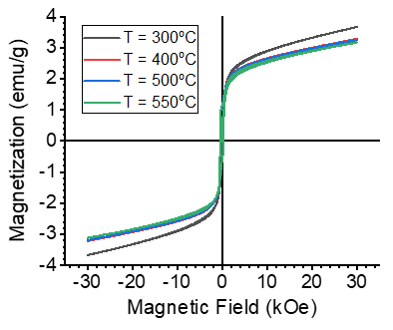
The magnetic properties of all hematite crystal samples from a fine powder of iron sand have been measured using a VSM 250 magnetometer. The results of the measurements of the four samples at room temperature are shown by the magnetic hysteresis curve in Figure 7.
Figure 7. Hysteresis curve of hematite crystal samples of fine powder of iron sand with different heating temperature
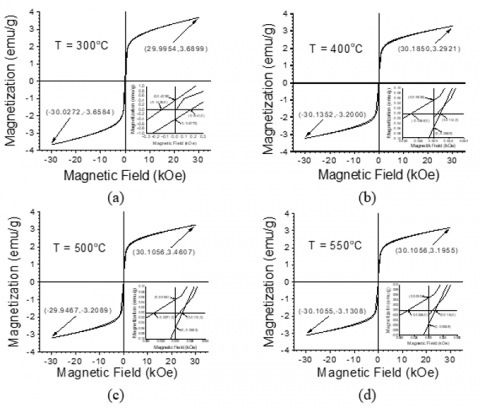
Figure 8 shows the magnetic hysteresis loop at room temperature for the heated sample at temperatures of 300℃, 400℃, 500℃, and 550℃ in a magnetic field from -30 kOe to +30 kOe. It can be seen that the magnetization almost increases linearly at magnetic fields above 10 kOe, there is no saturation magnetization for the four samples up to the application of a maximum magnetic field Hmax= 30 kOe. The remanent magnetization (MR), saturation magnetization (MS), maximum magnetic field (Hmax), and coercive magnetic field (HC) for each sample are given in Table 2.
Figure 8. The magnetic hysteresis of hematite crystal samples from a fine powder of natural iron sand heated at 300℃, 400℃, 500℃, and 550℃
Table 2. Physical quantities values of the magnetic hysteresis curve of hematite crystals for heating temperatures of 300℃, 400℃, 500℃, and 550℃
|
T (℃) |
HC (kOe) |
MR (emu/g) |
Hmax (kOe) |
MS (emu/g) |
|
300 |
0.1539 |
0.4056 |
30.0113 |
3.6742 |
|
400 |
0.0241 |
0.0547 |
30.1601 |
3.2461 |
|
500 |
0.0240 |
0.0542 |
30.0262 |
3.3348 |
|
550 |
0.0236 |
0.0531 |
30.1056 |
3.1632 |
In Table 2, it can be seen that the sample heated at 300℃ had the highest remanent magnetization, saturation magnetization, and coercive magnetic field compared to the others. The value of remanent magnetization and saturation magnetization is almost half of the same magnitude in hematite produced by Tadic et al. [20], and the coercive magnetic field is almost 0.1 of the coercive magnetic field of bulk hematite. High magnetization (MR and MS) may arise from uncompensated surface spin that is parallel and in the same direction as the direction of the external magnetic field. Apart from that, in Table 2, it can also be seen that heating at 300℃ to 550℃ decreases the magnitude of the coercive magnetic field, remanent magnetization, and saturation magnetization. The decrease in magnetic properties is consistent with a decrease in crystallinity and the average grain size. Therefore, it can be assumed that the magnetic properties of the hematite synthesized in this study are influenced by the crystal size.
The saturation magnetization value MS of all samples (Table 2) is greater than that of bulk hematite (the value is 0.3 emu/g, Tadic et al. [20]). Hysteresis loops show that the hematite from all four samples has weak ferromagnetic behavior. Ferromagnetic materials such as ferromagnetic hematite are very sensitive to changes in magnetic fields, so they are needed in applications that utilize these magnetic properties, such as for magnetic hyperthermia [1], as a contrast agent in medical images [2].
3.4 UV-Vis spectroscopy characterization
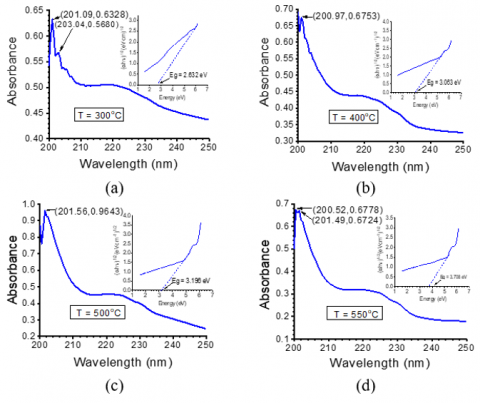
The optical properties of hematite samples from fine iron sand powder have been tested using a UV-Vis Spectrometer Type: UV-1800 Series. The test was done by dissolving 6 milligrams of each hematite powder sample with 3 milliliters of 96% ethanol for 2 hours. The filtrate from the filtration results is poured into a quartz cuvette for UV-Vis spectroscopic testing. The absorption spectrum curve of the UV-Vis Spectroscopy test results from four samples of hematite crystals heated at 300℃, 400℃, 500℃, and 550℃ are shown in Figure 9. The wavelength in this UV-Vis test was chosen in the range of 200 to 800 nm, but what is reported in this paper is only in intervals of 200–250 nm because the absorbance of the visible light spectrum decreases with increasing wavelength. In the four samples of hematite crystals that have been synthesized, absorption occurs in the ultraviolet spectrum, namely in the interval 200-235 nm.
Figure 9. Spectrum UV-Vis of four hematite crystal samples of fine powder of iron sand with different heating temperatures
The maximum absorption occurs in the interval 200-202 nm, with the highest absorbance found in hematite crystals with heating of 500℃ at a wavelength of 201.56 nm, this data agrees with that reported by Chihi et al. [9], namely the maximum absorbance of hematite NPs occurs at 258-266 nm (in the ultraviolet spectrum). From the UV-Vis spectroscopy data, a graph of (αhυ)1/2 versus hυ was created for each sample, as shown by the inset image in Figure 9. It can be seen that increasing the heating temperature from 300℃ to 550℃ increases the band gap from 2.632 to 3.708 eV. This band gap value is almost the same as that reported by Mallick and Dash [27], namely, α-Fe2O3 nanoparticles with band gap 2.67 eV, and also agrees with what was reported by Chihi et al. [9], namely, the band gap of the hematite NPs obtained increased from 2.56 to 2.95 eV as a result of decreasing the concentration of FeCl3.
The absorption of hematite crystals in the UV spectrum can be used as a dye on photoanodes in UV dye-sensitized solar cells (DSSC) [28].
Hematite crystals (α-Fe2O3) were successfully synthesized using a mechanical precipitation method with a hexagonal structure with an R -3 c space group. Increasing heating from 300℃ to 500℃ can increase crystallinity and UV absorption. The maximum UV absorption occurs at 500℃ heating at a wavelength of 201.56 nm. Increasing the heating temperature from 300℃ to 550℃ can reduce the coercive magnetic field HC from 0.1538 to 0.0236 kOe, the saturation magnetization MS from 0.4056 to 0.0531 emu/g, and the remanent magnetization MR from 3.6742 to 3.1632 emu /g. In terms of the optical properties of the sample, increasing the heating temperature from 300℃ to 550℃ can increase the band gap from 2,632 to 3,708 eV.
We thank the Research and Community Service Institute (LPPM) of Udayana University (UNUD) for the funding. This research was funded from PNBP Number: B/78.104/UN14.4.A/PT.01.03/2022 through the Udayana Flagship Research Scheme (PUU) 2022. We would also like to thank FMIPA and the Physics Department of UNUD for supporting laboratory facilities.
[1] Powell, C.D., Lounsbury, A.W., Fishman, Z.S., et al. (2021). Nano-structural effects on Hematite (α-Fe2O3) nanoparticle radiofrequency heating. Nano Convergence, 8(1): 1-9. https://doi.org/10.1186/s40580-021-00258-7
[2] Avasthi, A., Caro, C., Pozo‑Torres, E., Leal, M.P., García‑Martín, M.L. (2020). Magnetic nanoparticles as MRI contrast agents. Surface-modified Nanobiomaterials for Electrochemical and Biomedicine Applications, pp. 49-91. https://doi.org/10.1007/978-3-030-55502-3_3
[3] Gulzar, A., Ayoub, N., Mir, J.F., Alanazi, A.M., Shah, M.A., Gulzar, A. (2022). In vitro and in vivo MRI imaging and photothermal therapeutic properties of Hematite (α-Fe2O3) Nanorods. Journal of Materials Science: Materials in Medicine, 33(1): 10. https://doi.org/10.1007/s10856-021-06636-1
[4] Zhang, H.Z., Maimaiti, H., Zhai, P.S., Feng, L.R., Sun, J.Y. (2021). Preparation of magnetic hematite/carbon nanoscrolls composite photocatalysts and its performance in photocatalytic N2/H2O synthesis of ammonia. Journal of Nanoparticle Research, 24(2): 24. https://doi.org/10.1007/s11051-022-05413-7
[5] Miri, A., Khatami, M., Sarani, M. (2020). Biosynthesis, magnetic and cytotoxic studies of hematite nanoparticles. Journal of Inorganic and Organometallic Polymers and Materials, 30: 767-774. https://doi.org/10.1007/s10904-019-01245-6
[6] Shivakumara, S., Penki, T.R., Munichandraiah, N. (2014). Preparation and electrochemical performance of porous hematite (α-Fe2O3) nanostructures as supercapacitor electrode material. Journal of Solid State Electrochemistry, 18: 1057-1066. https://doi.org/10.1007/s10008-013-2355-1
[7] Zeng, P., Zhao, Y., Lin, Y., Wang, X., Li, J., Wang, W., Fang, Z. (2017). Enhancement of electrochemical performance by the oxygen vacancies in hematite as anode material for lithium-ion batteries. Nanoscale Research Letters, 12: 13. https://doi.org/10.1186/s11671-016-1783-0
[8] Ali, A.A., Al-Jorani, K.R., Abbood, A.F. (2023). Synthesis, characterization, and implementations for dye solar cell of new hematite nanoparticles using tetrasubstituted imidazole containing a benzimidazole moiety. Russian Journal of General Chemistry, 93(7): 1783-1790. https://doi.org/10.1134/S1070363223070204
[9] Chihi, S., Bouafia, A., Meneceur, S., Laouini, S.E., Ahmed, R.Z. (2023). Effect of precursor concentration on the bandgap energy and particles size for green synthesis of hematite α-Fe2O3 nanoparticles by the aqueous extract of Moltkia ciliata and evaluation of the antibacterial activity. Biomass Conversion and Biorefinery. https://doi.org/10.1007/s13399-023-04739-z
[10] Xu, C., Wang, Y., Chen, H. (2015). Facile synthesis of ellipsoidal hematite nanostructures via an EDA-assisted solvothermal method. Journal of Materials Science: Materials in Electronics, 26: 5446-5450. https://doi.org/10.1007/s10854-015-3100-6
[11] Saravanakumar, B., Jansi Rani, B., Ravi, G., Sakunthala, A., Yuvakkumar, R. (2017). Influence of reducing agent concentration on the structure, morphology and ferromagnetic properties of hematite (α-Fe2O3) nanoparticles. Journal of Materials Science: Materials in Electronics, 28: 8093-8100. https://doi.org/10.1007/s10854-017-6515-4
[12] Xu, C., Wang, Y., Chen, H., Nie, D., Liu, Y. (2015). PVP-assisted synthesis of flower-like hematite microstructures composed of porous nanosheets. Journal of Materials Science: Materials in Electronics, 26: 2982-2986. https://doi.org/10.1007/s10854-015-2786-9
[13] Mansour, H., Letifi, H., Bargougui, R., et al. (2017). Structural, optical, magnetic and electrical properties of hematite (α-Fe2O3) nanoparticles synthesized by two methods: polyol and precipitation. Applied Physics A, 123: 787. https://doi.org/10.1007/s00339-017-1408-1
[14] Jayaseelan, S.J., Parasuraman, K., Anburaj, D.B., Jothibas, M., Arunkumar, B. (2023). The impacts of Mn ion incorporation on the structural, optical, and magnetic properties of hematite NPs. Nanotechnology for Environmental Engineering, 8(1): 15-26. https://doi.org/10.1007/s41204-022-00271-z
[15] Sorescu, M., Diamandescu, L. (2010). Mechanochemical and magnetomechanical synthesis of hematite nanoparticles. Hyperfine Interactions, 196: 349-358. https://doi.org/10.1007/s10751-010-0164-9
[16] Hosny, N.M., Nowesser, N., Al Hussaini, A.S., Zoromba, M.S. (2016). Solid state synthesis of hematite nanoparticles from doped poly o-aminophenol (POAP). Journal of Inorganic and Organometallic Polymers and Materials, 26: 41-47. https://doi.org/10.1007/s10904-015-0284-4
[17] Khoiroh, L.M., Mardiana, D., Sabarudin, A., Ismuyanto, B. (2013). Synthesis of hematite pigments (alpha-Fe2O3) by thermal transformations of FeOOH. The Journal of Pure and Applied Chemistry Research, 2(1): 27-34. http://doi.org/10.21776/ub.jpacr.2013.002.01.120
[18] Rafi, M.M., Ahmed, K.S.Z., Nazeer, K.P., Siva Kumar, D., Thamilselvan, M. (2015). Synthesis, characterization and magnetic properties of hematite (α-Fe2O3) nanoparticles on polysaccharide templates and their antibacterial activity. Applied Nanoscience, 5(4): 515-520. https://doi.org/10.1007/s13204-014-0344-z
[19] Srivastava, M., Ojha, A. K., Chaubey, S., Singh, J., Sharma, P. K., Pandey, A.C. (2010). Investigation on magnetic properties of α-Fe2O3 nanoparticles synthesized under surfactant-free condition by hydrothermal process. Journal of Alloys and Compounds, 500(2): 206-210. https://doi.org/10.1016/j.jallcom.2010.03.245
[20] Tadic, M., Citakovic, N., Panjan, M., Stanojevic, B., Markovic, D., Jovanovic, Đ., Spasojevic, V. (2012). Synthesis, morphology and microstructure of pomegranate-like hematite (α-Fe2O3) superstructure with high coercivity. Journal of Alloys and Compounds, 543: 118-124. https://doi.org/10.1016/j.jallcom.2012.07.047
[21] Chen, Y.H., Lin, C.C. (2014). Effect of nano-hematite morphology on photocatalytic activity. Physics and Chemistry of Minerals, 41: 727-736. https://doi.org/10.1007/s00269-014-0686-9
[22] Palomino, D., Stoll, S. (2013). Fulvic acids concentration and pH influence on the stability of hematite nanoparticles in aquatic systems. Journal of Nanoparticle Research, 15: 1428. https://doi.org/10.1007/s11051-013-1428-5
[23] Khalil, M., Yu, J., Liu, N., Lee, R.L. (2014). Hydrothermal synthesis, characterization, and growth mechanism of hematite nanoparticles. Journal of Nanoparticle Research, 16: 2362. https://doi.org/10.1007/s11051-014-2362-x
[24] Allia, P., Barrera, G., Bonelli, B., Freyria, F.S., Tiberto, P. A.O.L.A. (2013). Magnetic properties of pure and Eu-doped hematite nanoparticles. Journal of Nanoparticle Research, 15: 1-12. https://doi.org/10.1007/s11051-013-2118-z
[25] Almarasy, A.A., Azim, S.A., Ebeid, E.Z.M. (2019). The application of hematite (α-Fe2O3) nanoparticles in coagulation and flocculation processes of River Nile Rosetta branch surface water. SN Applied Sciences, 1: 6. https://doi.org/10.1007/s42452-018-0006-y
[26] Suardana, P., Sumadiyasa, M., Hendrawan, I. G. (2022). Study of magnetite crystal structure extracted from local sands of Tegal Lenga Beach. Journal of Materials Science and Chemical Engineering, 10(9): 1-9. https://doi.org/10.4236/msce.2022.109001
[27] Mallick, P., Dash, B.N. (2013). X-ray diffraction and UV-Visible characterizations of α-Fe2O3 nanoparticles annealed at different temperature. Nanoscience and Nanotechnology, 3(5): 130-134.
[28] Albulescu, D., Ursu, D., Rusnac, L.M., Nitu, S., Miclau, M., Vajda, M. (2022). Investigation of UV dye-sensitized solar cells based on water electrolyte: A new insight for wavelength-selective greenhouse. Crystals, 12(1): 98. https://doi.org/10.3390/cryst12010098