Sumit Choudhary | Rajesh Gupta | Abhishek Jain | Sandeep Chaudhary*
© 2021 IIETA. This article is published by IIETA and is licensed under the CC BY 4.0 license (http://creativecommons.org/licenses/by/4.0/).
OPEN ACCESS
Concrete is a basic engineering material used for developing modern structures. The engineering properties of structures can be enhanced by using different concrete grades in the same structural element based on its specific requirement in functionally graded concrete (FGC). For meticulous critical inspection, an experimental investigation was prosecuted on three different types of concrete (conventional concrete (CC), rubber fiber concrete (RFC) and rubberized functionally graded concrete (RFGC)), and their properties were compared. The fine aggregate was substituted (by volume) with waste rubber fiber by 5, 10, 15, 20 and 30% to prepare RFC and RFGC. Tests were performed on concrete samples to analyze compressive strength, flexural strength, water permeability, and drying shrinkage. Moreover, scanning electron microscopy (SEM) was utilized to observe the microstructures. Results indicated that RFGC performed better than CC and RFC and can be used to prepare precast structures and for the applications where high flexural load acts.
fine aggregate, rubber fiber, rubber fiber concrete, rubberized functionally graded concrete
Concrete contains different raw materials viz. cement, fine aggregate, coarse aggregate, and water. These raw materials are being utilized at a very high level, as the construction in this new era is a key to development. Due to the high rate of construction, these materials are becoming nowadays scarcer and costlier. To save the depletion of the virgin raw materials is a pre-eminent issue. On the other hand, different types of wastes are being produced at a very large scale all over the world, and their deposition is also a major issue [1]. Hence, few of these waste products can be used in concrete, which will save the natural resources and the environment from the deposition of wastes [2-5]. There are many non-biodegradable wastes such as rubber fiber, glass waste, plastic waste etc. that can replace raw materials in the concrete. Researchers are carrying out extensive studies on the replacement of these wastes in concrete [6-8].
The developing automobile sector has certainly increased rubber consumption as tires, which further creates a disposal issue [9]. The disposal of waste rubber tire is a huge problem as recycling becomes very difficult due to its highly complex structure. The discarded tire is getting accumulated in the environment, which is a very dreadful problem [10]. Hence, the incorporation of waste tire in concrete can be a better substitute for the disposal of these wastes, as this saves the virgin raw materials and shows productive outcomes (sustainable approach). Many researchers have carried out work on the employing of waste rubber tire in concrete. A lot of attributes of concrete are influenced by the incorporation of waste rubber tire in concrete. As per the studies by Gerges et al. [11], Gupta et al. [3], Hernández-Olivares and Barluenga [4], with the increase in the waste rubber tire, the workability of the concrete decreased. Alike results for workability were perceived in other literatures [2, 12, 13]. Nevertheless, Wang et al. [14], and Aiello and Leuzzi [15] delineated that the workability was improved with the use of rubber tire chips in concrete as a replacement. According to the studies done by different researchers, an increase in the rubber content tends to decline compressive strength [3, 10, 13, 16-18]. Further, studies carried out by Sohrabi and Karabalaie [19] and Gupta et al. [8] by using silica fume in rubberized concrete showed a certain increment in the compressive strength. The better pore structure due to the usage of silica fume was the reason behind this increase as stated by them. However, in the literature, it was seen that with an increase in crumb rubber as coarse aggregate, the compressive strength of rubberized concrete declined [20-22]. Moreover, a few pieces of the literature showed increasing flexural strength results with increment in the percentage of rubber tire content [3, 23-27]. Gupta et al. [3] performed the flexural strength test on RFC with the varying w/c ratio and observed higher strength for higher rubber fiber content. Nevertheless, some other studies showed decreasing flexural strength with the increment in rubber tire content [10, 15, 16, 28]. The tests performed on the water permeability showed higher penetration depth values with increasing rubber tire as competed to conventional concrete [8, 20, 28]. Ganjian et al. [16], in their study, also established the same relation for the water permeability for the rubberized concrete. The studies done before have shown that drying shrinkage increased with increasing scrap rubber tire [29-31]. Bentur and Goldman [32] and Gupta et al. [8] used silica fume and reported a decrease in the shrinkage strain values. The microstructure study using scanning electron microscopy (SEM) of RFC was done by Gupta et al. [33], and the outcomes showed weaker interfacial bonding between the rubber fiber and the cement paste which was the major cause behind the low strength. A similar study carried out by Gerges et al. [11] also expressed better bonding among aggregates and cement for conventional concrete (CC) as compared to rubberized concrete. The weak bonding for rubberized concrete was related to the cracks and gaps at the interface of cement and rubber.
Functionally graded materials (FGM) are suggested as modern materials to obtain the desired functioning by varying their properties. When such changes are made in the reinforced concrete, then it is said to be functionally graded concrete (FGC). FGC can be characterized by alteration in the structure that shows the corresponding change in properties of the concrete. In other words, FGC is an unceasingly graded concrete that has distinctive properties in the top or bottom profile of concrete [34]. Different approaches have been adopted by researchers to prepare functionally graded concrete. Sridhar et al. [34], used fiber engineered cementitious composites (HYFECC) functionally graded materials to prepare functionally graded reinforced concrete (FGRC) specimens having three layers, each of 25 mm thickness in the tension zone. They evaluated the dynamic characteristics of FGRC with several proportions of damage levels as 50%, 70% and 90% of maximum ultimate load, and reported that static load increased with a rise of HYFECC layers in FGRC beams as compared to the normal concrete beams. Liu et al. [35] in their study on FGC prepared by steel fibers showed lowered compressive strength values and increased flexural strength values. Steel fibers used had a length of 60 mm and an aspect ratio of 80. FGC was prepared in two equal layers and the percentage of fibers used was 40 kg/m3. Further, a correlation was established between compressive and flexural strength for quality assurance. Bajaj et al. [36] carried out a study on the functionally graded beams (FGB), having different strata of normal concrete and high-volume fly ash concrete (HVFAC). The interface of the two concrete was at 25, 75, and 125 mm. In HVFAC, cement was substituted with fly ash at a varying percentage (20, 35, and 55 %). It was observed that there was an increase of around 12.86% in the compressive strength and 3.56% in the flexural strength of the functionally graded specimens (prepared using normal concrete and HVFAC) as compared to normal concrete specimens. Shen et al. [37] in their study developed a functionally-graded fiber-reinforced cement composite (FGFRCC) containing four layers having different percentages of fiber content. The fiber used was polyvinyl alcohol (PVA) fiber, and the extrusion and pressing technique was used to develop the FGFRCC. FGFRCC was made for the varying percentage of fibers ranging from 0-2% in tensile and tension zone. Increased flexural strength of up to 50% was observed. To equate the design pattern and total content of rubber fibers in FGFRCC, SEM analysis was done. Another study on functionally graded concrete was done by Mastali et al. [38] to determine the impact strength of FGRC slabs. The hooked steel fibers were used for the preparation of FGRC instead of reinforcement bars, and the slab was cast in five layers. FGRC was cast in a way that the first and the fifth layer had 2% fiber, the second and the fourth had 1% fiber, and the third or the central layer had 0.5% fiber. After the tests, they concluded that FGRC showed the best results for impact test as competed to normal concrete and steel fiber reinforced concrete (SFRC).
It was observed from the above studies that the rubber fiber concrete (RFC) was better in tensile properties but was relatively weak in compressive properties. Inferior durability properties were observed for the concrete containing rubber fibers. Also, functionally graded concrete (FGC) can be a relatively new product to overcome the decreasing strength. However, no comprehensive studies are currently available on the rubberized functionally graded concrete (RFGC), as per the author’s best knowledge. In this paper, rubber fibers in varying percentages (5, 10, 15, 20 and 30%) have been used as a substitute to fine aggregates to prepare RFC and FGRC. FGRC contained two layers of equal thickness, having conventional concrete and rubberized concrete. The rubber fibers are ductile, and therefore, they can provide better tensile strength to concrete [39]. This article focuses on a comprehensive experimental program to examine the basic engineering properties like compressive strength, flexural strength, water permeability, and drying shrinkage of the RFC and RFGC mixtures. Compressive strength and flexural strength tests were performed to analyze basic mechanical properties, and water permeability and drying shrinkage tests were performed to analyze basic durability properties. Additionally, a microstructure study has been done by scanning electron microscope (SEM) to explore the interface bonding between the materials.
2.1 Materials
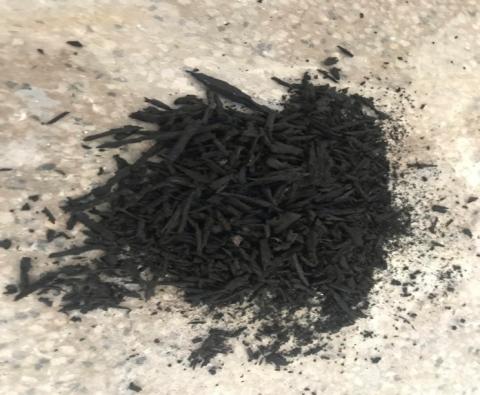
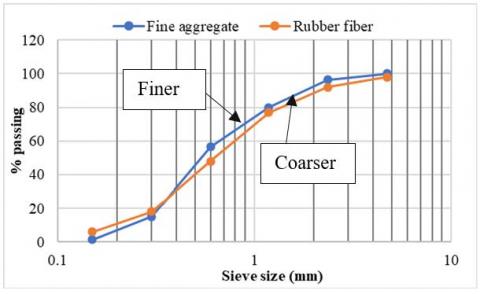
To prepare the concrete mixes, 43-grade ordinary Portland cement was utilized. Table 1 shows the physical properties and elemental evaluation of cement. For RFC and RFGC, waste rubber fiber was used as a substitute of fine aggregates (FA). Rubber fibers used had a width of 2 mm to 5 mm and a length of up to 20 mm (aspect ratio of 4 to 10) (Figure 1). The grain size distribution of rubber fiber and sand complying with IS 383 [39] has been shown in Figure 2. The crushed aggregates (10 mm and 20 mm) confirming to IS 383 [39] were used as coarse aggregates (CA). The physical properties of aggregates and rubber fiber are shown in Table 2.
Table 1. Physical properties and elemental composition of cement [40]
|
Physical properties |
Cement |
|
Consistency (%) |
27.0 |
|
Initial setting time (minutes) |
120 |
|
Final setting time (minutes) |
241 |
|
Specific gravity |
3.16 |
|
28 days compressive strength (MPa) |
45.8 |
|
Element (symbol) |
|
|
Oxygen (O) |
48.91% |
|
Calcium (Ca) |
30.93% |
|
Silicon (Si) |
12.07% |
|
Aluminium (Al) |
3.88% |
|
Iron (Fe) |
2.23% |
|
Magnesium (Mg) |
0.58% |
|
Sodium (Na) |
0.12% |
|
Potassium (K) |
1.23% |
|
Sulphur (S) |
0.05% |
|
LOI (%) |
3.97% |
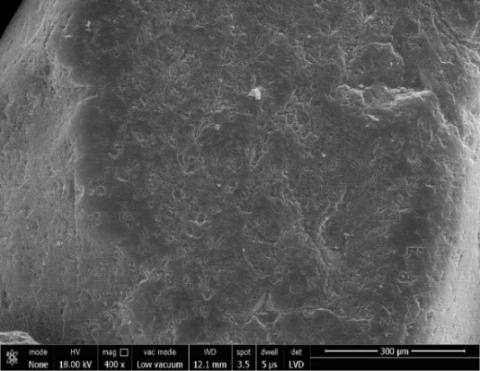
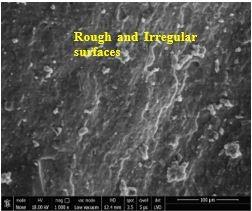
The SEM images of raw fine aggregates and the rubber aggregates are shown in Figure 3 and Figure 4 (a and b), respectively. From images, it can be easily revealed that the fine aggregate had a regular and harder surface, whereas the rubber aggregates were irregular and rough. Figure 4 (a and b) show some hollow spaces present in the rubber aggregates, which further creates large cavities in the concrete, and these pores are mainly responsible for the decrease in the strength [11]. For maintaining the flowability and stability, high range water-reducing admixture (HRWA) of “Master Glenium Sky 8777” was used.
Table 2. Physical properties of raw materials [41]
|
Properties |
Coarse aggregates |
Fine aggregates |
Rubber Fibers |
|
|
20 mm |
10 mm |
|||
|
Specific gravity |
2.73 |
2.69 |
2.63 |
1.08 |
|
Water absorption (%) |
0.4 |
0.4 |
0.1 |
Negligible |
|
Fineness Modulus |
6.43 |
5.96 |
2.5 |
2.61 |
Figure 1. Rubber fibers
Figure 2. Grain size distribution of fine aggregate and rubber fiber [40]
Figure 3. SEM image of fine aggregate at 400x magnification
(a)
(b)
Figure 4. SEM images of rubber fiber at (a) 2000x magnification and (b) 1000x magnification
2.2 Mix proportions
Three sets of concrete mixes were cast. The first set was of conventional concrete and the remaining two sets were cast using rubber fiber which was replaced partially with fine aggregate. The second set casting was of RFC for the replacement of FA by 5, 10 and 15%. In the third set, RFGC was cast for the replacement of 5, 10, 15, 20 and 30%. In all the three sets, the w/c ratio was kept unchanged as 0.4. For each similar replacement level of rubber fiber in RFGC and RFC, the same mix design was adopted (i.e. the mix design for 5% RFGC was same as the 5% RFC in one layer and CC in another layer). The details of the concrete mix are shown in the Table 3.
The materials were mixed in dry condition for 2-3 minutes initially. To perpetuate the workability and stability of the mix, high range water reducing admixture (HRWA) was used, which was kept constant at 0.5% of cement. When the mix secured proper workability and viscosity, the mixture was put in the mould and was vibrated by keeping those moulds on the table vibrator. The moulds filled with mix were then held for 24 hours at room temperature and were demolded.
2.3 Procedure for casting
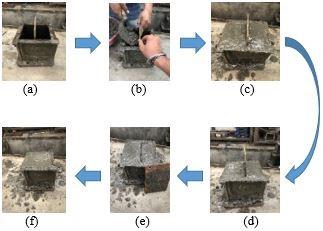
The casting of CC and RFC was done normally, and they contained the same mix throughout (i.e. control and rubberized concrete, respectively). For RFGC, the casting was done in two layers for which a thin ply of 1 mm thickness was used. This ply was kept in the mid of the mould, with one of the sides filled by control concrete while the other side by the rubberized concrete. After filling, the ply was pulled out, and the mould was vibrated by table vibrator. The step by step design of RFGC is shown in Figure 5 (a) mould with ply wood at mid; (b) different mix poured on both the sides; (c) mix filled and vibrated using table vibrator; (d & e) ply wood is pulled out of the specimen; (f) mould is vibrated to get the final cast). The same procedure of casting was opted by Wen et al. [42].
Figure 5. RFGC casting process
Three different sets of concrete (CC, RFC and RFGC) were cast. A set of samples cast for RFGC is shown in Figure 6. The fresh property of the concrete in terms of the workability was assessed by the slump-flow test as per IS 1199 [43]. The slump value was observed, from the test, for concrete mixtures containing different percentage (0-30%) of rubber fibers as a substitute to fine aggregate. RFGC contained two layers comprising CC and RFC, hence the mix designs were adopted accordingly (with respect to the replacements).
Figure 6. RFGC samples
The compressive strength, flexural strength, water permeability and the shrinkage strain values were evaluated for the casted cubes and beams to know the hardened properties of concrete. CC and RFC were examined normally. RFGC was examined in a way that the control concrete layer and rubberized concrete layer were in up and down manner (Figure 7). The compressive strength test was executed according to IS 516 [44] for 7 and 28 days on 100 mm concrete cubes. The load was applied at a rate of 140 kg/cm2/min. Flexural strength test was conducted using four-point loading system on beams (three for each mix) of 500 × 100 × 100 mm at 7 and 28 days of curing period according to the guidelines given in IS 516 [44]. The water permeability test was executed on 150 mm concrete cube samples for 28 days of curing as per DIN 1048 [45]. Water pressure of 0.5 N/mm2 was applied on samples for 72 hours and the water penetration depth was measured by splitting them into two parts. The drying shrinkage test was done on the concrete beam samples of 75 mm × 75 mm × 300 mm size for 28 days curing as per guidelines in ASTM C157 [46]. The stainless-steel studs glued to the beam samples were used to determine the change in length of the beams. The test was executed at 7, 14, 28, and 56 days after the initial reading, which was taken out after 24 hours of mounting of studs.
Figure 7. Testing procedure of RFGC samples
SEM test was performed on cubic samples (10 × 10 × 10 mm) to know the microstructural details of the bond between cement paste and aggregates at the intermediate layers (i.e., CC and RFC) for RFGC.
The results obtained from the above experiments were then compared in two phases. In the first phase, the strength of RFGC having substitution level 5%, 10% and 15% were competed with the strength of RFC having substitution level 5%, 10%, and 15%, respectively. In the second phase, the strength of RFGC having substitution level 10%, 20% and 30% were competed with strength of RFC having substitution levels of 5%, 10% and 15% respectively, taking into account the fact that in the RFGC the same volume of fibers was in the half of the layer of the concrete [47]. For example, RFGC having 5% rubber was compared to 5% RFC first, and later it was compared to 10% RFC. The experimental program has been also described in the flow chart form (Figure 8).
Table 3. Details of mixture (kg/m3)
|
Mix no. |
Cement |
Water |
FA |
CA |
Rubber fibers |
HRWR (%) |
|
|
10 mm |
20 mm |
||||||
|
CC |
364 |
163.8 |
764 |
449.7 |
674.6 |
0 |
0.5 |
|
RFC1 |
364 |
163.8 |
726 |
449.7 |
674.6 |
15.6 |
0.5 |
|
RFC2 |
364 |
163.8 |
688 |
449.7 |
674.6 |
31.2 |
0.5 |
|
RFC3 |
364 |
163.8 |
650 |
449.7 |
674.6 |
46.9 |
0.5 |
|
RFGC1 |
364 |
163.8 |
726 |
449.7 |
674.6 |
15.6 |
0.5 |
|
RFGC2 |
364 |
163.8 |
688 |
449.7 |
674.6 |
31.2 |
0.5 |
|
RFGC3 |
364 |
163.8 |
650 |
449.7 |
674.6 |
46.9 |
0.5 |
|
RFGC4 |
364 |
163.8 |
611 |
449.7 |
674.6 |
62.5 |
0.5 |
|
RFGC5 |
364 |
163.8 |
535 |
449.7 |
674.6 |
93.7 |
0.5 |
Figure 8. Experimental program
4.1 Workability
The value for workability is a prime indicator of the feasibility of utilization of waste in concrete. The workability was computed in terms of slump value and is shown in Figure 9. The slump value for all the mixes containing 0 to 30% rubber fiber ranged from 76 to 89 mm. The values of the slump systematically declined with the raise in rubber fiber content. The rubber aggregate had a rough and irregular surface texture (as viewed in Figure 4), which might have increased the inter-particle friction resulting in the decrease of the workability of the concrete. Gupta et al. [8] observed the similar trend of findings in their study on RFC for the different replacement percentages of rubber fiber with fine aggregates (ranging from 0-25%). Study done by Alsaif et al. [48] also reported that substitution of rubber aggregates with fine aggregate in steel fiber reinforced rubberized concrete (SFRRC) mixes significantly reduced workability.
However, all the concrete mixtures' slump value falls in the medium workability (50-100 mm) range. Hence replacement of up to 30% replacement of fibers is acceptable in terms of workability.
Figure 9. Slump value at different rubber fiber contents
4.2 Compressive strength
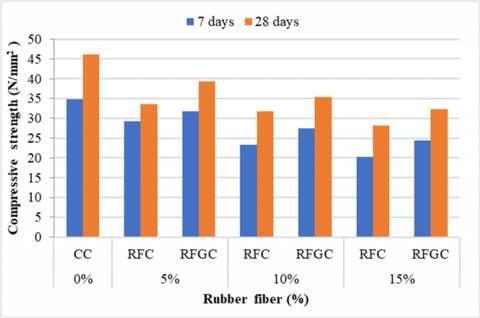
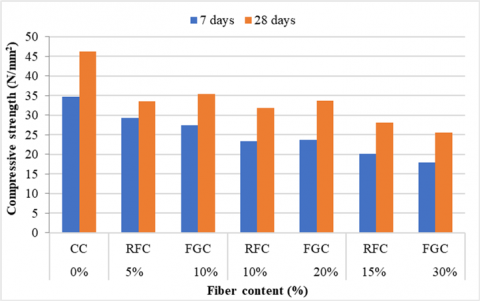
The values for the compressive strength of CC, RFC and RFGC are shown in Figure 10. The compressive strength values for all the mixes at 7 and 28 days curing ranged from 34.8 to 17.9 N/mm2 and 46.2 to 25.5 N/mm2, respectively. It was perceived that with the increment in the rubber fiber content, the value of compressive strength for RFC, as computed to CC, has decreased. Similarly, the value for the compressive strength of RFGC, as computed to CC, also decreased with the increase in rubber fibers content. Compressive strength value at 28 days curing period for initial replacement level of rubber fiber (i.e., 5%) for RFC and RFGC was 33.6 and 39.3 N/mm2 respectively, whereas for CC, the highest strength of 46.2 N/mm2 was observed. A similar reduction trend was observed at higher replacements. The reduction in compressive strength was due to the rubber fiber being less stiff as compared to the commercially available fine aggregate [49]. Hence, the load bearing capacity of the concrete was reduced, and the cracks appeared at early stages. The reason behind lower strength could also be a large number of pores/gaps present in the concrete at the interface of rubber and the cement paste (observed through SEM analysis as shown in Figures 14-17). Another reason behind the decrease of the compressive strength for the concrete having rubber fiber as a substitute of fine aggregate can be the higher concentration of rubber in the top layer of concrete (during vibration) as rubber fiber has lower specific gravity [16]. This resulted in a non-uniform distribution of the rubber fibers and made the mix a non-homogeneous one. Due to an effectively higher percentage of rubber concentrated on these parts, the effect of rubber on strength reduction was higher [50]. The lesser results for compressive strength were supported by other researchers also (Gerges et al. [11], Gupta et al. [3], Yilmaz and Degirmenci [27], Taha et al. [51]), who utilized rubber chips or fibers as a substitute of natural aggregates for the production of RFC.
On the other hand, the values of the compressive strength of RFGC at different fiber contents were more than that of RFC. RFC's compressive strength value at 28 days was 28.1 N/mm2 for 15% replacement level, whereas for RFGC, the value was 32.3 N/mm2. The value was observed more for RFGC as compared to RFC as half of the casted cube had normal concrete, and the remaining half comprised of mix having rubber fiber. Hence for RFGC, when the cube was subjected to compression loading, the failure was seen at the load larger than that of the concrete having fiber in the whole cube. Furthermore, the higher strength for RFGC (up to 20%) was observed for both the comparison phases (i.e., 1st and 2nd) with respect to RFC. When RFGC comprising 30% rubber was compared in the 2nd phase with 15% RFC, the compressive strength reduced, as the volume of the rubber was too high in the lower layer of FGC.
Sridhar et al. [34] evaluated the compressive strength of functionally graded reinforced concrete (FGRC) prepared with steel and polyvinyl alcohol fiber and observed higher compressive strength for FGRC than the reference concrete. The reason interpreted was the more significant drop in the amount of weak transition zone because of hybrid fibers. A study done by Bajaj et al. [36] on FGM cubes (having a layer of normal concrete and another layer of high volume fly ash concrete (HVFAC)) also showed, increase in compressive strength by 18% compared to normal concrete cubes and 10-12% on the comparison with fly ash concrete cubes. The reason behind the increase was stated as the better bond strength between the different layers. However, according to Liu et al. [35], the FGC's compressive strength containing plain cement concrete and steel fiber reinforced concrete showed a decrease in strength by 9.14%. The different strengths of two compounded layers of different concrete were mentioned as the reason behind the decrease in strength.
(a)
(b)
Figure 10. Effect of rubber fiber on compressive strength of different concrete (a) comparison for1st phase. (b) comparison for 2nd phase
4.3 Flexural strength
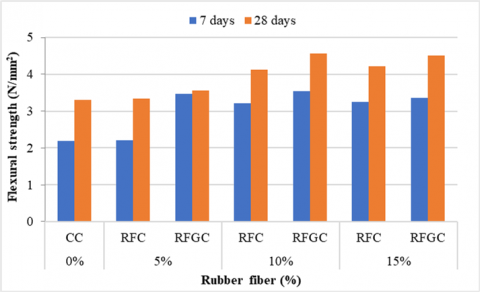
The flexural strength of CC, RFC and RFGC at 7 and 28 days for varying rubber fibers contents is shown in Figure 11. The flexural strength for all the mixes at 7 and 28 days ranged from 2.18 to 3.70 N/mm2 and 3.30 to 4.96 N/mm2 respectively. The increment in the rubber fiber content increased the flexural strength. It can also be discerned from the figure that the flexural strength for both RFC and RFGC is higher than CC. For example, the flexural strength value at 28 days curing period for initial replacement level of rubber fiber (i.e., 5%) for RFC and RFGC were 3.34 and 3.56 N/mm2, whereas for CC, the least value of 3.30 N/mm2 was observed.
Concrete is a superior mixture but relatively weak in tension; hence, fibers are used to act as the bars to provide better tensile strength. As fibers with aspect ratio 4 to 10 were used, the pulling resistance increased [34]. This increased pulling resistance can be the reason behind the increment in the flexural strength of concrete mixture having rubber fiber. The increment in flexural strength was also observed by Segre and Joekes [25], Wu et al. [26], Li et al. [20], Pacheco-Torgal et al. [21]. Ganjian et al. [16], in their study on rubberized concrete, showed that flexural strength decreased with the increment in chipped rubber as replacement of FA for which the poor bonding between the cement paste and the rubber aggregate was stated as the reason.
(a)
(b)
Figure 11. Effect of rubber fiber on flexural strength of different concrete (a) comparison for 1st phase. (b) comparison for 2nd phase
Moreover, when the RFGC and RFC samples were compared in the present study, RFGC showed better strength in both the comparison phases. For example, at the replacement percentage of 15% rubber fiber content, RFC's strength was 4.21 N/mm2 whereas, for RFGC, the values for 15% and 30% rubber fiber content were 4.72 N/mm2 and 4.35 N/mm2, respectively. The maximum flexural strength of 4.96 N/mm2 for RFGC was observed at a 20% replacement. The decrease in the strength was perceived for RFGC at the 30% replacement content when compared to 20% RFGC, which may be due to low inter-particle compatibility of rubber and other materials [33]. This may also be due to the concrete mixture's low workability having 30% rubber fiber (reported in section 4.1). Furthermore, flexural testing's primary mechanism is that the lower part of the beam, below the neutral axis, experiences tensile loading while the upper part experiences compression loading [52]. In the present case, the rubber fibers (in the lower layer) showed good resistance to pulling due to their ductile nature. Hence, with the increasing concentration of the rubber fibers, the flexural strength also increased. This mechanism mentioned above can be the reason behind the higher flexural strength of RFGC than the RFC. Also, it can be said that due to improved flexural resistance for increasing fiber content and better compressive resistance of CC at the top, with the same rubber volume utilization, RFGC performed far better than RFC or CC.
A study on FGFRCC made of polyvinyl alcohol (PVA) fibers was attempted by Shen et al. [37] and observed better flexural strength for FGFRCC as compared to FRCC. The cause stated was the higher amount of fibers in the tension zone, which provided better resistance to tensile stress. Bajaj et al. [36], in his study on the FGB prepared using HVFAC, reported a decrease in flexural strength due to concrete being weak in tension. Mastali et al. [38] underwent a study to determine the flexural strength of functionally graded beams (1.3% of volume steel fiber) and observed the strength of up to 15.5% greater than the control beams and reason was the higher absorption of energy during load application in the lower zone containing fibers. Also, Sridhar et al. [34] showed better flexural strength for FGRC prepared using PVA and steel fibers, and the reason was the bridging ability of micro-cracks due to hybridization of PVA and steel fibers.
4.4 Water permeability
(a)
(b)
Figure 12. Effect of rubber fiber on water permeability of different concrete (a) comparison for 1st phase. (b) comparison for 2nd phase
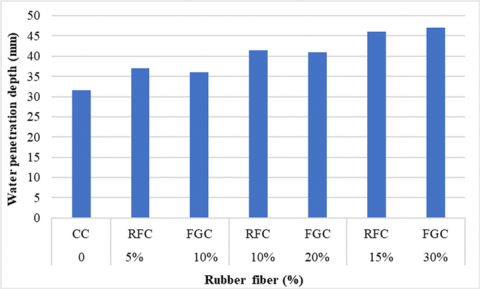
The water permeability values for CC, RFC, and RFGC are shown in Figure 12. It can be perceived from the figure that the water permeability increased with the increase in the rubber fiber content. The water penetration values for CC, RFC, and RFGC ranged from 31.5 mm to 47 mm. It can be noticed that CC had the lowest water penetration depth as compared to RFC and FGC. For example, the water penetration depth values for RFC and RFGC at the initial replacement level of rubber fiber (i.e. 5%) were 37 mm and 33 mm, respectively, whereas CC had the lowest value of 31.5 mm. A similar trend of increasing penetration depth was observed for increasing replacements. In the case of RFGC samples, the layer of CC and RFC reacted inversely, hence the average value of both the layer was treated as the penetration depth of the sample. The higher water penetration for RFC and RFGC maybe because of the rough and irregular morphology of rubber, which caused a large number of small cavities and gaps between cement paste and rubber fiber [50]. These cavities and gaps made concrete relatively more porous and allowed the water to penetrate through easily. Another reason behind the increase in water penetration could be the size of rubber fiber used. The rubber fibers used were in the size of 0 to 20 mm. If the fibers of smaller sizes were used, the pores or voids would be relatively less [10]. The same results were seen by Gupta et al. [3] for RFC.
Moreover, when the results for the RFGC samples were compared to RFC samples for comparison phases 1, it was discerned that the RFGC samples had lower penetration depth value. In comparison phase 2, comparable values were observed when RFGC10% and RFGC20% were competed to RFC5% and RFC10% respectively, whereas, RFGC30% had higher penetration values compared to RFC15%. For example, at the replacement percentage of 15% rubber fiber content, the water penetration for RFC was 46 mm, whereas, for RFGC, the values for 15% and 30% rubber were 40 mm and 47 mm, respectively. RFGC was cast with an upper layer with control concrete, which was relatively less porous than rubberized concrete and showed lower penetration values. The cumulative water penetration of CC and RFC was almost comparable with RFGC; hence, water penetration was lower in half layer of CC while it was higher for the RFC layer due to rubber fiber content.
4.5 Drying shrinkage
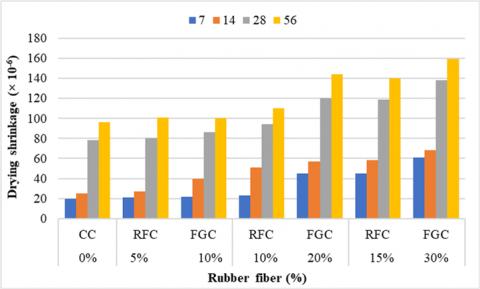
Figure 13 represents the values for drying shrinkage after 7, 14, 28, and 56 days of the initial reading of CC, RFGC, and RFC. The shrinkage values for different days ranged from 20 × 10-6 to 159 × 10-6. An increase in the shrinkage strain values was noted for the increasing content of rubber fibers. The values for shrinkage strain for RFC at all days were increasing compared to CC. Similarly, the value for the shrinkage strain of RFGC, as competed to CC, also increased with the increasing rubber fibers. After 28 days, for replacement level of 15% rubber fiber for RFC and RFGC, shrinkage strain value was 119 × 10-6 to 111 × 10-6, respectively, whereas for CC the lower strain of 78 × 10-6 was observed. Alike trend of increase was observed for other replacement levels. The increase in shrinkage values was due to the capability of deformation of rubber fibers [31]. Hence, at different ages, these rubber fibers supported to the disfiguring of modified concrete. Other reason behind the increase of shrinkage value can be the flexibility property of rubber fibers [29]. Due to an effectively higher percentage of voids in rubberized concrete, the higher strain values were obtained. Lower internal restraint (from lack of fine aggregate) can also be stated as the reason behind increased shrinkage values [29]. Similar kind of results were obtained by Gupta et al. [8] and Uygunoglu and Topcu [30] on the rubberized concrete. However, a study by Gupta et al. [8] on rubberized concrete added with silica fume showed decreased shrinkage strain values.
Moreover, when the RFGC samples having 5%, 10%, and 15% rubber fiber content was compared to RFC of similar replacement level (comparison phase 1), lower strain values were observed for each RFGC samples. Nevertheless, in the comparison phase 2, RFGC samples having 10% rubber fibers was comparable to RFC of 5%, and higher strain values were obtained for RFGC 20% and RFGC 30% when compared to RFC 10% and RFC 30%, respectively. The values are inverted due to the higher porosity at higher replacement percentages. A study done by Ma and Gao [53] for the drying shrinkage of the FGC segment used in shield tunneling also showed an increase in the shrinkage values.
(a)
(b)
Figure 13. Effect of rubber fiber on drying shrinkage of different concrete (a) comparison for 1st phase. (b) comparison for 2nd phase
4.6 Microstructure studies
4.6.1 Scanning electron microscopic (SEM) analysis
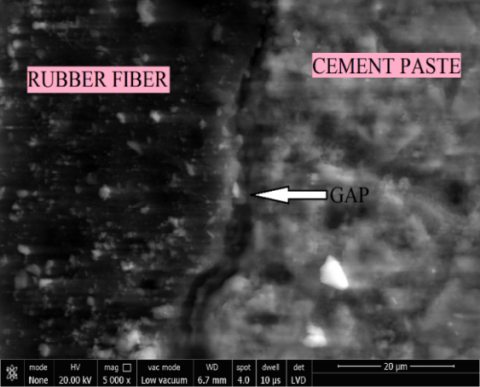
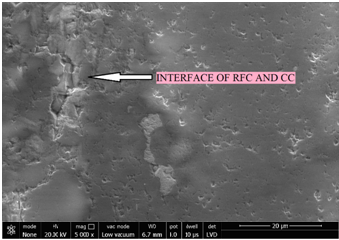
SEM was conducted on specimens to verify the internal microstructure. The SEM images for the maximum rubber fiber content at 30% RFGC and for normal CC are shown in Figures 13 and 14, respectively. Clear gaps were observed at the rubber aggregate and cement paste junctions in the SEM image (Figure 14) of RFGC sample. For a CC sample (Figure 15), the bonding for aggregate (natural CA) and cement paste was better than that of RFGC sample (Figure 14); hence higher compressive strength was observed for CC sample. According to the earlier studies [11, 16, 51], it was observed that there was a comparatively weak bonding in the concrete having rubber content than the normal conventional concrete due to the presence of gaps. These gaps were the leading cause behind the lesser compressive strength of RFC and RFGC. The samples having rubber showed a higher number of gaps and cracks between the rubber fiber and the cement paste, which subsequently resulted in higher water permeability depth. The same kind of results was obtained by Gupta et al. [8] on RFC. Moreover, Figure 16 shows the interface of RFC and CC in which minor cracks can be observed. Though the cube was properly vibrated while casting, the interface showed irregularities like cracks and gaps in the bonding at some places. These irregularities were responsible for the weaker strength. Figure 17 shows the cracks at rubber fiber and cement paste junctions. The interlayer of CC and RFC also influences the attributes of the concrete in the case of RFGC, as bonding plays an eminent role in the strength and durability properties of concrete [37].
Figure 14. SEM image for RFGC
Figure 15. SEM image for CC
Figure 16. SEM image of interface
Figure 17. SEM image for bonding of rubber fiber and cement paste
4.6.2 Energy dispersive X-ray spectroscopy (EDS) analysis
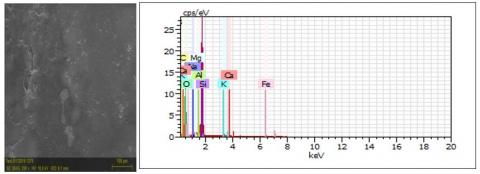
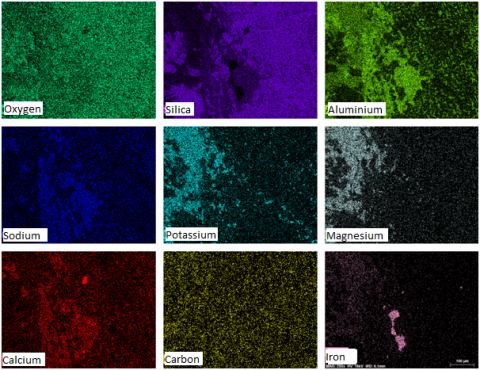
EDS analysis was performed for the distinctive characterization of elements present in the rubberized FGC's concrete sample, which can be seen in Figure 18. As seen from the figure, the major elements were carbon and magnesium, which confirmed rubber's presence on the interface of the RFGC specimen (Figure 16). Elements such as calcium, alumina, silica and sodium also had representative quantities. Due to silica (SiO2) and calcium carbonate (CaCO3), oxygen and carbon were observed in the sample. Carbon being a soft material, is also the reason behind the lower compressive strength of RFGC and RFC compared to control concrete. Other minor elements seen are potassium, iron, and oxygen. Figure 19 shows the concentration of different elements, as observed by mapping the sample. Paiva et al. [54] used two physically and chemically different pozzolans in concrete and observed their effect on mechanical and microstructure properties. They impregnated that the major elements on a preferred sample were silica and calcium, due to sand. The same reason was deprived in this study also for the presence of these elements in the RFGC sample.
Figure 18. EDS spectrum of RFGC sample.
Figure 19. X-ray maps of the elements.
The purpose of this study was to perform a detailed analysis of rubberized functionally graded concrete (RFGC) by carrying out experimental investigations to assess the suitability of rubber fiber as a replacement of fine aggregates in modified concrete (RFGC). The following can be deduced for the rubberized FGC by performing the above tests.
(1) Workability of the mix for RFC and RFGC decreased with an increase in the content of rubber fibers. The roughness and irregular texture of rubber fiber was probably the leading cause behind this decrease. However, the workability for all the designed concrete mixtures was found in the medium workability range and, therefore, can be used for casting of modified concrete without any additional efforts.
(2) Addition of rubber particles declined the compressive strength of RFC and RFGC. However, in RFGC, there was a layer of CC over RFC, which assisted in stress distribution and overcoming defects like non-homogeneity. This resulted in better compressive strength of RFGC as compared to RFC.
(3) Increase in the rubber fiber content increased flexural strength. In RFGC, the upper layer of CC offered better resistance to compression, and the lower layer of RFC offered better resistance to tensions; thus, RFGC performed better in flexure than CC or RFC.
(4) The higher water permeability values were encountered for the elevated content of rubber fibers due to increased voids, gaps, and microcracks. The values for RFGC were reduced as it contained two layers (CC and RFC), with CC showing a lower degree of water permeability.
(5) The increment in the rubber fiber content increased the drying shrinkage of the concrete because the rubber fibers used were flexible in nature and had the higher deforming capability. Hence, RFGC and RFC showed higher shrinkage strain at different days. However, due to the presence of CC layer, RFGC was superior to RFC.
(6) The microstructural analysis of RFGC showed gaps and cracks in between the rubber fiber and the cement paste, which led to the weaker interface bonding. This resulted in the weak strength and higher water penetration depth of the sample having rubber aggregates (i.e. RFC and RFGC).
The RFGC showed better results for compressive strength, water permeability and drying shrinkage as compared to the RFC, making it a better method of waste incorporation. Furthermore, the best value for flexural strength was found in the case of RFGC. This makes RFGC suitable to be applied in floors and pavements, concrete highways, hydraulic structures such as dam spillways and tunnels, or for other surfaces upon which the flexural forces are applied by moving or stationary objects during service.
The poor interfacial bonding between the two different mixes (i.e. RFC and CC, in case of RFGC) was an issue. Future studies can be carried out on some material that could be used as a separating film and could enhance the interfacial interaction.
The authors are thankful for the support of the Materials Research Centre, MNIT Jaipur, in guiding SEM-EDS analyses. The authors are thankful to the Department of Science and Technology, New Delhi, Government of India, for financial support (No. DST/INT/TUNISIA/P-01/2017).
[1] Jain, A., Gupta, R., Chaudhary, S. (2019). Performance of self-compacting concrete comprising granite cutting waste as fine aggregate. Construction and Building Materials, 221: 539-552. https://doi.org/10.1016/j.conbuildmat.2019.06.104
[2] Batayneh, M.K., Marie, I., Asi, I. (2008). Promoting the use of crumb rubber concrete in developing countries. Waste Management, 28(11): 2171-2176. https://doi.org/10.1016/j.wasman.2007.09.035
[3] Gupta, T., Sharma, R., Chaudhary, S. (2015). Influence of waste tyre fibers on strength, abrasion resistance and carbonation of concrete. Transactions on Civil Engineering (A), 22(4): 1481.
[4] Hernández-Olivares, F., Barluenga, G. (2004). Fire performance of recycled rubber-filled high-strength concrete. Cement and Concrete Research, 34(1): 109-117. https://doi.org/10.1016/S0008-8846(03)00253-9
[5] Jain, A., Siddique, S., Gupta, T., Jain, S., Sharma, R.K., Chaudhary, S. (2020). Evaluation of concrete containing waste plastic shredded fibers: Ductility properties. Structural Concrete. https://doi.org/10.1002/suco.201900512
[6] Jain, A., Siddique, S., Gupta, T., Jain, S., Sharma, R.K., Chaudhary, S. (2019). Fresh, strength, durability and microstructural properties of shredded waste plastic concrete. Iranian Journal of Science and Technology, Transactions of Civil Engineering, 43(1): 455-465. https://doi.org/10.1007/s40996-018-0178-0
[7] Jain, A., Siddique, S., Gupta, T., Sharma, R.K., Chaudhary, S. (2018). Utilization of shredded waste plastic bags to improve impact and abrasion resistance of concrete. Environment, Development and Sustainability, 22: 337-362. https://doi.org/10.1007/s10668-018-0204-1
[8] Gupta, T., Chaudhary, S., Sharma, R.K. (2016). Mechanical and durability properties of waste rubber fiber concrete with and without silica fume. Journal of Cleaner Production, 112: 702-711. https://doi.org/10.1016/j.jclepro.2015.07.081
[9] Bisht, K., Ramana, P.V. (2017). Evaluation of mechanical and durability properties of crumb rubber concrete. Construction and Building Materials, 155: 811-817. https://doi.org/10.1016/j.conbuildmat.2017.08.131
[10] Thomas, B.S., Gupta, R.C. (2016). Properties of high strength concrete containing scrap tire rubber. Journal of Cleaner Production, 113: 86-92. https://doi.org/10.1016/j.jclepro.2015.11.019
[11] Gerges, N.N., Issa, C.A., Fawaz, S.A. (2018). Rubber concrete: Mechanical and dynamical properties. Case Studies in Construction Materials, 9: e00184. https://doi.org/10.1016/j.cscm.2018.e00184
[12] Al-Mutairi, N., Al-Rukaibi, F., Bufarsan, A. (2010). Effect of microsilica addition on compressive strength of rubberized concrete at elevated temperatures. Journal of Material Cycles and Waste Management, 12(1): 41-49. https://doi.org/10.1007/s10163-009-0243-7
[13] Oikonomou, N., Mavridou, S. (2009). Improvement of chloride ion penetration resistance in cement mortars modified with rubber from worn automobile tires. Cement and Concrete Composites, 31(6): 403-407. https://doi.org/10.1016/j.cemconcomp.2009.04.004
[14] Wang, H.Y., Chen, B.T., Wu, Y.W. (2013). A study of the fresh properties of controlled low-strength rubber lightweight aggregate concrete (CLSRLC). Construction and Building Materials, 41: 526-531. https://doi.org/10.1016/j.conbuildmat.2012.11.113
[15] Aiello, M.A., Leuzzi, F. (2010). Waste tyre rubberized concrete: Properties at fresh and hardened state. Waste Management, 30(8-9): 1696-1704. https://doi.org/10.1016/j.wasman.2010.02.005
[16] Ganjian, E., Khorami, M., Maghsoudi, A.A. (2009). Scrap-tyre-rubber replacement for aggregate and filler in concrete. Construction and Building Materials, 23(5): 1828-1836. https://doi.org/10.1016/j.conbuildmat.2008.09.020
[17] Güneyisi, E., Gesoğlu, M., Özturan, T. (2004). Properties of rubberized concretes containing silica fume. Cement and Concrete Research, 34(12): 2309-2317. https://doi.org/10.1016/j.cemconres.2004.04.005
[18] Ozbay, E., Lachemi, M., Sevim, U.K. (2011). Compressive strength, abrasion resistance and energy absorption capacity of rubberized concretes with and without slag. Materials and Structures, 44(7): 1297-1307. https://doi.org/10.1617/s11527-010-9701-x
[19] Shorbi, M.R., Karbalaie, M. (2011). An experimental study on compressive strength of concrete containing crumb rubber. International Journal of Civil & Environmental IJCEE, 11(3): 24-28.
[20] Li, G.Q., Stubblefield, M.A., Garrick, G., Eggers, J., Abadie, C., Huang, B.S. (2004). Development of waste tire modified concrete. Cement and Concrete Research, 34(12): 2283-2289. https://doi.org/10.1016/j.cemconres.2004.04.013
[21] Pacheco-Torgal, F., Ding, Y., Jalali, S. (2012). Properties and durability of concrete containing polymeric wastes (tyre rubber and polyethylene terephthalate bottles): An overview. Construction and Building Materials, 30: 714-724. https://doi.org/10.1016/j.conbuildmat.2011.11.047
[22] Xue, J., Shinozuka, M. (2013). Rubberized concrete: A green structural material with enhanced energy-dissipation capability. Construction and Building Materials, 42: 196-204. https://doi.org/10.1016/j.conbuildmat.2013.01.005
[23] Al-Akhras, N.M., Smadi, M.M. (2004). Properties of tire rubber ash mortar. Cement and Concrete Composites, 26(7): 821-826. https://doi.org/10.1016/j.cemconcomp.2004.01.004
[24] Ganesan, N., Raj, J.B., Shashikala, A. (2013). Flexural fatigue behavior of self compacting rubberized concrete. Construction and Building Materials, 44: 7-14. https://doi.org/10.1016/j.conbuildmat.2013.02.077
[25] Segre, N., Joekes, I. (2000). Use of tire rubber particles as addition to cement paste. Cement and Concrete Research, 30(9): 1421-1425. https://doi.org/10.1016/S0008-8846(00)00373-2
[26] Wu, K.R., Zhang, D., Song, J.M. (2002). Properties of polymer-modified cement mortar using pre-enveloping method. Cement and Concrete Research, 32(3): 425-429. https://doi.org/10.1016/S0008-8846(01)00697-4
[27] Yilmaz, A., Degirmenci, N. (2009). Possibility of using waste tire rubber and fly ash with Portland cement as construction materials. Waste Management, 29(5): 1541-1546. https://doi.org/10.1016/j.wasman.2008.11.002
[28] Raghavan, D., Huynh, H., Ferraris, C. (1998). Workability, mechanical properties, and chemical stability of a recycled tyre rubber-filled cementitious composite. Journal of Materials Science, 33(7): 1745-1752. https://doi.org/10.1023/A:1004372414475
[29] Sukontasukkul, P., Chaikaew, C. (2006). Properties of concrete pedestrian block mixed with crumb rubber. Construction and Building Materials, 20(7): 450-457. https://doi.org/10.1016/j.conbuildmat.2005.01.040
[30] Uygunoğlu, T., Topcu, I.B. (2010). The role of scrap rubber particles on the drying shrinkage and mechanical properties of self-consolidating mortars. Construction and Building Materials, 24(7): 1141-1150. https://doi.org/10.1016/j.conbuildmat.2009.12.027
[31] Yung, W.H., Yung, L.C., Hua, L.H. (2013). A study of the durability properties of waste tire rubber applied to self-compacting concrete. Construction and Building Materials, 41: 665-672. https://doi.org/10.1016/j.conbuildmat.2012.11.019
[32] Bentur, A., Goldman, A. (1989). Curing effects, strength and physical properties of high strength silica fume concretes. Journal of Materials in Civil Engineering, 1(1): 46-58. https://doi/abs/10.1061/(ASCE)0899-1561(1989)1:1(46)
[33] Gupta, T., Chaudhary, S., Sharma, R.K. (2014). Assessment of mechanical and durability properties of concrete containing waste rubber tire as fine aggregate. Construction and Building Materials, 73: 562-574. https://doi.org/10.1016/j.conbuildmat.2014.09.102
[34] Sridhar, R., Prasad, D.R. (2019). Damage assessment of functionally graded reinforced concrete beams using hybrid fiber engineered cementitious composites. Structures, 20: 832-847. https://doi.org/10.1016/j.istruc.2019.07.002
[35] Liu, X., Yan, M.P., Galobardes, I., Sikora, K. (2018). Assessing the potential of functionally graded concrete using fibre reinforced and recycled aggregate concrete. Construction and Building Materials, 171: 793-801. https://doi.org/10.1016/j.conbuildmat.2018.03.202
[36] Bajaj, K., Shrivastava, Y., Dhoke, P. (2014). Experimental Study of Functionally Graded Beam with Fly Ash. Journal of the Institution of Engineers (India): Series A, 94(4): 219-227. https://doi.org/10.1007/s40030-014-0057-z
[37] Shen, B., Hubler, M., Paulino, G.H., Struble, L.J. (2008). Functionally-graded fiber-reinforced cement composite: Processing, microstructure, and properties. Cement and Concrete Composites, 30(8): 663-673. https://doi.org/10.1016/j.cemconcomp.2008.02.002
[38] Mastali, M., Naghibdehi, M., Naghipour, M., Rabiee, S.M. (2015). Experimental assessment of functionally graded reinforced concrete (FGRC) slabs under drop weight and projectile impacts. Construction and Building Materials, 95: 296-311. https://doi.org/10.1016/j.conbuildmat.2015.07.153
[39] Bureau of Indian Standards (BIS). Coarse and Fine Aggregates from Natural Sources for Concrete. New Delhi, India; 1970.
[40] Choudhary, S., Chaudhary, S., Jain, A., Gupta, R. (2020). Assessment of effect of rubber tyre fiber on functionally graded concrete. Materials Today: Proceedings, 28(3): 1496-1502. https://doi.org/10.1016/j.matpr.2020.04.830
[41] Choudhary, S., Chaudhary, S., Jain, A., Gupta, R. (2020). Valorization of waste rubber tyre fiber in functionally graded concrete. Materials Today: Proceedings, 32(4): 645-650. https://doi.org/10.1016/j.matpr.2020.03.122
[42] Wen, X.D., Tu, J.L., Gan, W.Z. (2013). Durability protection of the functionally graded structure concrete in the splash zone. Construction and Building Materials, 41: 246-251. https://doi.org/10.1016/j.conbuildmat.2012.11.119
[43] Bureau of Indian Standards (BIS). Methods of Sampling and Analysis of Concrete. IS: 1199:1959, New Delhi, India; 1959.
[44] Bureau of Indian Standards (BIS). Methods of Tests for Strength of Concrete. IS: 516:1959, New Delhi, India; 1959.
[45] DIN 1048, German Standard for Determation of Permeability of Concrete.
[46] ASTM C157, Standard Test Method for Length Change of Hardened Hydraulic-Cement Mortar and Concrete.
[47] Maalej, M., Ahmed, S.F., Paramasivam, P. (2003). Corrosion durability and structural response of functionally-graded concrete beams. Journal of Advanced Concrete Technology, 1(3): 307-316. https://doi.org/10.3151/jact.1.307
[48] Alsaif, A., Bernal, S.A., Guadagnini, M., Pilakoutas, K. (2018). Durability of steel fibre reinforced rubberised concrete exposed to chlorides. Construction and Building Materials, 188: 130-142. https://doi.org/10.1016/j.conbuildmat.2018.08.122
[49] Luhar, S., Chaudhary, S., Luhar, I. (2019). Development of rubberized geopolymer concrete: Strength and durability studies. Construction and Building Materials, 204: 740-753. https://doi.org/10.1016/j.conbuildmat.2019.01.185
[50] Sofi, A. (2018). Effect of waste tyre rubber on mechanical and durability properties of concrete – A review. Ain Shams Engineering Journal, 9(4): 2691-2700. https://doi.org/10.1016/j.asej.2017.08.007
[51] Reda Taha, M.M., El-Dieb, El-Wahab, M.A.A., Abdel-Hameed, M.E. (2020). Mechanical, fracture, and microstructural investigations of rubber concrete. Journal of Materials in Civil Engineering, 20(10): 640-649. https://doi.org/10.1061/(ASCE)0899-1561(2008)20:10(640)
[52] Siddika, A., Al Mamun, M.A., Alyousef, R., Mugahed Amran, Y.H., Aslani, F., Alabduljabbar, H. (2019). Properties and utilizations of waste tire rubber in concrete: A review. Construction and Building Materials, 224: 711-731. https://doi.org/10.1016/j.conbuildmat.2019.07.108
[53] Ma, B., Gao, Y. (2006). Finite element analysis for shrinkage in the interface of functionally graded concrete segment used shield tunnelling. Materials Science Edition, 98-102.
[54] Paiva, H., Silva, A.S., Velosa, A., Cachim, P., Ferreira, V.M. (2017). Microstructure and hardened state properties on pozzolan-containing concrete. Construction and Building Materials, 140: 374-384. https://doi.org/10.1016/j.conbuildmat.2017.02.120