Zhishuo Jin*![]() | Yubing Qian
| Yubing Qian![]()
© 2024 The authors. This article is published by IIETA and is licensed under the CC BY 4.0 license (http://creativecommons.org/licenses/by/4.0/).
OPEN ACCESS
This study investigates the growth and development of new energy vehicles by applying two mathematical models: Winters' multiplication model and multivariate linear regression model. This study focuses on analyzing the sales data of new energy vehicles over a period of time and examining various factors that affect their development, such as government policies, fuel prices, and GDP. For Model 1, Winters' multiplication model is used to capture linear trends in sales data. Model 2 involves constructing a multivariate linear regression model to understand the relationship between new energy vehicle sales and identified influencing factors. By using these models, this study aims to gain a deeper understanding of the growth trajectory of new energy vehicles and predict future trends in the industry.
energy vehicles, winters' multiplicative model, Multivariable Linear Regression Model, time series analysis, development factors
In recent years, the global automotive industry has experienced a profound transformation, with a notable surge in the adoption of new energy vehicles (NEVs) leading the charge towards sustainable transportation solutions. This paper delves into the dynamic landscape of China's new energy vehicle sector, examining its rapid evolution and unprecedented growth trajectory. By actively supporting the integration of advanced vehicle power control and drive technologies, China has not only propelled itself towards becoming a dominant force in the automotive industry but has also made significant strides in addressing pressing environmental challenges. Through the creative fusion of new energy vehicle development with initiatives aimed at enhancing industrial competitiveness, ensuring energy security, and combating climate change, China has firmly established itself as a global leader in sustainable transportation. With China now boasting the world's largest electric vehicle market, this paper explores the multifaceted impacts of this rapid development, including its implications for energy transformation, technological innovation, and global sustainability efforts.
New energy vehicles (NEVs), as an environmentally friendly and energy-saving means of transportation, have received increasing attention and promotion worldwide in recent years. Governments and car manufacturers around the world have invested resources to promote the development and popularization of NEVs. In order to gain a deeper understanding of the growth trends and influencing factors in the NEV market, many studies have adopted different methods and models for analysis. In previous studies, many scholars have used time series models to predict NEV sales volume. Among them, Zhang et al. [1] used univariate and multivariate time series models to explore the prediction of NEV sales volume in China. They found that time series analysis can more accurately predict the future trend of NEV sales volume. In addition, some studies have also used multiple linear regression models to study the growth factors of the NEV market. Yuan [2] proposed a method for predicting NEV sales volume using multiple linear regression and time series models at the international conference. They found that considering the influence of multiple factors, this model can more comprehensively explain the changes in the NEV market. Meanwhile, the development of the NEV market is also influenced by macroeconomic factors and policies. In addition, Sierzchula et al. [3] investigated the impact of fiscal incentives and other socio-economic factors on the adoption rate of NEVs, and found that policy measures are crucial for the development of the NEV market. Sotnyk et al. [4] studied the development of the electric vehicle market in the United States and found that macroeconomic indicators have a significant impact on the growth of the NEV market. In addition to the application of mathematical models, some studies have also conducted in-depth analysis of the current situation and future trends of the NEV industry. Liu [5] studied the development strategy of the NEV industry and pointed out the focus and challenges for future development. Su and Tang [6, 7] respectively conducted research on the development trends of NEV, providing useful references for industry development. Based on the above research, we can see that the growth and development of the NEV market are influenced by various factors, including macroeconomic environment, policy support, technological progress, etc. In order to better understand and predict the future development of the NEV market, this study will apply Winters' multiplication model and multivariate linear regression model to analyze the growth trend of NEV from different perspectives, and provide decision support and reference for relevant stakeholders.
The global automotive industry is witnessing a profound shift towards sustainability, with new energy vehicles (NEVs) emerging as a prominent solution to mitigate environmental concerns [8, 9]. China, as a leading player in this transition, has been experiencing notable advancements in NEVs. The country has implemented supportive policies, including subsidies and incentives, to accelerate the adoption of electric vehicles (EVs) and other NEVs. As a result, China's NEV market has seen rapid growth in recent years, with a diverse range of electric and hybrid vehicles hitting the roads. However, challenges such as infrastructure development and battery technology remain significant hurdles to overcome. Despite these challenges, the outlook for NEVs in China remains optimistic, with continued government support and technological innovation driving further advancements in the sector.
3.1 Identifying development factors
In the context of the rapid development of today’s new energy vehicles, in order to in-depth analysis of its development trend, we must find and confirm the main factors affecting the development of China’s new energy electric vehicles. Appropriate mathematical models can then be constructed to accurately describe the impact of these factors on the development of new energy electric vehicles in China.
3.2 Using data for predictive modeling
In order to more accurately understand the trajectory of new energy electric vehicles, it is necessary to collect contemporary and historical data on the development of China’s new energy electric vehicle industry. Subsequently, the construction of relevant mathematical models became necessary to help more detailed description and prediction of the development of new energy-saving electric vehicles in China in the next decade.
3.3 Analyzing the competitive landscape
New energy vehicles and traditional energy vehicle industries compete with each other in the shared car market. The rapid development of new energy electric vehicles has not only squeezed the market share of the traditional energy vehicle industry, but also brought competitive pressure, and promoted technological innovation and industrial progress within the traditional industry. Therefore, it is imperative to collect relevant data, establish appropriate mathematical models, more specifically analyze the impact of new energy electric vehicles on the global traditional energy vehicle industry, and more deeply understand the development trend of the automotive industry.
3.4 Evaluating policies that affect industries
In recent years, the robust advancement of China’s new energy vehicle sector has garnered noteworthy momentum, prompting certain foreign nations to formulate targeted policies aimed at impeding its progression. To comprehensively assess the consequential effects of these policies on the trajectory of new energy vehicle development in China, an in-depth exploration of the regulatory frameworks implemented by these nations is requisite. This entails a meticulous analysis of key policy determinants, encompassing both qualitative and quantitative dimensions, and necessitates the construction of a judicious mathematical model. Subsequent to the identification and extraction of pertinent data embedded within these policies, the resultant model shall facilitate a rigorous examination of the nuanced impacts exerted by these regulatory measures on the developmental trajectory of China’s new energy vehicle industry.
3.5 Assessing ecological impact in urban environment
In urban settings characterized by pronounced ecological repercussions and heightened vehicular activity, the adoption of electrification has emerged as a pivotal trajectory within the ambit of new energy electric vehicles, notably electric buses. Given that electrification engenders a discernible reduction in carbon emissions, a meticulous examination of the ecological ramifications associated with the integration of new energy electric vehicles becomes imperative. To expound upon the externalities of new energy vehicle proliferation with greater precision, it is imperative to formulate a congruent data model. The model should be based on a population of one million cities for prediction, thereby facilitating nuanced calculations and yielding specific outcomes delineating the impact of new energy electric vehicles on the ecological milieu within the context of a city of such scale.
4.1 The correlation between influencing factors and new energy vehicles
Through data collection and analysis, it can be found that the main factors related to the development of new energy electric vehicles in China are as follows: policy support, technical support, GDP, construction of basic charging facilities, public environmental awareness, oil price and other external factors. Therefore, conditional quantification is carried out on the above influencing factors, and the correlation between sub-quantification data and new energy vehicles is analyzed and evaluated, and then the relevant mathematical model is established. Below is the graph obtained by analyzing and calculating the relevant data [10, 11].
4.2 Introduced the winter multiplication model to predict industry development
To describe and predict the future development trend of a specific industry, it is necessary to adopt the method of historical review, collect and sort out the data generated in the past through the systematic summary of past events, and then establish the corresponding mathematical model. This is the core objective that question Two aims to address.
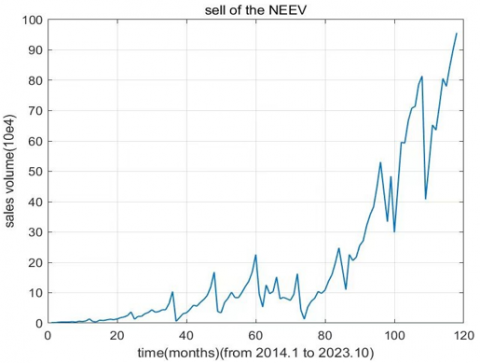
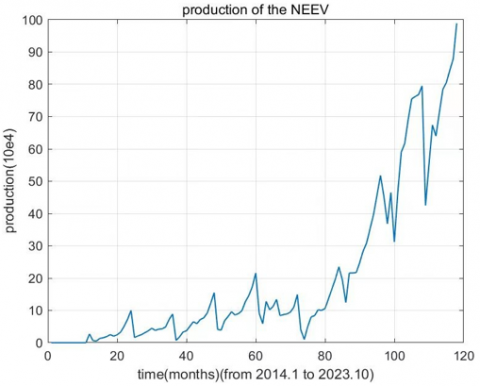
Given that the production and sales of new energy vehicles show a seasonal trend and generally increase with time, we choose to use the time series method to forecast. The first step involves making basic time series predictions using statistical software SPSS. Using SPSS, we first drew the relationship between the sales volume of new energy vehicles and the time, as shown in Figures 1 and 2.
Figure 1. Sales of NEVS from 2014.1 to 2023.10
Figure 2. Production of NEVs from 2014.1 to 2023.10
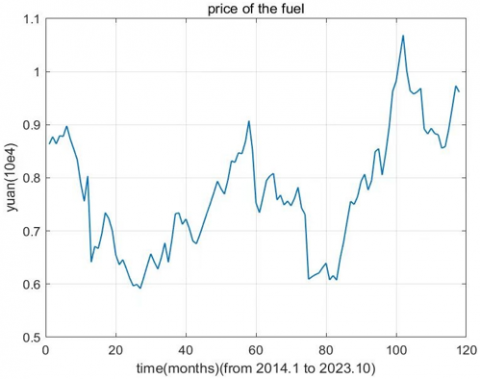
And then we draw the graph of relationship between the fuel price and the time(month), as shown in Figure 3.
Figure 3. Price of the fuel from 2014.1 to 2023.10
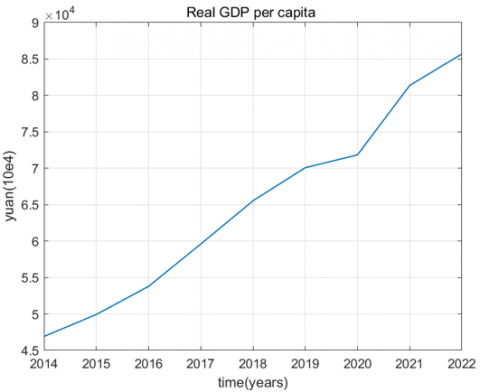
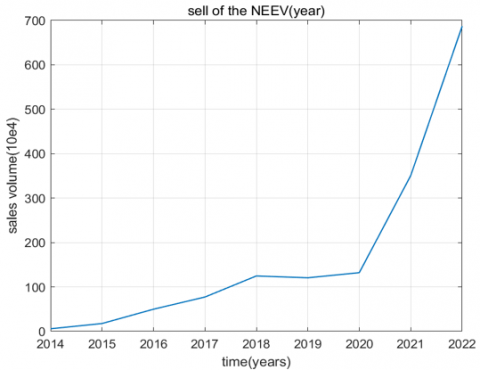
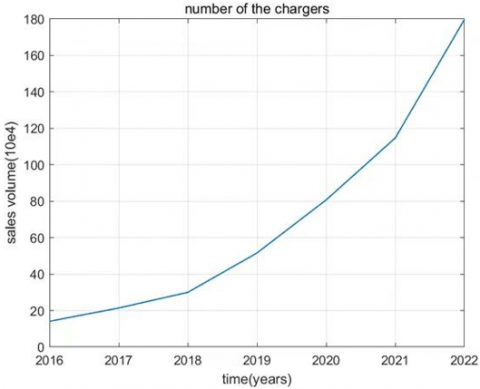
After that, to make the prediction more precise, we draw the graph of the relationship between Chinese GDP, sale of new energy car, number of public new energy chargers and time(year), as shown in the Figures 4-6.
Figure 4. Price of the fuel from 2014.1 to 2023.10
Figure 5. Sales of NEVS from 2016 to 2022
Figure 6. Number of chargers from 2016 to 2022
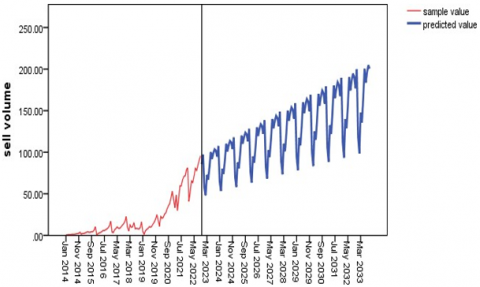
Based on the obtained graphs and the data processed by SPSS, we recognized the need to model traditional time series. Therefore, in this context, we introduce the Winter multiplication model in the non-ARIMA model and obtain the following prediction results [12-14], as Figure 7 shown.
Figure 7. Sales forecast results of NEVs from 2023 to 2022
Based on the above graph and data results, it is observed that the significance of the Q test of SPSS statistics in this scenario is greater than 0, and the stationary R square is greater than 0.08, which indicates that the model built has certain reference value [15, 16].
According to the confidence interval provided by SPSS for the monthly sales number of new energy vehicles, we further calculated the number of new energy vehicles that may be produced annually, as shown in the Table 1:
Table 1. The number of NEVs that may be produced from 2024 to 2033
|
Year |
Max Sell (1*104 cars) |
Min Sell (1*104 cars) |
|
2024 |
1410.85 |
844.77 |
|
2025 |
1575.01 |
884.52 |
|
2026 |
1729.50 |
933.80 |
|
2027 |
1877.83 |
989.35 |
|
2028 |
2021.79 |
1049.29 |
|
2029 |
2162.36 |
1112.54 |
|
2030 |
2300.28 |
1178.45 |
|
2031 |
2436.04 |
1246.54 |
|
2032 |
2570.01 |
1316.44 |
|
2033 |
2702.38 |
1387.89 |
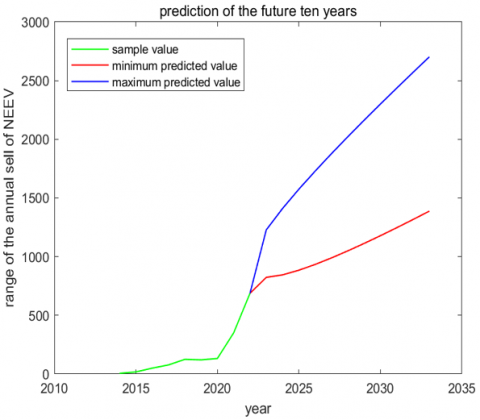
Converting the table to a picture can be done as Figure 8 shown.
Figure 8. Prediction results of new energy vehicle production from 2024 to 2033
4.3 Analyzing comparative trends: New energy vs. traditional vehicles in China
To gain an in-depth understanding of the competitive advantages of the industry, it is necessary to conduct data collection and comparative analysis with competitive industries to identify the strengths and weaknesses of both sides and optimize the industry. Therefore, it is both necessary and effective to collect relevant data on new energy vehicles and traditional energy vehicles. Through this process, a mathematical model can be established to gain a comprehensive insight into the overall impact of the development of the new energy automobile industry.
Given the limited data collection and the fact that many countries do not publish relevant auto industry sales data, and considering that China has the second highest GDP per capita in the world, the changing trend of its auto industry is representative on a global scale. Therefore, we choose to use the development data of traditional energy vehicles and electric vehicles in China for comparative analysis, in order to fully understand the changing trend of these two in the global scope [17].
According to the collected sales data of new energy vehicles and traditional energy vehicles, we carried out detailed analysis and calculation respectively, and obtained the Figure 9.
Figure 9. The change of sales of these two types of vehicles over time
In order to exclude the seasonal impact of timing factors on the data, we assume that the overall vehicle demand has a small impact on people’s choice of new energy vehicles and traditional energy vehicles. Therefore, the popularity of new energy vehicles can be measured by the ratio of the frequency of people choosing new energy vehicles to the overall car purchase demand.
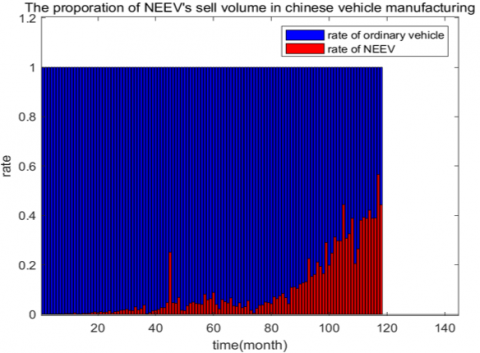
We made a bar chart to describe the proportional relationship between the frequency of people buying new energy vehicles in the automobile market and the total automobile sales, aiming to reveal the proportion of new energy vehicles in the overall automobile sales. As shown in the following picture.
According to the above discussion and the analysis in Figure 10, except for exceptions at some special time points (such as the novel coronavirus epidemic), the position and popularity of new energy vehicles in the automotive market show a rising trend. In addition, it can be observed from Figure 10 that the overall demand for vehicles changes little, which further indicates that the rise of new energy vehicles has led to a certain downward trend in the sales of traditional energy vehicles.
Figure 10. The proportion of NEVS in the overall car sales
4.4 Analyzing the impact of foreign policies on China's NEVs exports
The analysis of polices’ impact necessitates the examination of the repercussions stemming from policies implemented by certain nations aimed at impeding the progress of China’s new energy electric vehicles. Through meticulous data gathering and analysis, it becomes evident that foreign policies governing the export of China’s new energy electric vehicles are poised to encumber their advancement in the global market [18]. This impediment is anticipated to exert a detrimental influence on the sales performance of China’s new energy electric vehicles. Consequently, a thorough aggregation of pertinent information and data is undertaken to quantitatively assess the impact of the aforementioned policies on new energy electric vehicles. Subsequently, a relational chart delineating the correlation between the export quantity and temporal dynamics of new energy electric vehicles is devised based on the collated data and information [19]. As shown in Figure 11.
Figure 11. The relationship between the export quantity and time of new energy electric vehicles
Nevertheless, the endogenous determinant of China’s new energy electric vehicle exports primarily originates from the aggregate sales volume of these vehicles. Consequently, a discernible positive correlation may exist between the export volume of new energy electric vehicles and the overall sales volume within China. This suggests that the export volume of new energy electric vehicles could exhibit an increase concomitant with the rise in the total sales volume of such vehicles. However, operating under the assumption that the total export volume of new energy electric vehicles maintains a relatively fixed proportion relative to the total sales volume, the augmentation in the sales volume of new energy electric vehicles does not inherently propagate a commensurate elevation in the export volume. Consequently, to meticulously discern the impact of ex- ternal policies on China’s export of new energy electric vehicles, it becomes imperative to scrutinize the ratio of the export volume of new energy vehicles to its total sales. This analytical approach allows for a more precise examination of the impediments faced by China’s export of new energy electric vehicles.
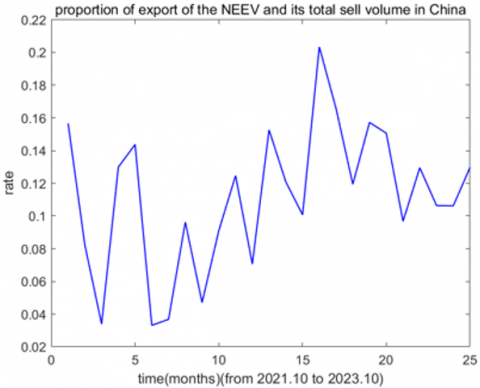
The following figure shows the relationship between the proportion of the export volume of new energy electric vehicles in its total sales volume and time.
Figure 12. The relationship between the proportion of new energy electric vehicle exports to total sales and time
In accordance with pertinent policy data, recent years have witnessed notable foreign policies imposing restrictions on the export of China’s new energy electric vehicles. Notably impactful among these policies is the “Inflation Reduction Act of 2022,” promulgated by the United States in August 2022, followed by a subsequent iteration in October 2023. Additionally, the European Union has introduced anti-subsidy policies pertaining to the export of China’s new energy electric passenger vehicles.
In conjunction with the aforementioned line chart data, a discerning analysis reveals that the “Inflation Reduction Act of 2022,” enacted by the United States in August 2022, instigated a decline in the total sales of new energy electric vehicles in China at time=11. The policies introduced by the European Union exhibit no conspicuous impact on the variables illustrated in the aforementioned figure. Nevertheless, given the overall ascending trend in the data, it is apparent that despite encountering certain impediments to the export of China’s new energy electric vehicles, the industry retains robust allure and competitiveness in the global arena, as evidenced by sustained foreign consumer interest.
4.5 Quantifying the ecological impact of NEVSs
To evaluate effect of NEVSs on environment, it necessitates the quantification of the ecological impact of new energy electric vehicles within the context of a model comprising 1 million urban populations. Through comprehensive problem analysis and data acquisition, discernible categorizations of automobiles are observed, stratifying them into two primary classes: traditional fuel vehicles encompassing gasoline and diesel variants, and three classifications of new energy electric vehicles comprising hybrid plug-in electric vehicles, fuel cell electric vehicles, and pure electric vehicles. The ecological ramifications primarily emanate from the carbon dioxide (CO2) emissions attributed to these distinct vehicle types. As such, the endeavor involves the collation and analysis of average CO2 emissions per kilometer for different vehicle classifications [20].
Utilizing the data from the year 2021 as an illustrative example, the relative proportions of traditional fuel vehicles and new energy electric vehicles are determined by ascertaining the minimum and maximum values of the proportion of new energy vehicles in overall automobile sales spanning 2020 to 2022. The subsequent calculation involves averaging the three-year maximum and minimum values, thereby approximating the proportion of new energy electric vehicles in the entirety of automotive models for the year 2021. This enables the determination of the proportion of traditional fuel vehicles within the overall model spectrum.
Further delineation involves the relative distribution of gasoline and diesel vehicles among conventional fuel vehicles. The relative proportions of national sales for gasoline and diesel internal combustion engine vehicles in 2021 are calculated. Additionally, the relative proportions of the three delineated new energy vehicle types in China for the same year are obtained, with fuel cell vehicles being disregarded due to their minimal prevalence. Simultaneously, data pertaining to the CO2 emissions per kilometer for each vehicle category is collected.
The subsequent application of the formulated equations facilitates the calculation of the average CO2 emissions per kilometer for all vehicle types and solely for conventional fuel vehicles. This entails a weighted aggregation of emissions considering the relative proportions of each vehicle type and their respective emissions per kilometer. The following are the pertinent formulas utilized.
Average CO2 emissions per kilometer for all vehicle types: Average CO2 emissions per kilometer = ratio of petrol vehicles * (ratio of petrol vehicles * Ratio of petrol vehicles per kilometer + ratio of diesel vehicles * Ratio of diesel vehicles per kilometer) + ratio of trams * (plug-in ratio * Plug-in emissions + pure electric ratio * pure electric emissions).
Average CO2 emissions per kilometer with only conventional fuel vehicles: Average CO2 emissions per kilometer = proportion of petrol cars * Emissions per kilometer of petrol cars + proportion of diesel cars * Emissions per kilometer of diesel cars.
Substitute the relevant data into the aforementioned formulas and perform the corresponding calculations. The derived results indicate that, under the distribution of new energy vehicles in 2021, the average CO2 emissions per kilometer for all vehicle types are notably lower than those observed exclusively for conventional fuel vehicles [7.9109gCO2e/km, 24.0389gCO2e/km].
A pivotal factor in ascertaining the ecological impact involves discerning the aver- age annual distance covered by each vehicle. Through data exploration, the average annual distance traveled by each vehicle in 2021-2022 is established as 9,970 km. Integration of this data into the calculated average CO2 emissions per kilometer enables the determination that, if exclusively conventional fuel vehicles were operational in 2021, the ensuing CO2 emissions would exhibit an increment within the range of [1.2619*1.0e+10gCO2e, 3.8347*1.0e+10gCO2e] in comparison to a scenario encompassing the operation of all vehicle types.
This comprehensive analysis substantiates the affirmative ecological impact of new energy electric vehicles, demonstrating a discernible reduction in CO2 emissions when juxtaposed against an exclusive reliance on conventional fuel vehicles.
The paper highlights the multifaceted factors influencing the development of new energy electric vehicles (in China, including policy and technical support, economic indicators like GDP, infrastructure for charging, public awareness of environmental issues, and external factors such as oil prices. Despite challenges, the overall trajectory for NEVs in China over the next decade is positive, with their growth impacting traditional vehicle sales. While some nations have implemented policies to hinder China's NEEV exports, they maintain competitiveness globally. Additionally, NEVs have a significant positive impact on the environment, with deployments in 2021 estimated to mitigate CO2 emissions in urban areas. Overall, NEVs offer advantages in energy efficiency and environmental sustainability, contributing to ecological preservation, economic development, and employment globally.
[1] Zhang, Y., Zhong, M., Geng, N., Jiang, Y. (2017). Forecasting electric vehicles sales with univariate and multivariate time series models: The case of China. PloS One, 12(5): e0176729. https://doi.org/10.1371/journal.pone.0176729
[2] Yuan, Y. (2023). Application of multiple linear regression and time-series models for forecasting sales of new energy vehicles. In FFIT 2022: Proceedings of the International Conference on Financial Innovation, FinTech and Information Technology, FFIT 2022, October 28-30, 2022, Shenzhen, China. p. 452. European Alliance for Innovation.
[3] Sierzchula, W., Bakker, S., Maat, K., Van Wee, B. (2014). The influence of financial incentives and other socio-economic factors on electric vehicle adoption. Energy Policy, 68: 183-194. https://doi.org/10.1016/j.enpol.2014.01.043
[4] Sotnyk, I., Hulak, D., Yakushev, O., Yakusheva, O., Prokopenko, O.V., Yevdokymov, A. (2020). Development of the US electric car market: Macroeconomic determinants and forecasts. Polityka Energetyczna, 23(3): 147-164. https://doi.org/10.33223/epj/127921
[5] Liu, K.D. (2023). Current status and strategies of new energy vehicle industry development. Industrial Innovation Research, (21): 42-44.
[6] Su, B.H. (2019). Research on the development trend of new energy vehicles. Era of Automobiles, (16): 88-89.
[7] Tang, Z. (2021). Trends in automotive new energy and new energy vehicle development. Era of Automobiles, (24): 119-120.
[8] Cano, Z.P., Banham, D., Ye, S., Hintennach, A., Lu, J., Fowler, M., Chen, Z. (2018). Batteries and fuel cells for emerging electric vehicle markets. Nature Energy, 3(4): 279-289. https://doi.org/10.1038/s41560-018-0108-1
[9] Richardson, D.B. (2013). Electric vehicles and the electric grid: A review of modeling approaches, impacts, and renewable energy integration. Renewable and Sustainable Energy Reviews, 19: 247-254. https://doi.org/10.1016/j.rser.2012.11.042
[10] Wang, Z. (2023). Promotion and application of new energy vehicles. In Annual Report on the Big Data of New Energy Vehicle in China (2022), pp. 23-47. https://doi.org/10.1007/978-981-99-6411-6_2
[11] Wang, Z. (2024). Charging of new energy vehicles. In: Annual Report on the Big Data of New Energy Vehicle in China (2022), pp. 149-222. https://doi.org/10.1007/978-981-99-6411-6_5
[12] Demir, U., Ergen, S.C. (2016). ARIMA-based time variation model for beneath the chassis UWB channel. EURASIP Journal on Wireless Communications and Networking, pp. 1-11. https://doi.org/10.1186/s13638-016-0676-3
[13] Lynwood, A., Johnson Douglas, C., Montgomery, John, S.G. (1990). Forecasting and Time Series Analysis.
[14] Riaz, M., Hussain Sial, M., Sharif, S., Mehmood, Q. (2023). Epidemiological forecasting models using ARIMA, SARIMA, and Holt–Winter multiplicative approach for Pakistan. Journal of Environmental and Public Health. https://doi.org/10.1155/2023/8907610
[15] Kalekar, P.S. (2004). Time series forecasting using holt-winters exponential smoothing. Kanwal Rekhi school of information Technology, 4329008(13): 1-13.
[16] Shao, Q., Aldhafeeri, A., Qiu, S., Khuder, S. (2023). A multiplicative Holt–Winters model and autoregressive moving-average for hyponatremia mortality rates. Healthcare Analytics, 4: 100262. https://doi.org/10.1016/j.health.2023.100262
[17] Jinwen, Z., Yumei, Q. (2023). Research on motor control of new energy electric vehicle. In 2023 IEEE 3rd International Conference on Electronic Technology, Communication and Information (ICETCI), pp. 637-640. Changchun, China. https://doi.org/10.1109/ICETCI57876.2023.10176454
[18] Hidrue, M.K., Parsons, G.R., Kempton, W., Gardner, M.P. (2011). Willingness to pay for electric vehicles and their attributes. Resource and energy economics, 33(3): 686-705. https://doi.org/10.1016/j.reseneeco.2011.02.002
[19] Alhazmi, Y.A., Salama, M.M. (2017). Economical staging plan for implementing electric vehicle charging stations. Sustainable Energy, Grids and Networks, 10: 12-25. https://doi.org/10.1016/j.segan.2017.02.001
[20] Cheng, Q., Xiong, Y. (2024). Low-carbon sustainable development driven by new energy vehicle pilot projects in China: Effects, mechanisms, and spatial spillovers. Sustainable Development, 32(1): 979-1000. https://doi.org/10.1002/sd.2715