Pavel A. Alvarez | Eva Miranda | Manuel Muñoz-Palma* | Ernesto León-Castro | Pavel López-Parra | Emilio Garcia-Lopez
OPEN ACCESS
This article presents an analysis of the marginalization of the federative entities of Mexico. The study is part of a larger project whose objective is to identify the fundamental economic sectors of Mexico. The sociodemographic comparison of the States of Mexico is formulated as a ranking problem, regarding their marginality level. The research framework is based on the multiple criteria decision-making applying a hierarchical process to analyze the marginality with various dimensions. The data used to evaluate the marginality in Mexico are indicators constructed by the Population and Housing Census information in 2020.
marginality, regional development, public policies, multi-criteria decision-making, multiple criteria hierarchy process, ELECTRE-III
In Mexico, the census periodicity has allowed it to have basic statistical information regularly, which has facilitated knowledge about the evolution of the living conditions of the country’s population. A survey is performed through an introductory questionnaire to conform indicators, municipalities, and states. The information generated by the study can be helpful to develop social research with practical indicators to identify opportunities for government and private intervention. Therefore, this can be a determining tool in a public policy decision-making process, showing the links between socioeconomic information and government tasks [1].
The sociodemographic development of a region involves a multidimensional process, so it is advisable to analyze it from multiple approaches. When understanding the evolution of aspects that escape the information contained in a single value separately, some index is required that condenses its varied domain. It is needed to construct indicators that contemplate its global concept and the different subdimensions. Other population elements can be analyzed here as education and housing, and distribution.
The objective of an indicator is to measure a certain reality or perception. Usually, a composite indicator is a combination of several individual indicators that capture a particular aspect of a reality that we want to evaluate. When constructing an indicator, the decision problem, the decision-maker, and the preferences are often not well defined. Most of the decision-making aid processes and most of the indicator construction processes cannot avoid incorporating some arbitrary elements.
Due to the characteristics of the problem and the number of attributes considered, it seems necessary to analyze the problem from a multidimensional approach. In this sense, it is appropriate to implement a multicriteria methodology. In this case, the MultiCriteria Decision Aid (MCDA) provides several methods for analyzing marginality as a multicriteria problem. The multicriteria approach helps analysts or managers to evaluate many actions accurately considering various criteria. In some cases, it is challenging due to the limitation of the human capacity to handle the complete information.
In MCDA methods, some approaches based on multi-attribute utility, reference level, or outranking are presented. A well-known ELECTRE-III method is an outranking approach in the MCDA methodology. It is suitable for these types of problems. It presents a helpful adaptation for different values in the attribute and the flexibility to adapt the decision maker’s preference.
The present study analyzes the marginality in regions of Mexico with a hierarchical version of ELECTRE III method as part of the MCDA methodology. This method supports the analysis of sociodemographic characteristics of regions of Mexico in various dimensions. It allows the study of marginalization of the population as a human condition. The objective is to map the regions presenting a high level of marginality in Mexico based on education, housing, population dispersion, and economic dimensions. Finally, the article presents a ranking of the Federal Entities showing the level of marginalization based on the sociodemographic indicators and compares some differences with the result of the marginality from National Population Council of Mexico (CONAPO from its acronym in Spanish) [2]. In the rest of the document the terms federal entities and regions shall be used indistinctly.
The paper is structured as follow. Section 2 presents the literature review regarding studies of social analysis. The methodology and the multiple criteria hierarchy process is described in Section 3. Section 4 describes the data of sociodemographic information about the population of Mexico. The analysis of results and discussion is presented in Section 5. Finally, conclusions are presented in Section 6.
2.1 Social analysis from the decision-making perspective
Developing countries require a continuous process of measuring the current situation of the population. Implementing innovation and sustainability are essential strategies to consider in the developing country process. Innovation is a strategy that has been tried to apply in developing countries to stimulate development and improve the quality of life of the poor [3]. However, lack of adequate services and poverty persist throughout the world, not just in developing countries or regions limited in services and income. The study of Musa et al. [4] is studied the measurement of community well-being to justify the inclusion of different sustainability metrics to optimize results for national happiness and urban sustainability. It is stated that this type of process is a very complex process to implement more in marginal areas, where socioeconomic weaknesses are critical obstacles for the sustainable development of these territories.
The study of marginality can help understand the systemic factors that contribute to poverty and exclusion that can overlap with the lack of resources and opportunities necessary to achieve the desired living conditions [5]. Marginality is a social phenomenon, but the term marginal also has an important use in economics. Economic factors are also essential in the process of marginalization of specific individuals and social groups, in addition to the marginalization of areas or regions as spatial units [6].
Marginality can be expressed as people with limited access to resources and opportunities, capacity building, and personal choices [5]. It seems that the population in marginalized conditions could present indicators of poverty, as study [7] stated that in many cases, marginality is a fundamental cause of poverty. In study [8] is mentioned that marginalization is an involuntary position and condition of an individual or group outside the social, political, economic, ecological, and physical system that prevents them from accessing resources, goods, and services. It limits their freedom of selection, reduces their capabilities, and eventually causes extreme poverty. In addition to being inclusive and interdisciplinary, the concept of marginality offers an integrated and systematic basis for understanding the interactions between social and ecological systems [5].
Marginality is present in urban and rural areas. It is studied [9] the marginalization in urban areas of Mexico. In Mexico, the condition of marginalization expands throughout the territory. Marginalized people are disabled for traditional access and use rights to essential resources. Collier [10] asserts that the poorest 1 billion have been displaced and no longer live in the poorest and often fragile states. Marginality can be studied from spatial dimensions such as geography and location. Ferretti and Gandino [11] point out the presence of marginalized communities at risk due to the strong tendency to abandon rural areas by large cities. Violence during pregnancy is a frequent fact in highly marginalized contexts, in addition to its expression tending to be more severe [12]. Spatial clusters with high infant mortality rates are found in socially marginalized areas of Mexico [13].
The state of marginalization in the federal entities of Mexico is a relevant social study. Even though well-defined indices for its analysis are needed to carry out research, a multicriteria approach is compared with the study of CONAPO [2]. Analysis of the level of marginalization in Mexico. By comparing the states, we want to know the most marginalized states in Mexico.
Decision-making is a commonplace process in organizations that generally includes a group of people with a particular hierarchical level for this activity. We know that understanding, analyzing, and supporting the decision-making process is complex due to the inadequate structuring of the problem, the dynamic environment in which the decision-making process takes place, and multiple decision-makers presence each one of them with their point of view on how the problem should be handled and the decision that should be taken [14].
Multi-criteria analysis for decision making is an advanced field of operations research; the characteristic that best distinguishes it is its orientation as a support for decision making. In this sense, the support approach for decision-making is at a higher stage than the classical optimization paradigm of Operations Research [15].
Outranking methods are widely used and studied in the scientific community. Among them is the ELECTRE method, since the different versions address decision-making problems like classification and ordering. The ELECTRE method requires preferential information from the decision-maker, input data, and a preference exploitation technique to generate the proposed solution.
In Mexico, for more than two decades have been designed and implemented measurements to understand inequalities, trying to summarize the multidimensionality of the problem (education, housing, income, health, and spatial location), thus making our country a pioneer in the Latin American region [16].
Marginalization has been studied from various approaches; some of them can be observed in the marginalization index, the multidimensional measurement of poverty (CONVEVAL, from its acronym in Spanish), and the Human Development Index (United Nations Development Program, UNDP) [16]. The first emphasizes the territorial scope and the housing status of the population in marginalized entities. The second considers poverty and unsatisfied needs to define the condition of poverty. The third addresses the issue of inequality from the perspective of territorial units. The results obtained from these measurement approaches are of utmost importance as they show a panorama of inequalities in the level of marginalization of federal entities.
Adverse sociodemographic conditions currently prevail in many of the country’s regions, which represents a significant challenge for the three levels of government in Mexico, particularly for the Federal government; that must act in localities subject to policies of multiple geographies, which requires solidity in their state structures [17]. As in 2015, we find that among the significant national problems are security, education, distribution and water insurance, and economic growth, which represent factors that contribute to the population’s quality of life.
2.2 Population and housing census
The 2021 population and housing census is a study whose objective is to collect information and diagnose the current sociodemographic situation in Mexico. The emphasis in this study is on the analysis and characterization of the information in multiple qualitative or quantitative forms, so the definition of sociodemographic indicators is done freely.
In general, with this study, conclusions and recommendations can be obtained based on the interpretation of the information obtained, using the information from the defined indicators as a reference but not as a decision element. It usually underlies the specialist’s knowledge, who analyses the population and housing census [18].
This research uses an outranking method, the hierarchical version of the ELECTRE III proposed by Corrente et al. [19] to aggregate preferences and construct the decision maker’s preferential model in a hierarchy of criteria. The original ELECTRE III was proposed by Roy [20]. The methods allow generating a ranking of the states of Mexico in each subgroup of criteria regarding its marginalization level.
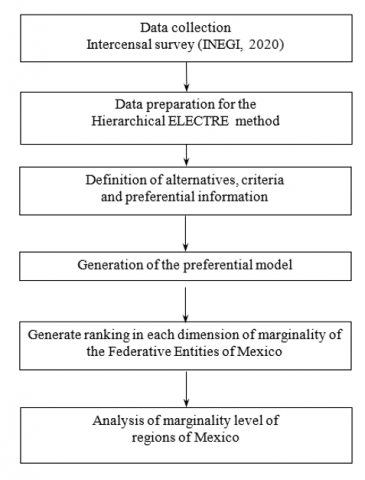
Figure 1. Research framework of the analysis of marginalization in Mexico
Therefore, it is proposed to carry out a multicriteria ranking of the states considering their level of marginalization. Figure 1 illustrates the methodological procedure to analyze the marginalization of Mexico. With the comprehensive ranking a classification of the regions is presented.
These results can be compared over time or with previous studies since the ranking between states or federative entities expresses a greater or lesser degree of marginalization based on the sociodemographic indicators of housing, education, territorial distribution, and income. Unlike the numerical indices that can present different classifications of marginality according to the value, this, in turn, depends on the variability of the data. In that sense, the ranking can be compared between previous results because if a federative entity is presented with higher marginalization than another in different studies or times, it can be said that the state federative entity remains with a higher degree of marginalization in the course of study time.
3.1 The hierarchical ELECTRE III method
The Multiple Criteria Hierarchy Proces (MCHP) was introduced first in study [21] to deal with problems where criteria do no correspond to the same level. Instead, a hierarchy structure is used to organize them in a subpart of the problem. The idea is considering the preference relation on subset of criteria in a hierarchy. In this case, it is needed the preference information elicitation and final recommendation analysis [21].
The authors [19] integrates the MCHP with ELECTRE III method (H-EIII). The notation to work with a hierarchy of criteria is the follow.
$G$ is a comprehensive set of all criteria at all considered levels in the hierarchy.
$G_0$ is the root of the criterion.
$l_G$ is the set of indices of the criteria in $G$.
$E_G \subseteq l_G$ is the set of indices of elementary criteria.
$g_r$ is the generic non-root criterion (where $r$ is a vector with length equal to the level of the criterion).
$g_{(r, 1)}, \ldots, g_{(r, n(r))}$ are the immediately subcriteria of criterion $g_r$ (located at the level below $g_r$ ).
$E\left(g_r\right)$ is the set of indices of all the elementary criteria descending from $g_r$.
$E(F)$ is the set of indices of the elementary criteria descending from at least one criterion in the subfamily $F \subseteq G$ (that is, $E(F)=U_{g_r } \in E\left(g_r\right)$ ).
$G_r$ is the set of subcriteria of $g_r$ located at level $l$ in the hierarchy (below $g_r$ ).
The H-EIII method is carried out in two steps. In the first step, the aggregation of preference information is developed, constructing a decision model in the valued outranking relation. In the second step, the valued outranked relation is exploited by the distillation process, generating a complete or partial ranking of alternatives. The description of the H-EIII is presented below.
For each elementary criterion $g_t \in E_g$.
The elementary concordance index, for each elementary criterion $g_t$ .
$\varphi_t(a, b)=\left\{\begin{array}{lll}1 & \text { if } & g_t(b)-g_t(a) \leq q_t,(a S b) \\ \frac{p_t-\left[g_t(b)-g_t(a)\right]}{p_t-q_t} & \text { if } & q_t<g_t(b)-g_t(a)<p_t,(b Q a) \\ 0 & \text { if } & g_t(b)-g_t(a) \geq p_t,\left(b P_t a\right)\end{array}\right.$ (1)
The discordant elementary index, for each elementary criterion $g_t$ .
$d_t(a, b)=\left\{\begin{array}{lll}1, & \text { if } & g_t(b)-g_t(a) \geq v_t, \\ \frac{\left[g_t(b)-g_t(a)\right]-p_t}{v_t-p_t} & \text { if } & p_t<g_t(b)-g_t(a)<v_t, \\ 0, & \text { if } & g_t(b)-g_t(a) \leq p_t .\end{array}\right.$ (2)
The partial concordance index for each non-elementary criterion $g_r$ ,
$C_r(a, b)=\frac{\sum_{t \in E\left(g_r\right)} w_t \varphi_t(a, b)}{\sum_{t \in E\left(g_r\right)} w_t}$ (3)
Partial credibility index,
$\sigma_r(a, b)= \begin{cases}C(a, b) x \prod_{g_t \in E\left(g_r\right)} \frac{1-d_t(a, b)}{1-C_r(a, b)} & \text { if } \quad d_t(a, b)>C_r(a, b) \\ C(a, b) & \text { otherwise }\end{cases}$ (4)
The distillation method is used as an exploitation procedure of the fuzzy outranking relation. For the pairs, $a, b \in A$ in the hierarchical process, the alternatives are ranked in a partial or complete preorder on the non-elementary criterion $g_r$. For a further description of the distillation process see reference [22].
Marginality in Mexico can be measured through the population census conducted by the study [18]. Marginality is studied in Mexico by the National Population Council of Mexico (CONAPO). The situation of marginality of the population can be analyzed in four dimensions with the information currently available. The dimensions included in the INEGI’s survey [18] are education, housing, population, and monetary dispersion.
4.1 Definition of decision criteria
Educational dimension
One dimension considered in the census is education. In Mexico, education is contemplated in the Mexican Constitution. It establishes the mandatory nature of primary, secondary, and high school education. There is consensus that access to knowledge is essential for people to acquire the conditions and capacities to carry out their life projects, associating themselves with freedom, autonomy, innovation, and social mobility. The lack of these conditions and capacities negatively impacts the population in terms of social and economic development. As CONAPO states [2], backwardness and desertion intensify marginalization.
Regarding the implication of education in the population, the education dimension includes the following indicators:
Dimension of the housing
Housing is considered a human right. It is enshrined in the fourth article of the Mexican Constitution; establishes that “every family has the right to enjoy decent housing”. The article indicates that “the Law will establish the instruments and support necessary to achieve this objective”. CONAPO identifies as a metric that decent housing must have at least essential services such as electricity, water, and drainage [2]. The structure must be built with quality, durable materials that do not affect health and have enough space for individual and family activities of its inhabitants [16].
For CONAPO, the lack of essential services is considered an expression of socio-spatial exclusion, inequity, and inequality [2]. In study [23], it is expressed that a consensual definition is a statistical relationship between objective conditions and subjective perceptions. Poor housing conditions, together with educational disadvantages, create scenarios of sociodemographic disadvantage and vulnerability. The housing dimension includes the following indicators to measure marginality:
Territorial distribution dimension
In Mexico, there are around 100 less populated municipalities concentrated in 3 states: 88 in Oaxaca, 7 in Sonora, and 5 in Puebla, of inhabitants that suppose population dispersion and, in some cases, inaccessibility. It is considered a negative impact that affects the opportunities available because economies of scale, urbanization, and location are reduced [2].
The dispersion of the population must be considered in the design of comprehensive strategies to promote production, access to goods and services, and social inclusion while reducing inequality. Population dispersion can be affected by geographic area. It means that the spatial location already has areas that limit development. For the population distribution dimension, the following indicator is considered.
Economic dimension
In a particular approach, marginality is closely related to the condition of poverty. However, poverty extends beyond the Economic dimension and is more than simply a deprivation of income or consumption capacity [24]. On the other hand, the economic dimension must be considered in measuring marginality. It is part of a multidimensional approach.
The population must have the opportunity to access decent work as part of a human right and a fair wage. The concept of minimum wage is the primary measure of remuneration. However, it is debatable whether it guarantees the coverage of a worker’s basic needs of food, education, health, housing, clothing, and recreation [2]. In Mexico, two minimum wages are considered the income that constitutes the lower limit for people to have access to essential items related to state social spending and the possibilities of achieving competitive participation in labor markets [2]. For the current dimension, the following metric is evaluated:
The indicators described above are used as decision criteria with the method described in Section 3.1. The terms indicator and criterion will be used interchangeably in the rest of the document. These indicators are considered decision criteria, and the indicators are evaluated in decreasing direction. They are summarized in shorter terms in Table 1. Table 2 shows the states of the country that will be evaluated to find the levels of marginality in the population.
The level of marginalization of the regions is a relevant social study, even though its analysis has well-defined indices. The analysis from a multicriteria approach is carried out with data from 2020 and its effects of the Covid in the leading selected sociodemographic indicators, which for this case are nine criteria (see Table 1). A ranking of the States is carried out concerning their degree of marginalization, considering as decision criteria the dimensions defined by CONAPO. The problem that arises in this research corresponds to the analysis of the level of essential services of housing, education, territorial distribution, and income level.
Table 1. Decision criteria for marginalization evaluation of Mexico
|
Criterion |
Name |
Description |
|
C1 |
Population aged 15 years and over illiterate |
It is the percentage of the population aged 15 years or over who is illiterate. |
|
C2 |
Population aged 15 and over without basic education |
It is the percentage of the population aged 15 years or over without basic education. |
|
C3 |
Inhabited private homes without drainage or toilet |
Percentage of occupants in private dwellings inhabited without drainage or toilet. |
|
C4 |
Occupants in homes without electricity |
It is the percentage of occupants in homes without electricity. |
|
C5 |
Occupants in homes without piped water |
It is the percentage of occupants in homes without piped water. |
|
C6 |
Occupants in private dwellings with dirt floors. |
It is the percentage of occupants in private dwellings with dirt floors. |
|
C7 |
Private dwellings inhabited with overcrowding |
It is the percentage of inhabited dwellings with overcrowding. |
|
C8 |
Population in localities with less than 5,000 inhabitants |
It is the percentage of the population in localities with less than 5,000 inhabitants. |
|
C9 |
Population in localities with incomes of up to 2 minimum wages. |
It is the percentage of the employed population with an income of up to 2 times the minimum wage. |
Table 2. Political division and population of the federative entities of Mexico
|
Label |
Federal Entity |
Population |
|
A1 |
Aguascalientes |
1 425 607 |
|
A2 |
Baja California |
3 769 020 |
|
A3 |
Baja California Sur |
798 447 |
|
A4 |
Campeche |
928 363 |
|
A5 |
Coahuila de Zaragoza |
3 146 771 |
|
A6 |
Colima |
731 391 |
|
A7 |
Chiapas |
5 543 828 |
|
A8 |
Chihuahua |
3 741 869 |
|
A9 |
Ciudad de México |
9 209 944 |
|
A10 |
Durango |
1 832 650 |
|
A11 |
Guanajuato |
6 166 934 |
|
A12 |
Guerrero |
3 540 685 |
|
A13 |
Hidalgo |
3 082 841 |
|
A14 |
Jalisco |
8 348 151 |
|
A15 |
México |
16 992 418 |
|
A16 |
Michoacán de Ocampo |
4 748 846 |
|
A17 |
Morelos |
1 971 520 |
|
A18 |
Nayarit |
1 235 456 |
|
A19 |
Nuevo León |
5 784 442 |
|
A20 |
Oaxaca |
4 132 148 |
|
A21 |
Puebla |
6 583 278 |
|
A22 |
Querétaro de Arteaga |
2 368 467 |
|
A23 |
Quintana Roo |
1 857 985 |
|
A24 |
San Luis Potosí |
2 822 255 |
|
A25 |
Sinaloa |
3 026 943 |
|
A26 |
Sonora |
2 944 840 |
|
A27 |
Tabasco |
2 402 598 |
|
A28 |
Tamaulipas |
3 527 735 |
|
A29 |
Tlaxcala |
1 342 977 |
|
A30 |
Veracruz de Ignacio de la Llave |
8 062 579 |
|
A31 |
Yucatán |
2 320 898 |
|
A32 |
Zacatecas |
1 622 138 |
The identification of marginality in Mexico is developed with data generated by study [2] in a survey throughout the population census carried out every five years in Mexico. Most of the indicators are obtained from the tabulations of the basic questionnaire. Table 3 lists the States and performance on each criterion (see Table 1 for the definition of the criteria).
Table 3. Performance of the Federal Entities of Mexico with respect to the criteria (CONAPO, 2020)
|
Label |
C1 |
C2 |
C3 |
C4 |
C5 |
C6 |
C7 |
C8 |
C9 |
|
A1 |
2.11 |
23.58 |
0.35 |
0.23 |
0.55 |
0.77 |
13.13 |
21.27 |
58.50 |
|
A2 |
1.83 |
24.68 |
0.20 |
0.58 |
2.10 |
1.91 |
14.59 |
8.46 |
73.55 |
|
A3 |
2.34 |
23.98 |
0.42 |
0.96 |
5.39 |
5.06 |
18.60 |
10.28 |
45.49 |
|
A4 |
5.86 |
29.78 |
2.52 |
1.05 |
3.98 |
2.69 |
29.97 |
29.92 |
70.01 |
|
A5 |
1.67 |
21.49 |
0.30 |
0.17 |
0.94 |
0.75 |
13.48 |
10.04 |
60.03 |
|
A6 |
3.37 |
27.82 |
0.27 |
0.33 |
0.66 |
2.62 |
15.31 |
13.50 |
59.73 |
|
A7 |
13.70 |
48.12 |
2.46 |
1.80 |
10.68 |
12.39 |
36.09 |
57.64 |
85.57 |
|
A8 |
2.63 |
27.30 |
1.42 |
1.66 |
1.66 |
2.18 |
13.60 |
14.39 |
66.70 |
|
A9 |
1.43 |
17.64 |
0.05 |
0.05 |
1.24 |
0.63 |
14.40 |
1.01 |
56.13 |
|
A10 |
2.73 |
27.49 |
2.84 |
2.09 |
2.31 |
4.26 |
16.21 |
32.50 |
69.26 |
|
A11 |
5.29 |
33.53 |
1.93 |
0.38 |
2.91 |
2.42 |
16.90 |
33.26 |
67.09 |
|
A12 |
12.47 |
42.55 |
9.38 |
1.41 |
11.55 |
15.27 |
32.86 |
48.15 |
80.28 |
|
A13 |
6.62 |
29.91 |
1.90 |
0.64 |
3.87 |
2.85 |
18.52 |
53.83 |
73.95 |
|
A14 |
2.90 |
29.54 |
0.57 |
0.30 |
0.75 |
1.66 |
14.02 |
16.16 |
55.86 |
|
A15 |
2.90 |
24.96 |
1.21 |
0.26 |
2.78 |
2.08 |
20.70 |
19.15 |
66.00 |
|
A16 |
7.05 |
42.41 |
1.37 |
0.49 |
2.82 |
5.59 |
18.83 |
37.53 |
70.62 |
|
A17 |
4.45 |
27.53 |
0.73 |
0.30 |
4.22 |
4.10 |
19.28 |
26.13 |
73.59 |
|
A18 |
4.49 |
29.05 |
3.97 |
2.13 |
3.02 |
3.99 |
18.01 |
36.47 |
64.82 |
|
A19 |
1.47 |
19.07 |
0.10 |
0.11 |
0.70 |
0.79 |
13.20 |
5.14 |
46.79 |
|
A20 |
11.82 |
45.28 |
1.94 |
1.92 |
10.00 |
13.99 |
29.45 |
59.40 |
78.85 |
|
A21 |
6.97 |
36.87 |
1.13 |
0.61 |
4.66 |
5.34 |
25.53 |
36.08 |
77.30 |
|
A22 |
3.48 |
23.63 |
1.66 |
0.47 |
2.13 |
2.02 |
15.13 |
28.83 |
57.08 |
|
A23 |
3.07 |
22.53 |
1.14 |
0.82 |
1.66 |
2.42 |
26.13 |
11.47 |
57.26 |
|
A24 |
5.02 |
29.32 |
1.52 |
1.18 |
7.64 |
4.97 |
16.77 |
36.03 |
64.88 |
|
A25 |
3.56 |
28.86 |
1.37 |
0.40 |
1.40 |
2.26 |
18.87 |
29.26 |
61.77 |
|
A26 |
1.99 |
22.41 |
0.66 |
0.66 |
1.30 |
2.42 |
16.62 |
15.16 |
63.22 |
|
A27 |
5.09 |
29.17 |
1.76 |
0.49 |
6.18 |
3.37 |
26.09 |
53.27 |
71.75 |
|
A28 |
2.58 |
25.79 |
0.25 |
0.43 |
1.62 |
1.42 |
17.43 |
11.24 |
76.27 |
|
A29 |
3.35 |
26.94 |
0.90 |
0.41 |
0.89 |
1.80 |
22.24 |
32.13 |
78.81 |
|
A30 |
8.50 |
39.88 |
1.26 |
1.07 |
8.67 |
5.98 |
23.09 |
45.86 |
78.12 |
|
A31 |
6.00 |
31.55 |
5.87 |
0.69 |
1.06 |
1.41 |
26.17 |
23.32 |
69.68 |
|
A32 |
3.76 |
32.31 |
2.32 |
0.46 |
1.83 |
1.25 |
16.25 |
44.42 |
71.92 |
5.1 Modeling preferences
The decision-maker must select the criteria, the direction of the criteria, the weight of the criteria, and the pseudo criteria thresholds; this corresponds to the definition of the parameters of the H-EIII method. The model requires the importance weights of the criteria (w), indifference threshold (q), preference threshold (p), and veto threshold (v). Once the parameters have been defined, a preferential model is generated that consists of a valued outranking relationship. For the definition of weights, a tool based on the Simos procedure in its revised version was used [25]. The tool allows generating a numerical value for each criterion. The decision-maker needs to order them from least to most significant importance. The decision-maker has the freedom to maximize or minimize each of the criteria. Table 4 shows the direction of each criterion, weight, indifference, and preference threshold. Due the concept of marginality and the relation with the quality of life and access to basic service, the indicators are constructed regarding the higher the value, higher the marginality level. In this sense, they are cost criteria where the minimum value is preferred.
Table 4. Model parameters for the evaluation of marginalization.
|
C1 |
C2 |
C3 |
C4 |
C5 |
C6 |
C7 |
C8 |
C9 |
|
|
Dir |
Min |
Min |
Min |
Min |
Min |
Min |
Min |
Min |
Min |
|
w |
0.12 |
0.06 |
0.11 |
0.13 |
0.17 |
0.11 |
0.09 |
0.09 |
0.13 |
|
q |
0.40 |
2.00 |
0.10 |
0.10 |
0.10 |
0.05 |
0.10 |
0.30 |
1.00 |
|
p |
0.60 |
4.00 |
0.20 |
0.20 |
0.15 |
0.10 |
0.20 |
0.60 |
2.00 |
w is the criterion weight
q is the criterion indifference threshold
p is the criterion preference threshold
5.2 Marginality ranking
This section presents the results of individual ranking based on multi-criteria analysis for decision-making, an approach that considers the multiple dimensions involved in the evaluation. The study was carried out with the help of a decision support system to rank a set of alternatives valued by multiple criteria.
The condition of marginality must be explained concerning the particular situation of each federative entity. The aggregation process explained in Section 2 was performed to model the experts’ preferences. Compare states based on marginality records. The result is a classification of the States based on their level of marginalization. It is shown in Table 5.
The ranking shows the level of marginality. The regions with the lowest level of marginality are listed at the top. The highest level of marginality is shown at the bottom. The states with the lowest level of marginalization are Nuevo Leon (A19), Aguas Calientes (A1), and Mexico City (A9). The states with the highest level of marginality are Oaxaca (A20), Chiapas (A7), and Guerrero (A12).
Table 5 shows the result of the ranking. For the problem of ranking the Federal Entities of Mexico based on the criteria of education, housing, territorial distribution, and monetary income, the method generated four classes. The positions on the top correspond to the states with the lowest degree of marginalization. The positions on the bottom correspond to the highest degree of marginalization. CONAPO in study [2] presents four categories in its marginalization index that correspond to Very low, Low, Medium, and High; for this case, these categories are considered. Each class was assigned to a category for the generated ranking, as shown in Table 5.
Table 5. Ranking of the regions of Mexico on each dimension
|
Position |
g0 Comprenhensive Problem |
g1 Education |
g2 Housing |
g3 Territorial Distribution |
g4 Economic Dimension |
|
01 |
Nuevo León |
Ciudad de México |
Nuevo León |
Ciudad de México |
Baja California Sur |
|
02 |
Aguascalientes |
Nuevo León |
Aguascalientes |
Nuevo León |
Nuevo León |
|
03 |
Ciudad de México |
Coahuila |
Coahuila |
Baja California |
Jalisco |
|
04 |
Jalisco |
Aguascalientes |
Ciudad de México |
Coahuila |
Ciudad de México |
|
05 |
Coahuila |
Sonora |
Jalisco |
Baja California Sur |
Quintana Roo |
|
06 |
Colima |
Baja California |
Tamaulipas |
Tamaulipas |
Querétaro |
|
07 |
Baja California |
Baja California Sur |
Colima |
Quintana Roo |
Aguascalientes |
|
08 |
Sonora |
Quintana Roo |
Tlaxcala |
Colima |
Coahuila |
|
09 |
Querétaro |
Tamaulipas |
Baja California |
Chihuahua |
Colima |
|
10 |
Tamaulipas |
México |
México |
Sonora |
Sinaloa |
|
11 |
México |
Chihuahua |
Sonora |
Jalisco |
Sonora |
|
12 |
Chihuahua |
Durango |
Sinaloa |
México |
Nayarit |
|
13 |
Quintana Roo |
Querétaro |
Querétaro |
Aguascalientes |
San Luis Potosí |
|
14 |
Tlaxcala |
Jalisco |
Quintana Roo |
Yucatán |
México |
|
15 |
Sinaloa |
Tlaxcala |
Zacatecas |
Morelos |
Chihuahua |
|
16 |
Zacatecas |
Colima |
Morelos |
Querétaro |
Guanajuato |
|
17 |
Baja California Sur |
Sinaloa |
Chihuahua |
Sinaloa |
Durango |
|
18 |
Guanajuato |
Morelos |
Baja California Sur |
Campeche |
Yucatán |
|
19 |
Morelos |
Nayarit |
Guanajuato |
Tlaxcala |
Campeche |
|
20 |
Yucatán |
Zacatecas |
Michoacán |
Durango |
Michoacán |
|
21 |
San Luis Potosí |
San Luis Potosí |
Puebla |
Guanajuato |
Tabasco |
|
22 |
Michoacán |
Tabasco |
Tabasco |
Puebla |
Zacatecas |
|
23 |
Hidalgo |
Guanajuato |
Hidalgo |
San Luis Potosí |
Baja California |
|
24 |
Puebla |
Campeche |
San Luis Potosí |
Nayarit |
Morelos |
|
25 |
Tabasco |
Yucatán |
Yucatán |
Michoacán |
Hidalgo |
|
26 |
Durango |
Hidalgo |
Campeche |
Zacatecas |
Tamaulipas |
|
27 |
Campeche |
Puebla |
Durango |
Veracruz |
Puebla |
|
28 |
Veracruz |
Michoacán |
Nayarit |
Guerrero |
Veracruz |
|
29 |
Nayarit |
Veracruz |
Veracruz |
Tabasco |
Tlaxcala |
|
30 |
Oaxaca |
Oaxaca |
Oaxaca |
Hidalgo |
Oaxaca |
|
31 |
Chiapas |
Guerrero |
Chiapas |
Chiapas |
Guerrero |
|
32 |
Guerrero |
Chiapas |
Guerrero |
Oaxaca |
Chiapas |
Table 6. Classification of marginality level of regions
|
Class |
Current Research |
CONAPO |
|
|
Nuevo León |
Nuevo León |
|
|
Aguascalientes |
Ciudad de México |
|
G1 |
Ciudad de México |
Coahuila |
|
|
Jalisco |
Aguascalientes |
|
|
Coahuila |
Jalisco |
|
|
|
|
|
|
Colima |
Baja California Sur |
|
|
Baja California |
Baja California |
|
|
Sonora |
Colima |
|
G2 |
Querétaro |
Tamaulipas |
|
|
Tamaulipas |
Sonora |
|
|
México |
Querétaro |
|
|
Chihuahua |
México |
|
|
Quintana Roo |
Quintana Roo |
|
|
|
|
|
|
Tlaxcala |
Tlaxcala |
|
|
Sinaloa |
Sinaloa |
|
G3 |
Zacatecas |
Morelos |
|
|
Baja California Sur |
Chihuahua |
|
|
Guanajuato |
Zacatecas |
|
|
Morelos |
Guanajuato |
|
|
|
|
|
|
Yucatán |
San Luis Potosí |
|
|
San Luis Potosí |
Tabasco |
|
|
Michoacán |
Durango |
|
|
Hidalgo |
Hidalgo |
|
G4 |
Puebla |
Puebla |
|
|
Tabasco |
Michoacán |
|
|
Durango |
Campeche |
|
|
Campeche |
Nayarit |
|
|
Veracruz |
Yucatán |
|
|
Nayarit |
Veracruz |
|
|
|
|
|
|
Oaxaca |
Oaxaca |
|
G5 |
Chiapas |
Chiapas |
|
|
Guerrero |
Guerrero |
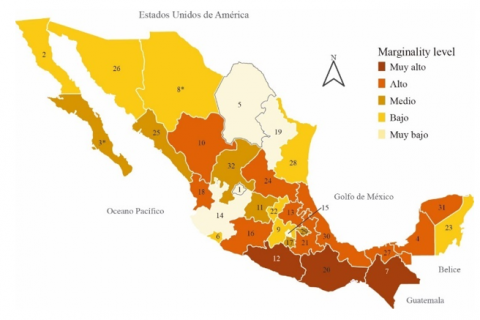
Figure 2. Marginality situation of Mexico
The ranking regarding the marginality situation of regions of Mexico allows the comparison with the result obtained by CONAPO in study [2]. It allows identifying how marginality is characterized in geographic locations. The level of marginality was divided into four categories, which helps identify the sociodemographic situation. The categories are very low, low, medium, and high level of marginality. Figure 2 shows the distribution of the regions of Mexico based on their level of marginality.
The first category (beige) contains regions with a very low degree of marginalization. The yellow color represents the regions with low marginalization. The brown color category is found in regions with medium levels. Orange represents the high marginalization, and red the very high marginalization.
Regions with very low marginalization are presented in the first position of the comprehensive ranking (g0): Nuevo Leon and Aguas Calientes. Mexico City is the best in education (g1) and territorial distribution dimension (g3). Nuevo Leon is first in the dimension Housing (g2). Baja California Sur is the best in the economic dimension (g4). Meanwhile, based on those published by CONAPO [2], the State of Mexico City is in second place compared to the MCDA model generated by the State of Aguas Calientes. In general, based on the ranking obtained and published by CONAPO [2], it can be observed that both the MCDA and CONAPO rankings share the same first-place position.
Table 6 shows both ranking from the current research and CONAPO approach. The ranking obtained with the multicriteria decision-making (MCDM) approach is similar to the ranking generated by CONAPO [2]. Only two regions are in different marginality categories Chihuahua and Baja California Sur. Chihuahua is in a better marginality situation (low marginality) in the current research. The CONAPO approach positioned it in medium marginality. Baja California Sur is in worst position in the current research (medium marginality). CONAPO shows it in low marginality.
The classification result shows a ranking based on the sociodemographic criteria obtained from CONAPO [2], education, housing, territorial distribution, and monetary income.
Analyzing the data of some regions, some essential differences in performances of decision criteria are visible. Figures 3 and 4 show the performances of regions with very high and very low marginalization, respectively.
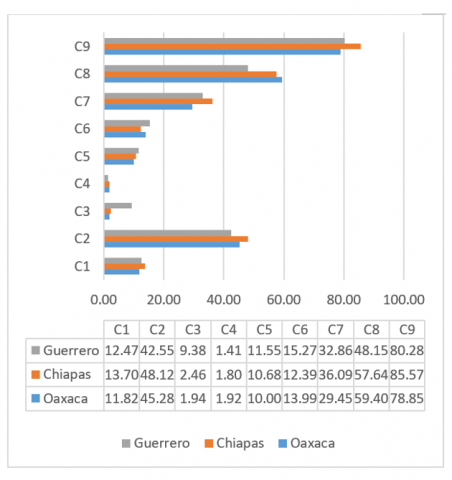
Figure 3. Performance of regions with very high marginalization
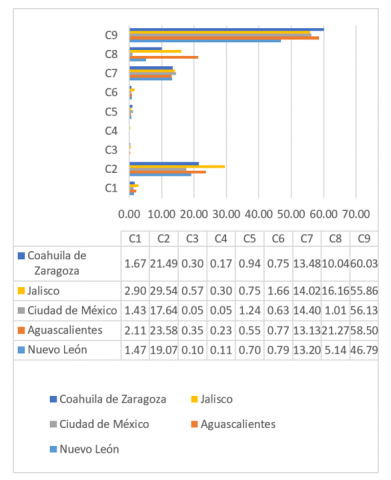
Figure 4. Performance of regions with very low marginalization
There is a relationship between the low indices obtained by each region with very high marginalization, such as Oaxaca, Chiapas, and Guerrero. The performances shown in Figure 3 contain inferior sociodemographic characteristics of the regions. On other hand, the regions with very low marginality are Nuevo León, Aguascalientes, Mexico City, Jalisco and Coahuila. The performances shown in Figure 4 are superior to the rest of regions in Mexico.
5.3 Discussion
The country by its territorial distribution can be framed geographical areas where there is greater marginalization in the country’s southwest, such as; Oaxaca, Chiapas, and Guerrero, contrary to the States located in the Northwest and Northeast zones. The rest of the country’s states are in a high marginalization, and medium marginalization is in a better position than Low and Very Low Marginality such as Nuevo León and Coahuila with very low Marginality and Baja California Norte, Sonora, Chihuahua and Tamaulipas low marginality, which is located on the country’s border with the United States.
In the Center of the Country, the states of Jalisco and Mexico City with very low marginalization. Zárate Valdez [26] mentions that 80 percent of these groups live in rural communities, generally far from urban centers, with insufficient education and medical services, low-profile and low-paid work sources, tiny homes with few goods, and lacking electricity, drainage, and quality drinking water. As shown in Figure 5, 40 percent of the country’s states are in very high and high marginalization, and 38 percent are in very low and low marginalization. Finally, 22 percent are in average marginalization of the country’s states.
Marginality is claimed to exist throughout the world, even in developed countries. However, marginality appears to be more entrenched in developing countries. Even so, it is necessary to develop inclusion policies to improve the situation of the marginalized population in Mexico. The indicators were analyzed to confirm the state of marginalization, vulnerability, and fragility of this population sector and mark the urgent need for tangible support from the state. Political decision-making requires better actions in specific geographic areas of the population, considering the cultural condition and developing innovative and sustainable strategies.
Figure 5. Distribution of marginality in Mexico
Decision-making or optimization methods can be implemented to address the problem of developing marginal areas to find sustainable solutions, such as investment or development projects. The implementation of this method will help evaluate the feasibility of the implementation of the solution. The factors influencing the diffusion rate need to be better understood, as all development interventions seek to introduce innovations, and unless the innovation is widely adopted, its contribution to economic or social development is minimal [3].
The generated ranking of marginality in Mexico concerns essential services of housing, education, territorial distribution, and monetary income, which were developed with multi-criteria analysis techniques to aid decision-making. In particular, the hierarchical version of ELECTRE III method was applied to construct the preferential model to generate the multicriteria rankings of the states of Mexico. In this sense, the method supports decision-making for complex problems in the real world.
With the decision process described, it was possible to observe in the ordering of the states those that presented a lowest degree of marginalization and those that presented a highest degree of marginalization. In addition, a comparative analysis between rankings was carried out using the MCDM approach and the one published by CONAPO [2], observing that the multi-criteria ranking implemented here generates a ranking similar to that of the marginalization index with the sociodemographic indicators of basic housing needs, education and income. Part of the result of this research corresponds to the generation of the ranking of the states of Mexico based on their level of marginalization. Finally, it can be established that there are differences in the H-EIII method in terms of the order generated and the one established by CONAPO [2].
As part of future lines of research, an investigation of the countries worldwide could be studied and thus compare the rankings with new methods in comparison with the CONAPO data.
|
$g_t$ |
Elementary criterion |
|
$W_r$ |
Weight of the macrocriterion |
|
$W_t$ |
Weight of the elementary criterion |
|
$q_t$ |
Indifference threshold |
|
$p_t$ |
Preference threshold |
|
$v_t$ |
Veto threshold |
|
$d_t$ |
Discordant elementary index |
|
$C_r$ |
Partial concordance index |
|
$g_r$ |
is the generic non-root criterion |
|
$E_G$ |
The set of indices of elementary criteria |
|
Greek symbols |
|
|
$\varphi_t$ |
Elementary concordance index |
|
$\sigma_r$ |
Partial concordance index |
[1] Palomares, R.C., i Hernàndez, J.A.A. (2012). Aportaciones a la construcción de un modelo de desarrollo local: La experiencia del ayuntamiento de Catarroja. Gestión y Análisis de Políticas Públicas, (7): 149-172.
[2] CONAPO. Índice de marginación por entidad federativa 2020. Consejo Nacional de Población 2021 October 2021; Available from: https://www.gob.mx/conapo/documentos/indices-de-marginacion-2020-284372.
[3] Yap, N.T., Devlin, J.F. (2015). Beekeeping innovation for sustaining rural livelihoods. A success story. International Journal of Innovation and Sustainable Development, 9(2): 103-117. https://doi.org/10.1504/IJISD.2015.068771
[4] Musa, H.D., Yacob, M.R., Abdullah, A.M., Ishak, M.Y. (2020). Urban sustainability and gross national happiness: A review of community well-being domains and dimensions. International Journal of Innovation and Sustainable Development, 14(2): 157-184. https://doi.org/10.1504/IJISD.2020.106228
[5] Von Braun, J., Gatzweiler, F.W. (2014). Marginality—an overview and implications for policy. Marginality: Addressing the Nexus of Poverty, Exclusion and Ecology, 1-23.
[6] Pelc, S., Nel, E. (2020). Social innovation and geographical marginality. Responses to Geographical Marginality and Marginalization: From Social Innovation to Regional Development, 11-21. https://doi.org/10.1111/soru.12119
[7] Von Braun, J., Hill, R.E., Pandya-Lorch, R. (Eds.). (2009). The poorest and hungry: Assessments, analyses, and actions. Washington, DC: International Food Policy Research Institute.
[8] Gatzweiler, F.W., Baumüller, H., Ladenburger, C., von Braun, J. (2011). Marginality: Addressing the Root Causes of Extreme Poverty. SSRN Electronic Journal.
[9] Peña, S. (2005). Recent developments in urban marginality along Mexico's northern border. Habitat International, 29(2): 285-301. https://doi.org/10.1016/j.habitatint.2003.10.002
[10] Collier, P. (2007). The bottom billion: Why the poorest countries are failing and what can be done about it. Oxford University Press, USA.
[11] Ferretti, V., Gandino, E. (2018). Co-designing the solution space for rural regeneration in a new World Heritage site: A choice experiments approach. European Journal of Operational Research, 268(3): 1077-1091. https://doi.org/10.1016/j.ejor.2017.10.003
[12] Cuevas, S., Blanco, J., Juárez, C., Palma, O., Valdez-Santiago, R. (2006). Violencia y embarazo en usuarias del sector salud en estados de alta marginación en México. Salud pública de México, 48(2): 239-249.
[13] Álvarez, G., Lara, F., Harlow, S.D., Denman, C. (2009). Mortalidad infantil y marginación urbana: Análisis espacial de su relación en una ciudad de tamaño medio del noroeste mexicano. Revista Panamericana de Salud Pública, 26(1): 31-38.
[14] Jelassi, T., Kersten, G., Zionts, S. (1990). An Introduction to Group Decision and Negotiation Support, pp. 537-568.
[15] Henig, M.I., Buchanan, J.T. (1997). Tradeoff directions in multiobjective optimization problems. Mathematical Programming, 78(3): 357-374. ttps://doi.org/10.1007/BF02614361
[16] CONAPO, Índice de marginación por entidad federativa y municipio 2015. 2016, México: Consejo Nacional de Población.
[17] Vigil, J.I., Priolo, D.J. (2014). Desafíos del Estado local: Problemas de la articulación de políticas de múltiples geografías. Revista de Ciencia Política, 52(1): 7-38. https://doi.org/10.5354/07195338.2014.33096
[18] INEGI. Censo de Población y Vivienda 2020: Tabulados interactivos. https://www.inegi.org.mx/programas/ccpv/2020/#Tabulados
[19] Corrente, S., Greco, S., Słowiński, R. (2013). Multiple criteria hierarchy process with ELECTRE and PROMETHEE. Omega, 41(5): 820-846. https://doi.org/10.1016/j.omega.2012.10.009
[20] Roy, B. (1990). The outranking approach and the foundations of ELECTRE methods. In Multiple Criteria Decision Aid, C.A. Bana e Costa, Editor. Springer-Verlag: Berlin, pp. 155-183. https://doi.org/10.1007/BF00134132
[21] Corrente, S., Greco, S., Słowiński, R. (2012). Multiple criteria hierarchy process in robust ordinal regression. Decision Support Systems, 53(3): 660-674. https://doi.org/10.1016/j.dss.2012.03.004
[22] Marzouk, M.M. (2011). ELECTRE III model for value engineering applications. Automation in Construction, 20(5): 596-600. https://doi.org/10.1016/j.autcon.2010.11.026
[23] Till, M. (2007). Assessing the housing dimension of social inclusion in six European countries. Innovation: The European Journal of Social Science Research,18(2): 153-181. https://doi.org/10.1080/13511610500096475
[24] Sen, A., Anand, S. Concepts of human development and poverty: A multidimensional perspective. In Poverty and Human Development: Human Development Papers 1997, S. Fukuda-Parr and A.K. Shiva Kumar, Editors. 1997, United Nations Development Programme: New York. pp. 1-20.
[25] Figueira, J., Roy, B. (2002). Determining the weights of criteria in the electre type methods with a revised Simos' procedure. European Journal of Operational Research, 139(2): 317–326. https://doi.org/10.1016/S0377-2217(01)00370-8
[26] Zárate Valdez, J.L. (2016). Grupos étnicos de Sonora: Territorios y condiciones actuales de vida y rezago. Religión y Sociedad, 28(65): 5-43. https://doi.org/10.1504/IJISD.2015.068771