Zoe T. Infante![]() | Priscila Ortega*
| Priscila Ortega*![]() | Rómulo Duarte
| Rómulo Duarte![]()
OPEN ACCESS
This paper presents a comprehensive analysis of income inequality and unequal conditions of income distribution associated with poverty in the state of Michoacán from the 1980s to 2020. The study contributes to the literature because income distribution inequality and poverty in Mexico are the result of deep internal weaknesses that have been expanding for more than three decades. We estimated the Lorenz curve and the Gini index for ten Michoacán-México regions. We identified a notorious and generalized decrease in wealth concentration in all 10 regions between 1980 and1990, while the 2000, 2015, and 2020 records evidenced a not very significant decrease. This has not been enough to allow greater and thorough social welfare; the gaps remain large. The implementation of prevention and mitigation measures based on public policies and strategies can contribute to the resolution of these problems.
Inequality of income distribution and poverty in Michoacán is evidenced by the high insecurity levels and low standard of living in households throughout the state, reason why it is urgent to promote a more just and equitable society. Mexican politics conditions the market to always favor those who have the most at the expense of others. The economic elite has pushed for a legal framework to benefit from, but Mexico’s economic system is neither efficient nor fair.
Jobless people with high educational levels tend to migrate as there is a global job market for the talent generated in all Mexican states. There should be a strategy for the return and reinsertion of Michoacán migrants to their place of origin. This high unemployment rate keeps escalating the existing inequality. And since the richest spend a smaller proportion of their income than those at the bottom - who have no choice but to spend it all - inequality results in a weakening of the state economy.
The problem in Michoacán is the insufficient aggregate demand. As crises drag on, financial institutions are less willing to lend money, housing prices decline, and families become poorer with an increasingly uncertain future, which contributes to inhibiting consumption. Austerity, inevitably and predictably, makes things worse as it hinders economic growth.
The concept of development involves qualitative as well as quantitative changes. It is not only a process of capital accumulation, greater labor productivity, and technological progress. It is also a process of “building a productive structure, the relationships and interactions between the parts that constitute such structure, the qualitative improvement of direct producers, as well as their capacities, skills, education, and training” [1]. It is a process that encompasses economic and social growth and modernization, consisting of structural change in the economy and the prevailing institutions within a society; its ultimate result is the achievement of a higher level of human development and an expansion in the capacity and freedom of people [2]. Guillaud [3] state that development is a multidimensional process that requires a deliberate strategy and organized action by institutions and society. Local development can be conceived from several approaches, depending on the purposes of the research. This study adopts an approach based on the use of natural resources in the territory to be analyzed. Development is then understood as an integral concept; as Chauca and López [4] point out, “the process of local development with an integral perspective should be based on the use of endogenous resources and capacities”. Sen [5, 6] stablished the development as a process of expansion of the real freedoms enjoyed by individuals. Innovations favor development by allowing individuals to increase their capabilities and opportunities.
Although there are different definitions of development, they all conclude that it involves factors and qualitative changes in the life of humans and the society in which they live [7].
Thus, local development stands out as a development process “that is human because in addition to material progress, it seeks the spiritual progress of individuals and of the entire community. It is territorial because it grows in a space that operates as a unit. It is multidimensional because it encompasses different spheres of the community. It is integrated because it articulates different vertical and sectoral policies and programs. It is systemic because it involves the cooperation of actors and the conciliation of interests from different spheres. It is sustainable because it is prolonged over time. It is institutionalized, participatory, planned, and innovative, especially because it innovates the management model” [7].
One of the supposed roles assumed by the government is to redistribute income, especially when the results of market processes are overly divergent. However, there is an alternative set of measures that could counteract this situation by ending the corrosive increase of poverty and inequality and even restore economic growth. A long-accepted principle is that a balanced increase in taxes (on the richest) and public spending that would stimulate the economy and increase GDP can help most significantly.
Inequality is both the cause and the consequence of the political system’s failure. It contributes to the instability of economic systems, which in turn contribute to increasing inequality even more; it constitutes a vicious downward spiral from which societies can only emerge through improving their public policies.
The level of income redistribution varies widely around the world, even among developed countries. In most OECD countries, the gap between rich and poor has widened over the past decades [8], At the country level, the income and wealth structure of the economy is a key factor that explains the characteristics of the preference for redistribution [9].
The redistributive impact of taxes and transfers may have an influence to reduce the income inequality [10]. The contribution of direct taxes with respect to indirect taxes can promote the progressivity of the tax system and contribute to the reduction of inequality [11]. Poverty alleviation is an important policy objective in developed welfare states. Empirical studies have found that factors such as demographic and economic conditions may also have an influence on poverty, affecting the relationship between social spending and poverty. A strong negative relationship is still between the level of social expenditure and poverty [10].
Para describir y analizar la distribución del ingreso de las 10 regiones del estado de Michoacán This research work is mainly based on estimating the Lorenz curve (1) and the Gini index (4).
To obtain the Gini coefficient, the monthly income of the employed population of each stratum separated by income ranges per year and by municipality was used. The Real Minimum Wage (Base 1980=100) was considered for each of the years indicated, as well as the National Consumer Price Index (INPC). With these data, the GINI index formula was applied, which is explained below and later The Lorenz curve formula was applied, obtaining increasing and decreasing income.
The required data were obtained from the National Institute of Geography and Informatics (INEGI) through the X Censo de Población y Vivienda 1980, Tabulados Básicos; XI Censo de Población y Vivienda 1990, Tabulados Básicos; XII Censo de Población y Vivienda 2000, Tabulados Básicos; Censo de Población y Vivienda 2010; Tabulados de la Encuesta Intercensal 2015 y Censo de Población y Vivienda 2020 The data on minimum wages and the consumer price index were obtained directly from the INEGI website.
3.1 The mathematical model
The Lorenz curve was estimated for Michoacán state and Gini index for ten regions composing the state of Michoacán, Mexico.
3.2 Lorenz curve model
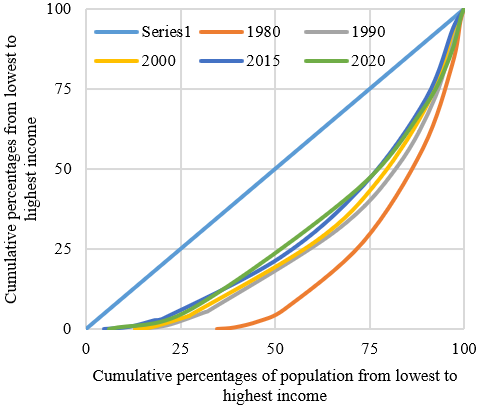
Lorenz curve is a graphic representation of household or individual income, which in this case will be used for Michoacán. The curve is plotted displaying the cumulative percentage of people or households by income level on the horizontal axis, and the percentage of cumulative income on the vertical axis. Each point on the curve represents as a cumulative percentage of households or people. The curve starts at the origin (0,0) and ends at point (100,100). If income were perfectly equally distributed, the curve would concur with the 45-degree line through the origin. In other words, the graph shows the cumulative concentration of wealth according to each subject under study.
The proportion of people or family units with an income below a certain income level is given by:
$P(r)=\int_0^r f(p) d p$ (1)
Whereas the proportion of income accumulated by people with incomes equal to or lower than r is given by:
$R(r)=\frac{\int_0^r p f_r(p) d p}{\int_0^{\infty} p f_r(p) d p}=\frac{1}{R_m} \int_0^r p f_r(p) d p$ (2)
where, R is the average income. Eqs. (1) and (2) together constitute the parametric equations of the curve as a function of the r parameter.
The Lorenz curve has a positive slope at all points as can be deduced from the following relationship:
$\left(\frac{d^2 P}{d R^2}\right)_{P_0=P\left(r_0\right)}=\frac{d}{d r}\left(\frac{d R}{d P}\right) \frac{d r}{d P}=\frac{1}{R_m} \frac{d r\left(P_0\right)}{d P}=\frac{1}{R_m} \frac{1}{f_{r\left(r_0\right)}} \geq 0$ (3)
The slope will be zero at the initial point (the previous limit is still valid, but it will be strictly positive at all other points). Moreover, the Lorenz curve is convex since its second derivative is always positive:
$\left(\frac{d P}{d P}\right)_{P_0=P\left(r_0\right)}=\frac{\frac{d R\left(r_0\right)}{d r}}{\frac{d P\left(r_0\right)}{d r}}=\frac{r_0 f_r\left(r_0\right) / R_m}{f_r\left(r_0\right)}=\frac{r_0}{R_m} \geq 0$ (4)
3.3 Gini index model
Gini index is a measure of inequality devised by Italian statistician [4]. It is a measure of income inequality in a country, but it can be used to measure any form of unequal distribution. The Gini index is a number between 0 and 1, where 0 corresponds to perfect equality (everyone has the same income) and where value 1 corresponds to perfect inequality (one person has all the income and everyone else has none). The Gini index is used to measure income inequality and wealth inequality.
The index is calculated as a ratio of the areas on the Lorenz curve diagram. If the area between the line of perfect equality and the Lorenz curve is a, and the area under the Lorenz curve is b, then the Gini coefficient is a/(a+b). This ratio is expressed as a percentage or as a numerical equivalent of that percentage, which is always a number between 0 and 1. The Gini index is often calculated with Brown’s formula:
$G=\left|1-\sum_{k-1}^{n-1}\left(X_{k+1}-X_k\right)\left(Y_{k+1}-Y_k\right)\right|$ (5)
Lorenz curve for Michoacán, there was a gradual recovery in the equality of income distribution from 1980 to 2020, but this progress has been less in the last three years of the study (see Figure 1).
Figure 1. Lorenz curve for Michoacán, 1980, 1990, 2000, 2015, and 2020
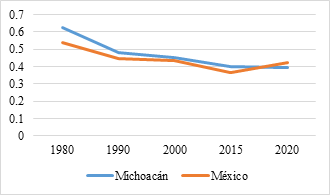
As seen in Figure 2, inequality of income distribution was higher in 1980, and it improved over the years until 2020, settling a little closer to the reference.
Figure 2. Gini Index for Michoacán and México 1980, 1990, 2000, 2015, and 2020
Notes: 1. The Gini Index estimate for 2015 was made through a weighted average (state average) because INEGI does not present complete disaggregated information for all wage strata on a municipal scale.2. Source: Authors’ design based on INEGI. X Population and Housing Census 1980, Basic Tabulations; XI Population and Housing Census 1990, Basic Tabulations; XII Population and Housing Census 2000, Basic Tabulations; Population and Housing Census 2010; Intercensal Survey 2015 Tabulations and Population and Housing Census 2020.
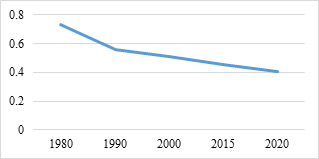
Whole region concentrated income at about 75% in 1980, which showed levels well above the state (63%) and the country (54%). Each municipality and the total region improved from 1990 to 2020, achieving a lower regional Gini index of 40% in the last year. In other words, less than half of the population in this region concentrates the total economic wealth generated by the total population. This reduction in wealth concentration was one of the most relevant in the whole state. All indicators of poverty, marginalization and inequality had been pointing upward since the 1980s, so the federal and state governments tried to compensate for the prevailing lag in these localities through the deployment of monetary resources. This can be seen in Figure 3 for Tierra Caliente region.
Figure 3. Gini Index for Tierra Caliente region 1980, 1990, 2000, 2015, and 2020
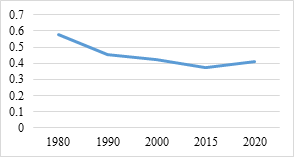
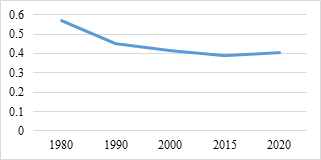
Bajío region significantly reduced wealth concentration between 1980 and 2020. Overall socioeconomic conditions in that region improved. This region is comprised of 17 municipalities, where almost 73% of all wealth was concentrated in a few hands in 1980. By 2020, this level of wealth concentration was reduced to just over 40% (see Figure 4).
Figure 4. Gini Index for Bajío region 1980, 1990, 2000, 2015, and 2020
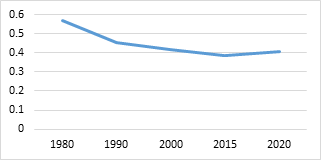
Cuitzeo region is one of the most efficient in the state. This is because it is home to the city of Morelia, the state capital. Morelia showed the lowest level of wealth concentration in 1980 with a little less than 50%. However, its Gini index was 40% by 2020, which differs significantly from the former. This municipality has a determining influence on the rest of the region’s towns; the regional average shows 41% for 2020, above the state average of 39% and very close to the national average of 42%. As seen in Figure 5, the region shows greater overall equality of income distribution from 1980 to 2020.
Figure 5. Gini Index for Cuitzeo region 1980, 1990, 2000, 2015, and 2020
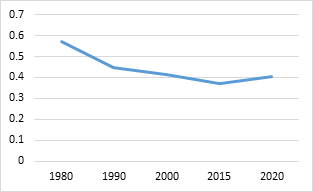
There has been a moderate recovery in income distribution in the Tepalcatepec region from 1980 to 2020. It contains municipalities with very intense socioeconomic activities and others that have remained stagnant in marginalization and poverty for many years. The region is made up of 10 municipalities; it showed a Gini index of 57% in 1980, and it dropped to 40% by 2020 (see Figure 6). This region remains above the state average. Some contrasts are also observed in this region; some municipalities have greater equality of income distribution, characterized by their wide agricultural productive capacity in strategic sectors; most of the country’s citrus and berries are produced in this region among other products of export quality to international markets. As for other municipalities, most of them are above the state average. The current state of affairs in this region has led illegal organizations to seize control over municipal territories. This region is in constant conflict due to disputes over localities where illegal drugs are produced.
Figure 6. Gini Index for Tepalcatepec region 1980, 1990, 2000, 2015, and 2020
Purepecha region shows a very slow advance in income distribution inequality especially in recent years (see Figure 7). The region is made up of 11 municipalities. Most municipalities exceeded 40% of wealth concentration, well above the state average. The historical isolation of some municipalities can be explained by their indigenous origin; it dates to the time of the conquest and has not yet been overcome, much less compensated for by governments along the years of study.
Figure 7. Gini Index for Purépecharegion 1980, 1990, 2000, 2015, and 2020
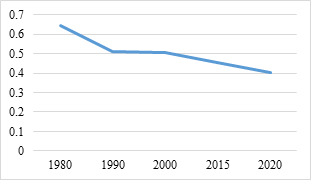
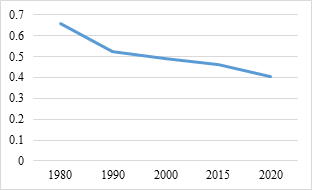
As seen in Figure 8, Patzcuaro-Zirahuen region shows a very slow recovery in wealth deconcentration between 1980 and 2020. It is composed of 7 municipalities. There has been a gradual recovery in the Gini index between 1980 and 2020, from 65% to 40% of income concentration. However, the region remains above the state average.
Figure 8. Gini Index for Patzcuaro-Zirahuen region 1980, 1990, 2000, 2015, and 2020
Lerma-Chapala region had a very high inequality of income distribution in 1980, but it had a significant overall recovery by 2020 (see Figure 9). It is made up of 17 municipalities, which presented a regional Gini index of 57% in 1980; this was reduced to 40% by 2020. All municipalities in this region have a very close relationship with the state of Jalisco as their socioeconomic activities are linked to the Lake Chapala and Colima micro-basin.
Figure 9. Gini Index for Lerma-Chapala region 1980, 1990, 2000, 2015, and 2020
Oriente region shows a slow recovery in income distribution between 1980 and 2020 (Figure 10). It is made up of 18 municipalities with an overall Gini index of almost 66% in 1980 and 40% in 2020. A very significant reduction in wealth concentration is observed in this region. Most municipalities showed a high lag in terms of income concentration, all above 40% on the Gini index.
Figure 10. Gini Index for Oriente region 1980, 1990, 2000, 2015, and 2020
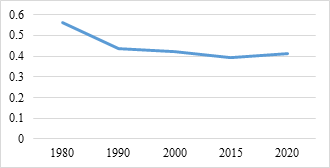
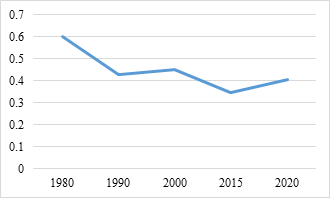
Figure 11 shows Coastal Region observed a very important recovery in the inequality of income distribution between 1980 and 2020. However, this is mainly explained by the activities in the port of Lázaro Cárdenas. The port is a development pole that has drawn significant national and international investment. However, the resultant socioeconomic spillover has not been efficiently dispersed among the rest of the localities around the port. Therefore, it is important to propose alternative public policy to promote a greater economic spillover among said localities in the coastal region of Michoacán. It is composed of seven municipalities; they all have been identified with high marginalization and poverty levels since 1980. For the years of study, the region went from almost 60% in wealth concentration to 40% on the Gini index.
Figure 11. Gini Index for Coastal region 1980, 1990, 2000, 2015, and 2020
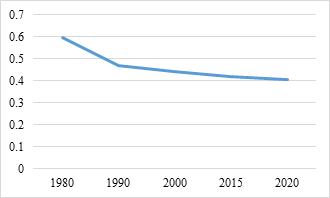
Infiernillo Region shows a significant recovery in income distribution between 1980 and1990, though the region remained stagnant in the subsequent years (see Figure 12). The region has only six municipalities; they all presented very high wealth concentration levels in 1980, around 60%. By 2020, the Gini index revealed that wealth concentration decreased to an average of 40% in the region. Almost the entire region is characterized by a similar average concentration index.
Figure 12. Gini Index for Infiernillo region 1980, 1990, 2000, 2015, and 2020
Michoacán’s 10 regions show notorious divergences in income distribution and poverty. However, all regions experienced changes across the analyzed period. Generally, 1980 was a year of high-income concentration in all regions, all of them showing a Gini index above 0.55 and even higher in Tierra Caliente and Bajío with figures above 0.70. This implied that most people were in poverty while only a small group retained most of the generated wealth.
The results show remarkable improvements in all 10 regions by 1990, more significantly in the Tierra Caliente and Bajío regions with a decrease to 0.53 and 0.55 respectively. This was a result of social programs implemented to improve the population’s socioeconomic conditions. Even so, they continued to be the two regions with the highest wealth concentration, slightly different from other regions such as Balsas and Pátzcuaro-Zirahuen. The Coastal and Purepecha regions registered the lowest concentration indexes with 0.42 and 0.43, respectively.
In the 2000 census, the Gini index reflected an irrelevant decrease in overall income concentration for the whole state. Tierra Caliente and Bajío were again the regions with the highest index; in the case of Tierra Caliente, the reduction was very small compared to the 1990 census. On the other hand, the Coastal region had registered one of the lowest indexes in 1990 but showed an increase in 2000, being the only region during the four study periods that presented this behavior. This could be related to the concentration of economic activities with greater growth, such as the production and commercialization of copra, mango, plantain, among others. Although these activities generate jobs, they tend to be poorly paid. Tepalcatepec and Lerma-Chapala regions had the lowest rates of wealth concentration.
The 2015 census was characterized by a general reduction in income concentration for all regions, although it was not very significant for most of them. The Coastal region experienced an increase in 2000; five years later, it registered the most significant decrease of all regions. This reverse on the Gini index could be due to having incorporated many new producers of various types and levels of income into more profitable and productive activities. All this caused the region to show the lowest wealth concentration level, followed by Lerma-Chapala and Cuitzeo, the latter being home to the state capital. Oriente Balsas, Pátzcuaro-Zirahuen and Bajío presented the highest rates for this census.
The 2020 census in Michoacán shows an increase in equality of income present a slight recovery. However, there is greater inequality in Cuitzeo, Lerma-Chapala and Coastal since they comprise municipalities with reduced income distribution instead of improved indicators. COVID-19 pandemic was in full development when the census data was being collected, which significantly reduced people’s incomes and jobs. The implementation of sanitary measures reduced the pace of economic activity in the state, the country, and the world.
It is worth noting that Tierra Caliente region experienced a more significant reduction than the rest of the regions during the years of study. Although it is still detected as the fourth region with the highest income concentration level, the progress is evident. It was ranked as the region with the highest concentration level in 1980 with an index of 0.75, and it reached a level of 0.40 in 2020. However, it must be noted that it is one of the least productive regions, so the concentration becomes lower by producing less. The Bajío has been positioned among the regions with the highest Gini index over the years. It is one of the regions with the highest economic activity, mainly agricultural, but also with the highest concentration in the sector.
Even though an overall reduction in wealth concentration was detected in all 10 regions, it proved significant and notorious for 1990 only. This reduction was much smaller in 2000 and 2020, so it remains insufficient as to denote better living conditions for the people. Wealth distribution in Michoacán continues to be unequal, above the national average.
4.1 Discussions
Most research have been studying the inequality income. Many of them focus on the study at the country level and analyze whether through fiscal redistribution they contribute to reducing inequalities [3, 8-11]. However, no studies were detected at the regional or local level. Likewise, they do not study the evolution of income distribution over four decades. The literature has referred to dissimilarities in preferences for redistribution.
In this article, we extend the literature focusing on inequalities [12-16]. However, unlike these studies, we analyze the evolution of income distribution to find out if inequalities have decreased over 40 years in the 113 municipalities of Michoacán stratified by the 9 regions.
This research, whose object of study is more local, can contribute to making more accurate decisions for policymakers, considering the characteristics and evolution that each municipality has presented and, in this way, they can generate a greater impact of social expenditure.
Michoacán is characterized by a heterogeneous wealth distribution on the regional scale. There was a strong recovery in the equality of income distribution from 1980 to 1990, but the subsequent progress was very slow and insignificant. This denotes an escalation in income concentration within the highest income tiers. Michoacán’s current fruitful economic activities do not translate into an equal wealth distribution.
Throughout these 25 years of study, all 10 regions have managed to reduce their wealth concentration levels. However, this is not enough to foster greater social welfare. The gaps are still many and very large; it is a matter of reducing regional inequalities and developing public policy proposals to analyze and weigh socioeconomic inequality in the context of regional development in Michoacán. It is urgent to promote a more just and equal society in addition to a more solid and stable economy. In this vein, prevention and mitigation measures should be proposed based on public policies and strategies to address these problems, whose roots can be traced.
Budget, tax, and spending policies can also be used to reduce inequality in Michoacán while promoting economic reactivation to end budget deficits. Such sources of increased revenues would not only contribute to a more efficient economy and substantially reduced deficit but would also downscale inequality. To stimulate investment, the focus must be on how to encourage demand more effectively. That would be achieved by putting more money in the pockets of people in the middle and bottom tiers.
This study measured inequality and wealth distribution levels in Michoacán’s 10 regions for 1980, 1990, 2000, 2015, and 2020. For future research, it is recommended to identify which regions contribute to reducing inequality of wealth distribution based on prosperous economic activities and GDP growth. It is also important to locate where economic growth may lead to greater concentration and to identify the prevailing socioeconomic condition across the social fabric, as well as the impact this has on the state’s overall socioeconomic situation.
The authors wish to acknowledge to INEGI for helping in providing the Censo de población y Vivienda 2020.
|
G |
Gini index |
|
X |
Cumulative proportion of the population variable |
|
Y |
Cumulative proportion of the income variable thermal conductivity, W.m-1. K-1 |
|
R |
The average income |
The “Index gini” and “Lorenz curve”, data that support the findings of this study are available in/from “Censo de población y Vivienda 2020” https://www.inegi.org.mx/programas/ccpv/2020/#Tabulados and https://www.inegi.org.mx/programas/ccpv/2020/#Microdatos.
[1] Perroux, F. (1984). El Desarrollo y la nueva concepción de la dinámica económica. p. 229. https://unesdoc.unesco.org/ark:/48223/pf0000184138.
[2] Sassen, S. (2001). ¿Perdiendo el control?: la soberanía en la era de la globalización.
[3] Guillaud, E., Olckers, M., Zemmour, M. (2020). Four levers of redistribution: The impact of tax and transfer systems on inequality reduction. Review of Income and Wealth, 66(2): 444-466. https://doi.org/10.1111/ROIW.12408
[4] Chauca, P., López, R. (2004). Reflexiones en torno a una política de investigación y desarrollo tecnológico para el desarrollo local. Realidad Económica, 19-26.
[5] Sen, A. (1999). Democracy as a universal value. Journal of Democracy, 10.
[6] Sen, A., Bravo, A.M., Schwartz, Pedro. (1999). Nuevo examen de la desigualdad. https://books.google.com/books/about/Nuevo_examen_de_la_desigualdad.html?hl=es&id=hzBeL38uGTMC.
[7] Formichella, M. (2005). Innovación del concepto de desarrollo y su relación con el desarrollo.
[8] Wang, C., Caminada, K., Goudswaard, K. (2014). Income redistribution in 20 countries over time. International Journal of Social Welfare, 23(3): 262-275. https://doi.org/10.1111/IJSW.12061
[9] Kambayashi, R., Lechevalier, S. (2022). Why do redistributive policies differ across countries? Analyzing the multiple dimensions of preferences for redistribution. Review of Income and Wealth, 68(4): 1032-1057. https://doi.org/10.1111/ROIW.12541
[10] Caminada, K., Goudswaard, K., Koster, F. (2012). Social income transfers and poverty: A cross-country analysis for OECD countries. International Journal of Social Welfare, 21(2): 115-126. https://doi.org/10.1111/J.1468-2397.2011.00815.X
[11] Martorano, B. (2018). Taxation and Inequality in developing countries: Lessons from the recent experience of Latin America. Journal of International Development, 30(2): 256-273. https://doi.org/10.1002/JID.3350
[12] Attanasio, O., Hurst, E., Pistaferri, L. (2014). The evolution of income, consumption, and leisure inequality in the United States, 1980-2010. In Improving the Measurement of Consumer Expenditures, pp. 100-140.
[13] Benjamin, D., Brandt, L., Giles, J. (2005). The evolution of income inequality in rural China. Economic Development and Cultural Change, 53(4): 769-824. https://doi.org/10.1086/428713
[14] Gini, C. (1921). Measurement of inequality of incomes. The Economic Journal, 31(121): 124-125. https://doi.org/10.2307/2223319
[15] Guillén, A. (2007). La teoría latinoamericana del desarrollo Reflexiones para una estrategia alternativa frente al neoliberalismo**.
[16] Lorenz, M.O. (1905). Methods of measuring the concentration of wealth. Publications of the American Statistical Association, 9(70): 209. https://doi.org/10.2307/2276207