Fredy Sumasto*![]() | Deanisa Amara Arliananda
| Deanisa Amara Arliananda![]() | Febriza Imansuri
| Febriza Imansuri![]() | Siti Aisyah
| Siti Aisyah![]() | Indra Rizki Pratama
| Indra Rizki Pratama![]()
© 2023 IIETA. This article is published by IIETA and is licensed under the CC BY 4.0 license (http://creativecommons.org/licenses/by/4.0/).
OPEN ACCESS
This research aims to enhance the quality of automotive components by employing fault tree analysis (FTA) to identify root causes and implement improvements. The FTA method was applied within an Indonesian automotive component manufacturing company specializing in producing Part Stay Protector A Comp. This component is a critical linkage point between exhaust systems and vehicle end caps, playing a crucial role in maintaining vehicle safety and performance. The data analyzed in this study, which led to the root cause determination, primarily originated from customer claims. Among these claims, a notable concern was the off-centre hole in Part Stay Protector A Comp, reflecting one of the Critical To Quality (CTQ) characteristics, with 689 instances of non-conformance. A comprehensive improvement strategy was initiated after identifying root causes through FTA. Utilizing the minimal cut sets (MCSs) method, the analysis underscored that the primary contributor to the fault was identified as (B2) Jig Detection, a critical component within the production process. The Jig Detection system serves as a quality control mechanism, verifying the alignment and conformance of the Part Stay Protector A Comp during production. This strategy focused on minimizing errors in the production method and enhancing the standardization of cup and spot tip classifications to reduce the occurrence of off-centre hole defects. The primary root cause, (B2) Jig Detection, was addressed through an innovative approach that included additional training for labour and introducing a stopper within the Inspection Jig for the Stay Protector A Comp. This strategic enhancement aimed to empower the Inspection Jig to detect off-centre defects, mitigating the recurrence of such issues. Simultaneously, addressing the issue of the non-standardized cup and spot tip usage classifications aimed to reduce the likelihood of off-centre hole defects reoccurring. The results of these improvements were systematically monitored and controlled over six months, demonstrating a significant reduction in non-centre hole defects. The subsequent results of these improvement efforts profoundly impacted product quality, ultimately reducing the count of off-centre hole defects from 689 to zero, thereby upholding the highest standards in automotive component quality.
automotive part, fault tree analysis, minimal cut sets, quality
The automotive manufacturing industry is a cornerstone of the Indonesian economy, shaping a fiercely competitive landscape where industry players strive relentlessly to deliver top-quality products [1]. The importance of this endeavour extends beyond economic considerations, as products distinguished by their exceptional quality and competitive pricing not only ensure customer satisfaction [2-6] but also underpin strategies for both national and international competitiveness [7, 8]. The quest for products to seamlessly blend quality and cost-efficiency is an intricate challenge.
While pursuing quality and cost-efficiency pervades the industry, the manufacturing process necessitates a strategic approach to curtail errors within the production line [9, 10]. This strategic focus seeks to produce goods without defects [11, 12] while judiciously selecting affordable, high-quality raw materials. Among the crucial players in this process is the production department, which optimises productivity and quality and relies heavily on skilled labour, well-maintained machinery, and superior raw materials to minimise defect rates [4].
The manufacturing sector, however, is not immune to the risk of producing high-defect items [6, 13-15] that may inadvertently find their way into customers' hands, incurring significant time and financial losses. This predicament assumes a tangible form at BMI, Ltd., where a concerning customer claim arises from YMI, Ltd., a valuable client of BMI, Ltd. Specifically, this claim pertains to the Stay Protector A Comp type K84A component. Stay Protector A Comp type K84A is a part used as a holder for the exhaust, functioning as a connecting part between the exhaust and the exhaust cover.
In this context, the significance of this issue takes centre stage. BMI, Ltd. is compelled to address this matter urgently, necessitating the recall and replacement of older lots with those subjected to rigorous 100% re-sorting. This measure encompasses additional costs and the deployment of personnel for on-site re-sorting at the customer's premises, resulting in time and financial losses. The repercussions extend beyond mere monetary constraints; the trust of YMI, Ltd. teeters on the edge, with the potential for future collaborations hanging in the balance. A continued influx of defective goods risks eroding consumer confidence, jeopardizing YMI, Ltd.'s reliance on BMI, Ltd. for component production.
In a concerted effort to surmount these challenges, BMI, Ltd. has set its sights on curtailing quality costs and preempting customer claims. This study adopts the fault tree analysis method, offering a structured examination of various event combinations stemming from product claims, intending to isolate critical outcomes and mitigate the impact of quality lapses in the manufacturing process [16-18], with a specific focus on the Part Stay Protector A Comp.
2.1. Summary claim customer dan bar diagram
In this study, the object determined to analyze the root of the problem is Part Stay Protector A Comp. Object determination is based on the highest number of customer claims from January to June 2022. This data can be in the form of reports of accidents or damage to stamping machines produced by the company. Furthermore, researchers can conduct observations and interviews with experts in the stamping machine field to understand the production process, machine specifications, and risk factors that might affect the safety and quality of the stamping machine [16, 18-20]. Data is collected based on the history of customer claims and the stay protector. The data used is history data from the daily inspection data of the final inspection process and mapped using a bar diagram. The data is analyzed based on errors made by the final inspection operator and the previous process, namely the spot welding operator. From the results of analysis and experiments following the activities carried out by the final inspection operator, several possible events caused the delivery of defective products to the customer.
2.2. Defect identification
CTQ is used to identify product or service characteristics that significantly impact customer satisfaction and the fulfilment of established quality standards [14, 21]. In the context of this research, it is necessary to identify the CTQ characteristics that most affect customer satisfaction and quality standards related to the Stay Protector A Comp product. CTQs become the foundation for finding root causes based on critical and driver needs. This research also uses Pareto Chart to analyze defect data and identify defects that significantly impact product quality. Defect identification allows the researcher to focus on the primary defects that must be addressed.
2.3. Fault tree analysis
After collecting data and understanding the production process, research can begin by conducting a FTA [17] using the TopEvent FTA software and minimal cut sets method. FTA is an analytical method used to identify factors contributing to accidents or damage in a system. In this case, FTA can help the company identify the root cause of the 16 consumer claims. The identification or analysis of the most significant claims to be analyzed is based on the number of defective parts sent to the customer; the more defective parts sent, the more the product will be identified because there must be a product error that has been considered following the standard, but in fact, the product is identified by the customer as defective. However, not all claims were identified in this study, and only the most significant claims were analyzed further.
In the FTA process, a tree describes the relationship between the safety and quality risk factors [16, 22] of Part Stay Protector A Comp. This FTA tree consists of several levels, from the final event (e.g., machine failure) to the causal factors or roots of the event. In explaining the process of identifying and analyzing the most significant claims, this study uses specific criteria to determine which claims will be analyzed further. These criteria involve the number of defective parts delivered to customers, so the claims identified are the most significant regarding their impact on customers and the number of defective products. This criterion provides a strong foothold for focusing on the most significant issues and prioritizing corrective actions. After identifying the root cause of the most significant claim received, the company can improve the production process and increase the safety and quality of the stamping machines produced. The corrective measures included improvements in the production process and enhancements to the safety and quality of the stamping machines. These measures included improvements in machine maintenance, further operator training, increased quality control during the production process, and improvements in product design. All these measures were designed to reduce the risk of failure and improve the overall safety performance and product quality.
3.1 Data analysis
BMI, Ltd. as an industry player in the field of providing automotive products for stamping machine products, has many obstacles in meeting customer needs and satisfaction. One of the obstacles faced is producing goods that are not 100% OK, or it can be said that BMI, Ltd. is still far from the company's target of zero defects in each production activity. Defective goods found at BMI, Ltd cannot be repaired and can be corrected with a product repair process. However, if defective goods are found at the customer, of course, this can reduce the feeling of satisfaction and consumer confidence in BMI, Ltd. As found in BMI, Ltd., within six months, there were several Claim Reports from Customers aimed at BMI, Ltd. due to sending goods that did not comply with specifications/defective products Table 1.
Table 1. Summary of claim customer
|
Part Name |
Month Claimed |
Quantity of Delivery (Pcs) |
Quantity of Defect (Pcs) |
Problem |
|
Bracket No.2 Seat Leg |
January 2022 |
4626 |
200 |
Rusty |
|
Clamper Throttle |
February 2022 |
4,000 |
5 |
Minimum Gap |
|
Stay Protector A Comp |
February 2022 |
2,353 |
726 |
Hole Not Centred |
|
Bracket Seat Track |
February 2022 |
2,200 |
360 |
Burry |
|
Bracket E55 |
March 2022 |
1,600 |
400 |
Rusty |
|
Nut Clip |
March 2022 |
8,000 |
3 |
No Threads |
|
Plate Tensioner |
March 2022 |
1,000 |
100 |
Burry |
|
Handle Assy |
March 2022 |
500 |
12 |
Painting NG (Not Good) |
|
Socket Holder |
April 2022 |
8,000 |
20 |
rusty |
|
Stay Muffler |
April 2022 |
2,500 |
2 |
Hole Not Centred |
|
Flange Rear |
April 2022 |
504 |
2 |
Bolts Off |
|
Gear Box |
April 2022 |
1,100 |
10 |
No Holes |
|
Bracket Apar |
May 2022 |
400 |
145 |
Foot Long Side |
|
Washer U |
June 2022 |
2,000 |
200 |
Part is not Flat |
|
Bracket S/T LWR RR |
June 2022 |
500 |
4 |
Dent |
|
FLG FLEX |
June 2022 |
300 |
1 |
Chill |
Based on Table 1, it can be seen that within six months, BMI, Ltd. obtained 16 Customer Claims for several products that were sent in a defective condition and were found internally by several customers from BMI, Ltd. After getting a Customer Claim History at BMI, Ltd. will then make a bar chart to find out the highest quantity of defective products sent to customers because the defective products sent with the highest quantity have a higher urgency to be used as an evaluation of production activities at BMI, Ltd.
3.2 Defect identification
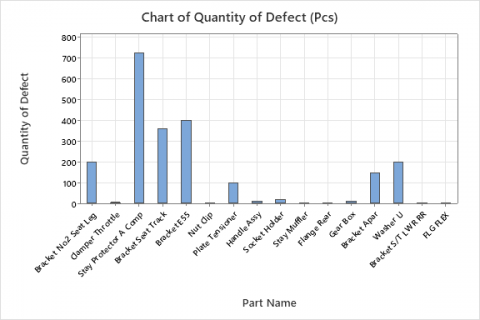
Figure 1 visually represents a bar chart based on the History Claims table. Based on this, it can be concluded that within six months, the most defective products from customer claims were the Stay Protector A Comp type K84A product produced in the February lot where 726 Pcs were found which were sent to YMI, Ltd. with products that have no centre holes and Berets. Therefore, data collection focused on the product Stay Protector A Comp K84A. YMI, Ltd. is a customer of BMI, Ltd. and certainly desires that the product received or sent by the supplier has specifications that follow the initial production standards. The product sent does not have the slightest defect. However, in the actual situation, a defective product was sent by BMI, Ltd. to YMI, Ltd.
Figure 1. Bar diagram of history claim
Figure 2. Critical To Quality
Figure 2 shows CTQ Defective conditions found from the sorting results. CTQ is a quality element or characteristic of a product or service that significantly impacts customer satisfaction or meets established quality standards. CTQ factors must be met very well for the product or service to be considered quality by the customer. Identification and understanding of CTQs are essential to improve quality and customer satisfaction.
In determining the manufacture of CTQ based on the findings of defective products from direct sorting results at YMI, Ltd. by sorting operator BMI, Ltd. Next, a Pareto Diagram will be made to determine the cause of the most significant defects in the Stay Protector A Comp product. The data used in analysing the causes of defects in Stay Protector A Comp customer claims is the number of defective products found at YMI, Ltd. Table 2 shows data on defective product findings.
Table 2. Defective product findings data
|
Product Name |
Sorted Defect by |
Total of Sorted (Pcs) |
Type of Defects |
Total of Product Defect (Pcs) |
|
|
Hole Not Centred |
Scratch |
||||
|
Stay Protector A Comp |
YMI, Ltd. |
818 |
2 |
0 |
2 |
|
BMI, Ltd. |
1,535 |
687 |
37 |
724 |
|
|
Total |
2,353 |
689 |
37 |
726 |
|
Based on Table 2., the next step is to calculate the damage value in the form of cumulative defect and map in the Pareto Chart. The result of calculations from the data on the findings of defective products at YMI, Ltd. After calculating the cumulative number of defects, a Pareto diagram is then made to find out more clearly the comparison of the highest number of defects sent by BMI, Ltd. Figure 2 shows the Pareto Chart of Stay Protector A Comp.
Figure 3. Pareto chart of defect in Stay Protector A Comp
Based on Figure 3, off-centre holes have the highest frequency of defects, and the cause of their occurrence must be sought. Defects sent with up to 689 Pcs are detrimental to both parties. From the supplier side, of course, when that many defects are found, you have to incur additional costs to send people to do the sorting directly to YMI, Ltd, as well as increasing production costs for product repairs or wasting production costs because products cannot be reused.
3.3 Root cause analysis
In the root cause analysis stage, it is essential to understand how customer claims affect the production process and customer satisfaction. Significant claims not only reduce the level of customer satisfaction but can also disrupt the production flow as the product must be replaced before proceeding to the next stage.
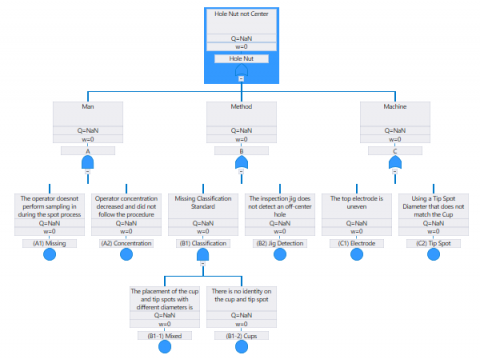
In this context, FTA was used to identify the root cause of the problem. Identifying common factors that could contribute to the problem of off-centre holes was done. Once the common factors are identified, the next step is identifying the essential events underlying the problem. Figure 4 shows the results of the fault tree analysis for the "not-centred hole" problem in the Stay Protector A Comp product. Each basic event and intermediate event is named to facilitate the calculation of their respective weight values. The most significant weight value indicates the leading root cause that must be fixed immediately.
With this approach, FTA was used to analyze the root cause of the "Hole Not Centred" problem in Stay Protector A Comp products in the initial condition before improvement. This analysis provided a solid foundation to identify the key factors affecting this defect so that appropriate improvements could be implemented to improve product quality significantly.
Figure 4. Fault tree analysis of the highest defect
Table 3. Probability of events per month for each basic event
|
Basic Event |
Events Per Month |
Probability Per Month |
|
A1 |
2 |
0.067 |
|
A2 |
1 |
0.033 |
|
B1-1 |
9 |
0.300 |
|
B1-2 |
9 |
0.300 |
|
B2 |
6 |
0.200 |
|
C1 |
1 |
0.033 |
|
C2 |
2 |
0.067 |
|
Total |
30 |
1 |
Table 3 shows the probability of occurrence of each basic event from the hole nut not centred down to the basic event to find the root cause. The explanation of the basic events obtained is as follows:
3.4 Minimal cut set of FTA
The next stage is a qualitative analysis with the Classical MCS method. The MCSs of a fault tree Figure 5 are obtained by traditional Boolean algebra. The Classical MCS method handles the negates of non-coherent fault trees with a delete-term operation. The probabilities are calculated utilizing MCSs. Calculating exact probabilities utilizing MCSs is typically impractical, so the Classical MCS method is based on rare event approximation of the unavailability and importance factors. The rare event approximation is adequate when the basic event's failure probabilities are small. The result of MCSs of a fault tree based on mission time for six months shows the greatest unavailability on (B2) Jig Detection Table 4.
Figure 5. Fault tree based on minimal cut sets
Table 4. Hole nut-minimal cut sets
|
Minimal Cut Set |
Order |
Unavailability |
Contribution |
|
(B2) Jig Detection |
1 |
0.698805788 |
0.355510173 |
|
(B1-1) Mixed Placement. (B1-2) Cups identity |
2 |
0.696725946 |
0.354452075 |
|
(C2) Tip Spot mismatch |
1 |
0.331019254 |
0.168402601 |
|
(C1) Electrode |
1 |
0.179630147 |
0.091384968 |
|
(A1) Missing Sampling. (A2) Concentration decreased |
2 |
0.059461037 |
0.030250184 |
3.5 Discussion
Based on Table 4, Jig Detection is the highest weighted value that causes defects because the inspection Jig does not detect an off-centre hole. Improvements are made according to the root cause of the problem. The leading root cause of the problem is that the inspection Jig does not detect an off-centre hole. Improvements made are minimizing errors in the method and improving classification standards for the use of cups and tip spots to minimize repeated errors that will occur in the process method.
Table 5. Improvement on Stay Protector A Comp
|
Condition |
|
|
Before Improvement |
After Improvement |
|
There is no stopper on the Inspection Jig yet |
There is already a stopper on the Inspection Jig |
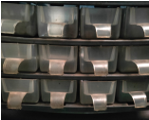
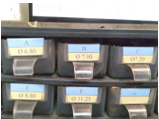
Table 6. Comparison improvement on Stay Protector A Comp
|
No |
Before Improvement |
After Improvement |
|
1 |
||
|
There is no product list with the specified code yet |
A list of codes for each cup and tip spot is made according to the diameter and the product that uses it |
|
|
2 |
|
|
|
There is no model code on the body cup and tip spot |
The model code is made in accordance with the standard code list that has been made |
|
|
3 |
|
|
|
The storage rack does not have an identity according to the model and diameter of the tip spot |
Provision of identity on storage racks so that operators can place cups and tips according to classification standards |
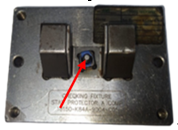
The root cause of the problem is that the hole is not centred. The inspection Jig cannot detect products with an off-centre hole defect. Based on this, an improvement was made by adding a stopper in the Inspection Jig on the Stay Protector A Comp product so that the Inspection Jig can detect off-centre defects in the future. Table 5 shows the improvements made to Stay Protector A Comp.
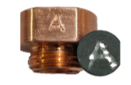
Furthermore, improvements were made to the problem of no standard classification for using cups and tip spots. The basic event is placing the cup and tip spot with different diameters mixed, and there is no identity on the cup and tip spot. Even though the percentage value is insignificant, improvements are also made because it has a significant enough number of events. If repairs are made, it minimizes the potential for non-centred defect holes to return Table 6. The results of the improvements that were carried out were controlled and monitored from July to December 2022. These results show a decrease in non-centre claim defect holes from 689 to 0.
The findings of this study identified that the leading root cause of the off-centre hole defect in Stay Protector A Comp products was the Jig Detection system that could not detect products with off-centre hole defects. Similarly, a study in mining [17], identified the problem of workplace accidents and contributing factors. This evidence shows that root cause analysis is a helpful tool to identify the underlying factors of problems in various contexts, be it in production or workplace accidents. This study used FTA for root cause analysis before improvement. Likewise, a study in public transport [23] used fault tree analysis to evaluate factors contributing to road accidents. Studies in Urban Mass Rapid Transit [24] also applied fault tree analysis to generate safety risk models. This evidence shows that FTA is a tool that can be applied in various contexts to identify the root causes of problems.
The results of this study led to improvement efforts by adding a stopper to the Inspection Jig to detect off-centre hole defects. Similarly, the study in risk assessment of fatal accidents [25] identified several fatal causes of fall accidents found in the construction industry and suggested proactive corrective actions to address these issues. This evidence shows that root cause analysis results are often used as a basis for developing better corrective actions. In the context of comparison, the results of this study focus on improvements in the production process and reducing defects. In contrast, those in public transport [23] and Urban Mass Rapid Transit [24] focus more on risk management in public transportation and train operations. Studies in mining [17] evaluated workplace accidents in the context of improved procedures and management, while those in healthcare [22] focused on implementing 5S management in hospitals. This evidence shows that root cause analysis can be applied in a variety of contexts to identify and address specific problems.
In this comparison, root cause analysis is an effective tool for identifying and understanding the root causes of problems in various environments, be it production, transportation, workplace, or hospital management. The implication is that improvements and proactive measures can be taken based on the findings from root cause analysis to improve quality, safety, and efficiency in various sectors.
Based on the results of the analysis that has been carried out at BMI, Ltd., it can be concluded that the Stay Protector A Comp product with a hole not centred is the product sent with the highest defect within six months to YMI, Ltd. has as many as 726 pcs from a lot of 2,353 pcs. The highest defect was in the Stay Protector A Comp product, namely the hole not centred, with a total defect of 689 pcs when presented, it was 95%, and the lowest defect was a defect in the form of a beret on the material with a percentage of 5%. Customer Claims YMI, Ltd. on the Stay Protector A Comp product with a hole not centred as the highest defect can be caused by several factors.
Fault tree analysis is used to find out the root causes of problems that affect the occurrence of off-centre holes after analyzing by calculating the weight of each basic event that can cause the hole not to be centred. It is found that the causal factors generally have the most significant value, namely the method with a presentation of 29% of 49%. From this method, there is one basic event/root cause of the error in the method which causes the product to have a non-centred defect hole, namely, the Inspection Jig cannot detect a non-centred defect hole with a percentage of 20% of 29% and two basic events which have a percentage of 9% but participation is carried out repairs as an effort so that 29% percentage of errors in the method can be eliminated.
The improvements made were adding a stopper to the inspection Jig, making a standard classification for using cups and tip spots according to the diameter and providing identification on storage racks and the tip spot body. The results of improvement to non-centre claim defect holes from 689 to 0. This result shows that the improvements made significantly impact the product quality of Stay Protector A Comp.
Future research could focus on evaluating the long-term impact of the implemented improvements on Stay Protector A Comp's quality and defect rates. A longitudinal study could track product quality and defect rates over an extended period to determine the sustainability of the improvements and whether any new issues or variations arise over time. Besides that, investigating the financial implications of the improvements would be valuable. Analyzing the costs associated with implementing the changes, including labour, materials, and equipment modifications, and comparing them to the savings from reduced defects and customer claims would provide insights into the cost-effectiveness of these improvements. Based on the findings, the use of fault tree analysis can be used in other studies to trace the defects of a collection of interconnected objects to obtain improvement priorities based on the most significant weight of a failure event in the automotive industry and other industries.
[1] Silalahi, S.A.F. (2014). Kondisi industri manufaktur indonesia dalam menghadapi globalisasi. Jurnal Ekonomi & Kebijakan Publik, 5(1): 1-13. http://dx.doi.org/10.22212/jekp.v5i1.149
[2] Amini, D.K., Wiranatakusuma, D.B. (2020). The influence of service quality, price, corporate image, and location towards customer satisfaction on Autocare Universitas Muhammadiyah Yogyakarta. Journal of Economics Research and Social Sciences, 4(1): 30-43. https://doi.org/10.18196/jerss.040117
[3] Razak, I., Nirwanto, N., Triatmanto, B. (2016). The impact of product quality and price on customer satisfaction with the mediator of customer value. IISTE: Journal of Marketing and Consumer Research, 30: 59-68. https://eprints.unmer.ac.id/id/eprint/334/iiste.org/Journals/index.php/JMCR/article/view/34735.
[4] Sumasto, F., Satria, P., Rusmiati, E. (2022). Implementasi pendekatan DMAIC untuk quality improvement pada Industri Manufaktur Kereta Api. Jurnal INTECH Teknik Industri Universitas Serang Raya, 8(2): 161-170. https://doi.org/10.30656/intech.v8i2.4734
[5] Sumasto, F., Imansuri, F., Agus, M., Wirandi, M. (2020). Sustainable development impact of implementing electric taxis in Jakarta: A cost-benefit analysis. In IOP Conference Series: Materials Science and Engineering, IOP Publishing, 885(1): 012027. https://doi.org/10.1088/1757-899X/885/1/012027
[6] Rękas, A., Kurek, M., Latos, T., Milczanowska, K. (2015). Implementation of FMEA into mass production process to identify and eliminate causes of defects. Key Engineering Materials, 641: 266-277. https://doi.org/10.4028/www.scientific.net/KEM.641.266
[7] Mantrala, M.K., Seetharaman, P.B., Kaul, R., Gopalakrishna, S., Stam, A. (2006). Optimal pricing strategies for an automotive aftermarket retailer. Journal of Marketing Research, 43(4): 588-604. https://doi.org/10.1509/jmkr.43.4.588
[8] Stylidis, K., Wickman, C., Söderberg, R. (2015). Defining perceived quality in the automotive industry: An engineering approach. Procedia CIRP, 36: 165-170. https://doi.org/10.1016/j.procir.2015.01.076
[9] Giri, R., Mishra, A.K. (2021). Rejection minimization through lean tools in assembly line of an Automotive Industry. In Advances in Industrial and Production Engineering: Select Proceedings of FLAME. Springer Singapore, 2020: 255-266. https://doi.org/10.1007/978-981-33-4320-7_24
[10] Karthik, M, Halesh, S.B., Hanumanthrayagouda, M.B. (2019). Reducing the rejection & improving productivity of Pistons. International Journal of Innovative Science and Research Technology, 4(1): 81-85.
[11] Nallusamy, S., Nivedha, R., Subash, E., Venkadesh, V., Vignesh, S., Vinoth Kumar, P. (2018). Minimization of rejection rate using lean six sigma tool in medium scale manufacturing industry. International Journal of Mechanical Engineering and Technology, 9(1): 1184-1194.
[12] Sumasto, F., Nugroho, Y.A., Purwojatmiko, B.H., Wirandi, M., Imansuri, F., Aisyah, S. (2023). Implementation of measurement system analysis to reduce measurement process failures on Part Reinf BK6. Indonesian Journal of Industrial Engineering & Management. 4(2): 212-220. https://doi.org/10.22441/ijiem.v4i2.20212
[13] Xiuli, L., Baozhi, C., Hanqing, X. (2012). Study on principle of product defect identification. Procedia Engineering, 43: 393-398. https://doi.org/10.1016/j.proeng.2012.08.068
[14] Lucky, B.O., Takim, S. (2015). Manufacturing defects in the automobile industry, a case study of the remote causes and effects of Toyotas transmission malfunctions in cars. International Journal of Engineering and Applied Sciences, 2(8): 257854.
[15] Kania, A., Cesarz-Andraczke, K., Odrobiński, J. (2018). Application of FMEA method for an analysis of selected production process. Journal of Achievements in Materials and Manufacturing Engineering, 91(1): 34-40. https://doi.org/10.5604/01.3001.0012.9655
[16] Pontororing, P.P., Gilbert, S., Andika, A. (2019). Welding products defects analysis with fault tree analysis and failure modes and effects analysis. In Proceeding, 1(1): 35-48.
[17] Idiyanto, B., Surya, A. (2021). Implementation of fault tree analysis techniques to reduce work accidents in the department of Rebuild Center PT. X. Jurnal Terapan Tekniik Mesin, 2(April): 17-26.
[18] Nurwulan, N.R., Veronica, W.A. (2020). Implementation of failure mode and effect analysis and fault tree analysis in Paper Mill: A case study. Jurnal Rekayasa Sistem Industri, 9(3): 171-176. https://doi.org/10.26593/jrsi.v9i3.4059.171-176
[19] Purba, J.H., Deswandri, D. (2018). The implementation of importance measure approaches for criticality analysis in fault tree analysis: A review. Jurnal Pengembangan Energi Nuklir, 20(1): 1-7. http://dx.doi.org/10.17146/jpen.2018.20.1.4257
[20] Arohman, A.W., Agustin, D., Sudrajat, H., Agus, M., Solihin, S., Akbar, M.R. (2022). Design and analysis of static stress on hydraulic table dies replacement. In 2022 IEEE 8th International Conference on Computing, Engineering and Design (ICCED), Sukabumi, Indonesia, pp. 1-5. https://doi.org/10.1109/ICCED56140.2022.10009919
[21] Pereira, A.M., Silva, M.R., Domingues, M.A., Sá, J.C. (2019). Lean six sigma approach to improve the production process in the mould industry: A case study. Quality Innovation Prosperity, 23(3): 103-121. https://doi.org/10.12776/qip.v23i3.1334
[22] Sholihah, Q., Kelvin, S.P., Kuncoro, W., Irianto, C., Setyanto, N.W., Rahman, A. (2020). Analysis 5S implementation of management system using fault tree analysis (FTA) method. International Journal of Advanced Science and Technology, 29(5): 1534-1538.
[23] Yaghubpour, Z., Esmaeily, L., Piran, H.R., Behrad, A. (2016). Public transport risk assessment through fault tree analysis (FTA) case study: Tehran municipal district 1. Bulletin de la Société Royale des Sciences de Liège, 85: 1039-1048. https://doi.org/10.25518/0037-9565.5847
[24] Nguyen, T.H.A., Trinckauf, J., Luong, T.A., Truong, T.T. (2022). Risk analysis for train collisions using fault tree analysis: Case study of the Hanoi urban mass rapid transit. Urban Rail Transit, 8(3-4): 246-266. https://doi.org/10.1007/s40864-022-00181-y
[25] Zermane, A., Tohir, M.Z.M., Baharudin, M.R., Yusoff, H.M. (2022). Risk assessment of fatal accidents due to work at heights activities using fault tree analysis: Case study in Malaysia. Safety Science, 151: 105724. https://doi.org/10.1016/j.ssci.2022.105724