Moadh Kichene![]() | Amine Boudghene Stambouli
| Amine Boudghene Stambouli![]() | Aisaa Chouder
| Aisaa Chouder![]() | Abdelouadoud Loukriz
| Abdelouadoud Loukriz![]() | Ahmed Bendib*
| Ahmed Bendib*![]() | Hafiz Ahmed
| Hafiz Ahmed![]()
© 2023 IIETA. This article is published by IIETA and is licensed under the CC BY 4.0 license (http://creativecommons.org/licenses/by/4.0/).
OPEN ACCESS
This paper investigates the performance of a large-scale 20 MW photovoltaic (PV) plant in Ain El-Melh, Algeria. The evaluation is based on experimental data collected from January to December 2019. The PV plant consists of 40 sub-fields with 500 kW inverters and 1936 PV modules of 250 Wp each. Performance parameters including output energy, module temperature, final yield, module/system efficiencies, performance ratio (PR), corrected PR, and other loss-related indicators are assessed. The study focuses on the unique high plateau climate conditions (HPCC) in Algeria and their relevance to large-scale grid-tied PV plants. The high plateau climate is characterized by specific environmental factors such as temperature fluctuations, high altitude, and variations in solar irradiance. These factors play a crucial role in determining the performance of large-scale grid-tied PV plants in this region. In this study, the CR1000X monitoring device is employed to capture the environment’s data, while the NARI SJ-30 monitoring system collects electrical data. During this study, the main environmental factors, such as temperature, radiation, wind speed, precipitation, and relative humidity, which may affect the PV plant's efficiency are considered to assess the PV system's performance. The results show that the PV plant supplied 827.9 MWh to the grid in 2019. The final yield ranged from 3.99 h/day in December to 5.897 h/day in April, and the PR varied from 64.8% to 79.34%. The annual capacity factor ranged from 16.65% to 24.57%. A soiling effect of 4.8% on the performance ratio was observed in a selected subfield. The findings are valuable for researchers, investors, and policymakers involved in PV projects in similar climates, advancing renewable energy utilization.
photovoltaic installations, performance evaluation, final yield, performance ratio, annual capacity facto, loss calculation, soiling effect evaluation
In recent years, energy consumption has increased considerably and is expected to double by 2060 [1, 2]. Therefore, due to the increasing demand for energy and global climate change, renewable energy is being promoted as a new policy [2-6]. Furthermore, given the rapidly changing global energy context, marked by a decline in conventional fossil fuels and a steady increase in greenhouse gas emissions, the development of renewable energy remains the most effective way to preserve the planet. Among all the renewable energy technologies, solar photovoltaic (PV) is of particular interest to Africa, as it has a solar deposit favorable to the development of this form of energy. For example, the Conference of the Parties to the Paris Agreement obliges signatory countries and companies to achieve the sustainable development goals that each has set for itself by 2030 [7].
The Algerian Republic has embarked on the path of renewable energy sources (RES) to offer global and sustainable solutions to environmental challenges and the issues of preserving fossil energy resources, via the launch of an ambitious renewable energy development program – adopted by the government in February 2011, revised in May 2015, and made a national priority in February 2016. The updated renewable energy program foresees the installation of around 22,000 MW of renewable energy by 2030 for the domestic market, with the strategic objective of exporting if market conditions allow. The Algerian authorities, like other developing countries, have developed the "National Program for Renewable Energy and Energy Efficiency" which constitutes the first concrete step towards sustainable development. In a national context, the objective of the Algerian plan is to achieve 40% of the country's electricity needs based on renewable energy sources before 2030 [8]. With its large solar coverage, which represents 90% of the country's surface area (2,382 million km²), Algeria is committed to exploiting the majority of its renewable energy sources through solar photovoltaic (PV) energy. Given that the annual irradiation is estimated to be 3000 hours and the daily energy is up to 5 kWh/m². Algeria hopes to become a major actor in electricity production through renewable energies, based on PV and wind energy, as well as biomass, cogeneration, geothermic, and solar thermal energy. Indeed, these energy sectors will be the driving force behind sustainable economic development able to stimulate a new economic growth model. In 2030, more than 37% of the installed capacity and 27% of the electricity production for national consumption will be of renewable origin. Insofar as the national renewable energy potential is strongly dominated by solar energy, Algeria considers this energy as a potentiality and a means of economic and social development. Renewable energy projects for electricity production destined for the national electricity market will be carried out in two main phases [9]:
·Phase one 2015-2020: 4010 MW of PV and wind power, and 515 MW of biomass, cogeneration, and geothermal power will be developed in this phase.
·Phase two 2021-2030: The implementation of the electricity grid interconnection between the North and the Sahara, allowing the installation of important RnE stations in In-Salah, Adrar, Timimoune, and Bechar regions, as well as their integration in the national electricity grid system. By then, it could be economically viable to use solar thermal energy.
The renewable energy programs to be realized for the national market during the period 2015-2030 have a consistency of 22,000 MW [9].
Aligned with international commitments, Algeria's energy policy focuses on sustainable development and climate change goals. As a Paris Agreement signatory, it aims to reduce greenhouse gas emissions and boost renewable energy integration by 2030. Regionally, Algeria supports the African Union's ambitious targets for renewable energy deployment, harnessing solar, wind, biomass, cogeneration, geothermic, and solar thermal resources to advance the regional trend of renewable energy development in Africa.
In the context of the development of large-scale PV electricity production, ground-based solar power plants are relevant. They are being developed all over the world. Moreover, when these plants are located in arid zones where the external stresses are diverse (heat, humidity, salinity, dust) and severe, there is no reliable model to predict instantaneous electricity production. In addition, under such conditions, PV systems are subject to accelerated aging compared to installations in temperate climates. So, it is possible to generate a certain range of power based on standard test conditions (STC) with a PV power plant. In reality, the performance rarely matches the expected power output. Low production is largely explained by shadow penetration, defects in equipment and installation, inverters failure, and mismatch between the specifications provided by the PV module manufacturer [10, 11]. In this regard, the performance evaluation of large-scale grid-connected PV plants under HPCC which has not been done yet presents a significant challenge.
Numerous studies have addressed the performance assessment of solar PV plants installed worldwide. In these studies, it has been revealed that the PV system performance may be adversely affected by several factors such as radiation, ambient temperature, cell technology, geographic position, and installation configuration. Eke and Demircan [12] monitored a grid-tied PV system composed of 26 modules (2.7 kWp) under Turkey (Mugla) climatic conditions. The performance parameters of the PV module were evaluated on a monthly, seasonal, and annual basis. A comparison of results obtained in this study with those achieved from the measurements has demonstrated that the average difference in monthly electricity production varies between ±12% with an annual average value of less than 1% and a PR of 0.72. de Lima et al. [13] studied the performance of a 2.2 kWp grid-connected PV system located in a tropical climate (with dry winters) for one year. The measured output energy during the selected period was 3708.2 kWh, and the rated energy output per installed capacity was 1685.5 kWh/kWp. The performance results indicated the great potential for electricity generation based on solar photovoltaic energy in the studied climate state. Performance analysis of 1.4 kWp grid-connected PV plants in the desert (Oman) climatic conditions is presented in Al-Badi [14]. The results showed that the total annual energy achieved was 2217.6 kWh, whereas the annual average daily reference yield, array yield, and final yield were 6.36 kWh/kWp-day, 4.56 kWh/kWp-day, and 4.10 kWh/kWp-day respectively. In addition, dust phenomena were evaluated; their loss rate was found equal to 10%. However, the influence of the temperature was not investigated in this study. In this regard, in Xydis [15], the authors have reported that the high wind speed decreases the PV module temperature as a result the performance of the PV system is improved. In Al-Sabounchi et al. [16], the effect of temperature and dust deposition on a 36 kWp PV grid-tied system under desert (in the United Arab Emirates) climate conditions was evaluated for one year. The results showed that the system could continue to operate with reasonable system efficiency even at high ambient temperatures. However, it has been found that dust build-up on the glass of photovoltaic modules can seriously affect the performance of PV systems. Necaibia et al have assessed the performance of a grid-connected PV system with 2.5 kWp capacity under desert climate (southern Algeria) conditions. The small-scale power plant has been kept under monitoring for one year. The monthly seasonal and annual performance parameters have been recorded and analyzed. Despite the high radiation intensity, the energy production rate during the summer season was lower than during the other seasons. This is caused by the extremely high ambient temperature in summer, which decreases the efficiency of the PV systems. Bouacha et al. [17] presented a study of the performance of a grid-connected solar PV installation under the Mediterranean climate (Northern Algeria). This was a 9.5kWp monitored PV installation, which is divided into three subsystems, and installed on the roof of a renewable energy center (CDER). Three years of selected analyses were evaluated on an hourly, daily, monthly, and annual basis. This study showed that the system has acceptable performance rates and therefore a system inspection should be carried out to diagnose the reasons for the low productivity of the system. However, due to the presence of some missing data in the dataset, the actual energy production during the recording period could be higher than the measured energy production.
This thorough review of the literature reveals a lack of information on the performance evaluation of large-scale grid-connected PV plants. To this end, the purpose of this paper is to determine the monitoring results of a large-scale grid-connected PV plant located in Ain El-Melh, Algeria, over one year from January 2019 to December 2019. This is the first study evaluating a large-scale PV plant performance in Algeria. Photovoltaic systems have a variety of performance parameters, including reference yield, ambient temperature, final yield, system loss, capacity factor, performance ratio, and corrected performance ratio, therefore it may provide basic information for energy and economic evaluation of polycrystalline photovoltaic power generation under high plateau climate conditions in Algeria. Furthermore, an analysis of soiling is carried out to estimate the soiling losses and assess their effects on the performance of the PV plant. This study provides insights into the performance of large-scale grid-tied PV plants in HPCC. It contributes to the understanding of the unique challenges and considerations in this environment, supporting the development of optimized PV systems. In addition, the findings are valuable for researchers, investors, and policymakers involved in PV projects in similar climates, advancing renewable energy utilization.
The rest of this paper is structured as follows. Section 2 gives a presentation of the studied site and a description of the PV power plant. Section 3 describes the material and method used. Sections 4 and 5 provide the results discussion and the main conclusions of the present paper.
2.1 Site description
The grid-connected ground-mounted photovoltaic system investigated in this paper is installed in Ain El-Melh, Algeria, which is located in the Algerian highlands area and the gateway to the great desert. The choice of Ain El-Melh as the location for the photovoltaic power plant was influenced by several factors. Firstly, the site's accessibility played a crucial role, as Ain El-Melh is located close to transport routes, making it easy to move construction equipment and personnel. In addition, its proximity to a 60 kV substation for the evacuation of electricity to the national grid was a key factor, in ensuring efficient transmission of the electricity generated. In addition, the availability of suitable land at Ain El-Melh was an important factor, offering sufficient space for the installation of a large-scale photovoltaic system. Environmental and social considerations were also taken into account, with assessments carried out to minimize potential ecological impacts and foster positive interaction with the local community. All in all, these factors contributed to the choice of Ain El-Melh as the optimum location for the photovoltaic power plant, allowing for efficient electricity evacuation, optimal land use, and positive integration with the community.
The site's latitude and longitude are 34°51″ N, and 04°11″ E, respectively, while the height above sea level is 910 m. Also, the PV plant installation site is characterized, from a climatic point of view, by:
·Moderate temperatures in winter and spring to high in summer and autumn.
·High solar potential with an annual average of 7 kWh/m².
·Low relative humidity.
·A high number of clear sky days.
·A large number of days with dust storms, mostly in spring.
The construction and commissioning of the Ain El-Melh photovoltaic power plant followed a thorough planning process, including equipment procurement, site preparation, installation of system components, connection to the power grid, and performance testing. Any challenges were resolved through effective project management and close collaboration with stakeholders. This rigorous process led to the successful implementation of the photovoltaic power plant.
2.2 PV power plant
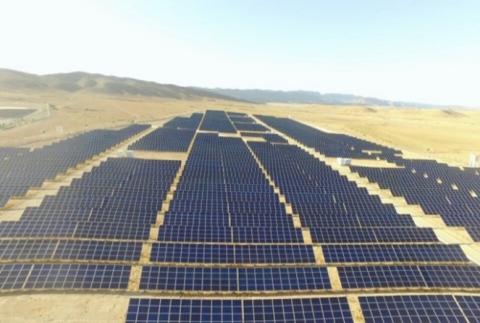
The photovoltaic power plant connected to the medium voltage network of Ain El-Melh is part of a large 400 MW project managed by the SKTM Company. SKTM is a subsidiary of Sonelgaz, which is responsible for the development of renewable energies on behalf of the Algerian government, which has deployed 23 PV power plants in the highlands, and central regions of the country. The Ain El-Melh plant is a solar PV plant with a total capacity of 20 MWp that occupies an area of 40 hectares as shown in the Google map picture (see Figure 1(a)). Figure 1(b) shows a view of the photovoltaic installation taken by a drone. The general layout, equipment, components, and the photovoltaic field (solar panels, supporting structures, mounting boxes, cabling, converter stations, and transformer stations) are described below. The design parameters of the 20 MWp PV plant are summarized in Table 1.
(a)
(b)
Figure 1. 20 MWp grid-connected ground-mounted PV plant system at Ain El-Melh (a) Google Maps view and (b) Aerial view using a drone
Table 1. Ain El-Melh PV power plant design parameters (20 MWp)
|
Parameters |
Characteristics |
|
Type of module |
Poly-crystalline silicon |
|
Efficiency of PV module |
15% |
|
Tilt and Orientation |
33° South |
|
Type of installation |
Fixed structure |
|
PV rows distance |
5 meters |
|
Inverter nominal power |
500 KW |
|
Characteristics of transformers |
1250 kVA, 47–52 Hz, 315 V/31.5 kV |
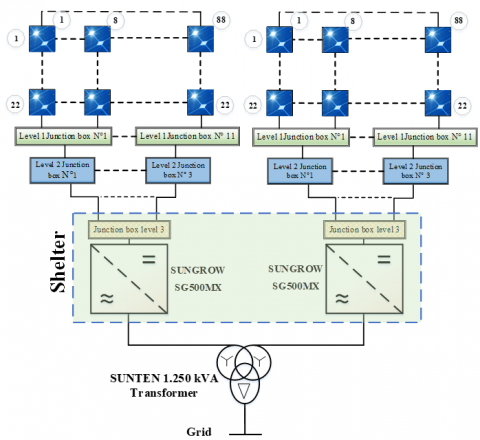
The grid-tied PV park consists of 80080 polycrystalline silicon modules with a rated power of 250 Wp. It has been divided into 40 sub-fields of 500 kW where each of them is connected to a 500 kW SUNGROW inverter. Every two sub-fields (1 MWp) are connected to a step-up transformer with an apparent power of 1250VA. Each sub-field consists of:
·1936 polycrystalline silicon modules of 250 Wp each and inclined at 33° to the south
·88 PV strings (each string consists of 22 modules connected in series)
·1 inverter of 500 kW type SUNGROW (input 500-850 VDC - output 315 VAC)
·11 level 1 junction boxes
·3 level 2 junction boxes
·1 level 3 junction box.
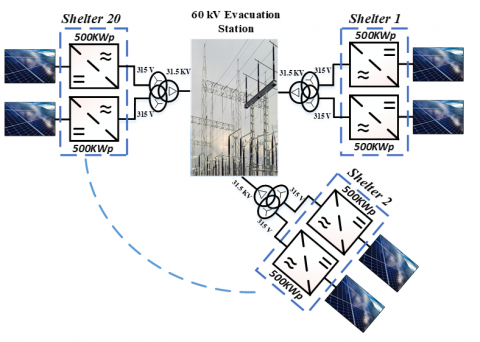
As shown in Figure 2, the 60 kV overhead lines connected to the national grid are used to evacuate the produced electricity. Therefore, the photovoltaic modules are connected to the 500 kW inverter cabinets via junction boxes (level 1), parallel boxes (level 2), and general boxes (level 3) included in the shelters. The use of three-tiered grouping boxes reduces the total length of DC cables and the ohmic losses caused and is helpful in O&M operations. Figure 3 depicts a schematic block diagram of a subfield of 1 MWp. The technical data of the PV modules used in this PV plant are given in Table 2. Polycrystalline silicon modules offer a cost-effective solution for solar power generation. They have lower efficiency compared to monocrystalline modules but better temperature tolerance, making them suitable for regions with warmer climates.
Figure 2. Overview of the 20 MW Ain El-Melh grid-connected power plant
Figure 3. Schematic diagram of a subfield of 1 MWp
Table 2. PV module specification (Yingli Solar YL2545-29b)
|
PV Module |
Specifications |
|
STC power rating |
250 Wp ±5% |
|
Number of cells |
60 |
|
$V_{m p}$ |
29.8 V |
|
$I_{S C}$ |
8.92 A |
|
$I_{m p}$ |
8.39 A |
|
$V_{o c}$ |
37.6 V |
|
Power temperature coefficient $\alpha$ %/℃ |
-0.45 |
|
NOCT (℃) |
46±2 |
3.1 Monitoring
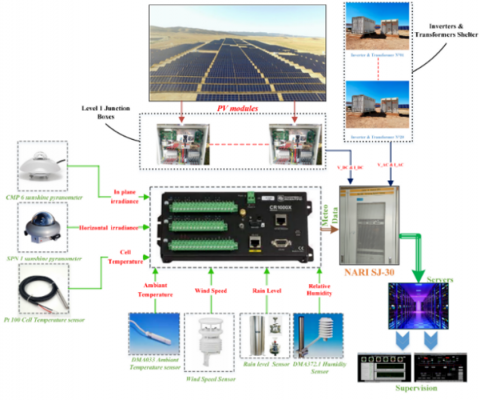
The PV plant performance is evaluated by means of an important database recorded through a system of sensors that continuously monitor the electrical variables of the PV modules, at level 1 junction boxes, inverters, and transformers, as well as the local meteorological data. In-plane and horizontal global irradiance, cell and ambient temperatures, wind speed, rain level, and relative humidity are monitored using the CR1000X monitoring device. The weather station is strategically located within the PV plant to ensure precise data collection. This centralized placement guarantees accurate and reliable monitoring of environmental conditions, enabling valuable insights into the plant's performance in varying weather conditions and facilitating effective monitoring and optimization strategies. In addition, the electrical variables delivered from the PV modules, junction boxes, inverters, and transformers such as the DC and AC energy are monitored by the NARI SJ-30 monitoring system. The NARI monitoring system synchronizes weather and electrical data instantaneously at a sampling rate of 15 minutes. Figure 4 depicts the synoptic diagram of the monitoring system for the 20 MWp grid-connected power plant.
Figure 4. Synoptic diagram of the monitoring system for the 20 MWp PV grid-tied power plant
3.2 Performance assessment
The IEC 61724 standard is used to study the performance of the grid-tied PV plant system, this standard provides normalized parameters in order to characterize the PV system operation performance. Table 3 shows the normalized parameters which consist of yield parameters, efficiency parameters, quality factors, and loss parameters including mathematical formulas and a brief description. In addition, converting all yields and losses parameters to normalized mean daily yields provides a highly informative annual energy yield bar chart showing all of them in kWh/kWp/d for any given year. The inclusion, in Table 3, of the weather-corrected performance ratio, is very practical information that provides temperature losses and a very effective way to split other capture (miscellaneous capture loss) losses from inherent temperature losses [17].
Table 3. Normalized parameters used for PV system performance evaluation
|
Parameters |
Used Symbol |
Equation |
Unit |
|
Yields |
|||
|
Reference Yield: This is the time that the sun must be shining with G0 = 1kW/m² in order to radiate the energy Ht to the PV array of the PV module |
$Y_r$ |
$Y_r=\frac{H_t}{G_0}$ |
kWh/kWp/day (or) h/day |
|
Array Efficiency: Is the time that the PV system needs to work at the nominal power of the PV array P0 in order to produce the output DC energy EDC |
$Y_a$ |
$Y_a=\frac{E_{D C}}{P_0}$ |
|
|
Final Yield: Is the time that the PV system needs to operate at the nominal power of the PV array P0 in order to produce the output AC energy EAC. |
$Y_f$ |
$Y_f=\frac{E_{A C}}{P_0}$ |
|
|
Efficiencies |
|||
|
Array Efficiency |
$\eta_A$ |
$\eta_A=\left(\frac{E_A}{A_a \times H_T}\right)$ |
|
|
Inverter Efficiency |
$\eta_{\text {inv }}$ |
$\eta_{i n v}=\left(\frac{P_{A C}}{P_{D C}}\right) \times 100$ |
% |
|
Characteristics of transformers |
$\eta_{s y s}$ |
$\eta_{s y s}=\left(\frac{E_{A C}}{A_a \times H_T}\right) \times 100$ |
|
|
Quality Factors |
|||
|
Capacity utilization factor |
$CUF$ |
$C U F=\left(\frac{Y_f}{24 \times 365}\right) \times 100$ |
% |
|
Performance ratio: Represents the ratio between the effective energy EAC and those that would be generated from an ideal, lossless PV installation assuming a 25ºC solar cell temperature with the same radiation level. |
$PR$ |
$P R=\left(\frac{Y_f}{Y_r}\right) \times 100$ |
|
|
Weather-corrected Performance ratio [18] |
$P R_{\text {corr }}$ |
$P R_{\text {corr }}=\frac{P R}{1-\alpha\left(T_C-25\right)}$ |
|
|
Losses |
|||
|
System Losses |
$L_S$ |
$L_S=Y_a-Y_f$ |
kWh/kWp/day (or) h/day |
|
Array Capture losses |
$L_C$ |
$L_c=Y_r-Y_a$ |
|
|
Thermal capture loss: Losses caused by cell temperatures higher than 25ºC |
$L_{C T}$ |
$\begin{array}{r}L_{C T}=Y_r-Y_r\left[1-\alpha\left(T_C\right.\right. -25)]\end{array}$ |
|
|
Miscellaneous capture loss: This loss does not depend on temperature. However, it is caused by wiring, string diodes, low irradiance, partial shadowing, pollution, snow covering, inhomogeneous irradiance, mismatch, maximum power tracking errors, reduction of array’s power caused by inverter failures, or when the accumulator is fully charged (standalone systems), errors in irradiance measurements, when irradiance is measured with a pyranometer, spectral losses, and losses caused by glass reflections. |
$L_{C M}$ |
$L_{C M}=L_C-Y_{C T}$ |
|
4.1 Analysis of the weather data
It is important to note that weather parameters such as radiation, temperature, wind, precipitation, and relative humidity affect the operating performance of PV systems. These parameters are crucial to properly assess the PV system's performance.
Seasonal variations in solar radiation, temperature, wind speed, and other weather parameters have a significant impact on the efficiency, yield, and power generation of a photovoltaic (PV) plant. Solar radiation levels fluctuate throughout the year, with higher levels during summer and lower levels during winter. These variations directly affect the amount of energy that can be harvested by the PV modules, resulting in corresponding changes in power generation. Temperature plays a crucial role, as high ambient temperatures can lead to increased module temperatures, reducing their efficiency and overall output. Conversely, cooler temperatures can enhance module performance. Wind speed also influences PV plant performance, as higher wind speeds help dissipate heat from the modules, keeping them cooler and improving efficiency. Lower wind speeds, on the other hand, can lead to increased operating temperatures and decreased module performance. Other weather parameters, such as precipitation and relative humidity, can impact the plant's efficiency as well. Excessive rainfall or high humidity levels can cause the accumulation of dirt and debris on the module surface, diminishing their performance. Regular cleaning and maintenance are necessary to ensure optimal efficiency. By understanding the seasonal variations in these weather parameters, operators can optimize the PV plant's performance, implement appropriate maintenance strategies, and make informed decisions to maximize energy production throughout the year.
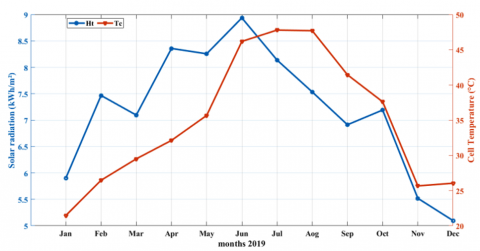
The recorded average daily solar radiation over the PV module area and the average daily cell temperature are shown in Figure 5. As expected in the Algerian highland climate, the maximum recorded average daily solar radiation is 8.93 kWh/m²/day during summer days and more precisely in June, while the minimum recorded is 5.09 kWh/m²/day during winter days (in December). However, summer days are characterized by high ambient temperatures resulting in high module temperatures and consequently leading to excessive temperature losses.
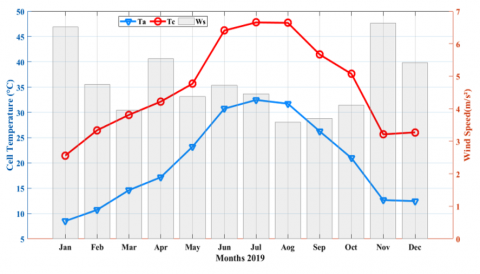
The monthly average ambient temperature, cell temperature, and wind speed are shown in Figure 6. There is a correlation between the cell temperature and ambient temperature, and the difference between the two variables is almost stable overall the year and equals 15°C. The lowest level of the ambient temperature reached on a monthly average is 8.5°C recorded in January, whereas the average maximal ambient temperature reaches 32.46°C in July. In addition, the mean daily temperature of the cell ranged from 21.47°C in January to 47.79°C in July. Therefore, wind speed is an important factor to be taken into account in the analysis, as several research studies have suggested that a high wind speed may mitigate power loss by minimizing the module’s temperature [19]. By the way, the peak of the monthly average wind speed is 6.63 m/s in November, while the lowest is 3.58 m/s in August.
Figure 5. Average monthly measured plan of array solar irradiation ($H_t$), and temperature of the cell ($T_c$)
Figure 6. Average monthly ambient temperature ($T_a$), cell temperature ($T_c$), and Wind speed ($W_s$)
4.2 Performance evaluation
In the Ain El Melh region, both the ambient temperature and the solar insolation intensity vary over the year. Four seasonal periods stand out in this region as follows: spring (Mar-May), summer (Jun-Aug), autumn (Sep-Nov), and winter (Dec-Feb). Over the year, the ambient temperature generally ranges from 2°C to 40°C and is rarely below -2°C or above 40°C. Therefore, the operational performance of the installed grid-connected PV plant depends on the seasonal variations of radiation and temperature.
4.2.1 Yield assessment
Figure 7 indicates the calculated average monthly for the reference yield (Yr), array yield (Ya), and final yield (Yf) of the PV plant. It can be seen that the reference yield (Yr) varies from 5.098 h/day to 8.93 h/day. The maximum amount of the reference yield (Yr) is found in summer, while the minimum reference yield is observed in winter. Likewise, in April and December, the maximum system yield (Ya) of 6.041 h/day and the minimum of 4.092 h/day respectively are recorded. In this way, there is a range of final system performance (Yf) ranging from 3.99 h/day in December to 5.897 h/day in April. Furthermore, the calculated annual average monthly of Yr, Ya, and Yf are equal to 7.20 h/day, 5.20 h/day, and 5.08 h/day, respectively. From the latest (average annual values of the different yields), it can be found that on average Yf values are 30% lower than Yr values. As well as the difference between the maximum Yf value in summer and the minimum value in the winter period is in the range of 31%. This shows the high potential of PV installations in that location in providing almost stable monthly energy generation all over the year.
Table 4 summarizes the seasonal performance of the PV plant and the seasonal variation of some of the assessed parameters described in the section before (Table 3). It can be seen that the different yield parameters (Yr, Ya, and Yf) have quite stable values, and the difference between the minimum and maximum values is in the range of 15-24%. The system losses (Ls) and the inverter efficiency (Inv. Eff.) are stable all over the year and measured values are 0.1 h/d and 97.6% respectively. The performance ratio (PR) of the PV plant varies in accordance with the system efficiency (Sys. Eff.), the highest PR values are found in the winter season (76.9%), while during the summer period, the PR value is the lowest (65.8%), and this is mainly due to the high temperatures in summer. The capacity utilization factor (CUF) varies from 19.5% to 23% depending on the season, high values are attributed to summer and spring seasons. Finally, the measured system efficiency (Sys. Eff.) and module efficiency (Mod. Eff.) are almost similar and vary according to season, higher values of 13% are found during the winter period.
Figure 7. Average monthly ambient temperature (Ta), cell temperature (Tc), and Wind speed (Ws)
Table 4. Performance parameters of the photovoltaic plant over the seasonal period
|
Season Parameters |
Autumn |
Spring |
Summer |
Winter |
|
Yf (h/d) |
4.70 |
5.55 |
5.39 |
4.68 |
|
Yr (h/d) |
6.54 |
7.90 |
8.203 |
6.16 |
|
Ya (h/d) |
4.81 |
5.69 |
5.52 |
4.79 |
|
Ls (h/d) |
0.11 |
0.13 |
0.13 |
0.11 |
|
Lc (h/d) |
1.73 |
2.22 |
2.69 |
1.37 |
|
Mod. Eff. (%) |
12.73 |
12.45 |
11.54 |
13.48 |
|
Inv. Eff. (%) |
97.65 |
97.64 |
97.68 |
97.65 |
|
Sys. Eff. (%) |
12.43 |
12.16 |
11.27 |
13.17 |
|
PR (%) |
72.62 |
71.01 |
65.82 |
76.90 |
|
CUF (%) |
19.58 |
23.14 |
22.45 |
19.49 |
4.2.2 Efficiencies assessment
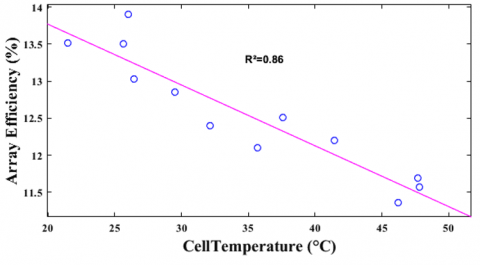
Climatic parameters such as temperature variation, radiation level, soiling surface, presence of humidity, and wind speed influence the efficiency of the photovoltaic arrays. In the PV plant location, it is found that the efficiency of the PV array is mainly affected by the temperature. Figure 8 illustrates a correlation coefficient with a strong inverse amount of 0.86, relating the array efficiency to the cell’s temperature.
Figure 8. Array efficiency and cell temperature variation
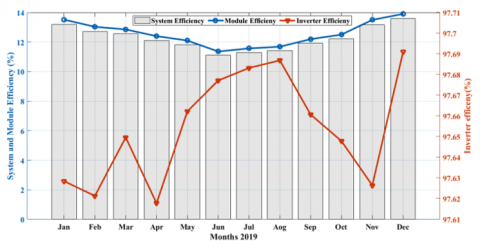
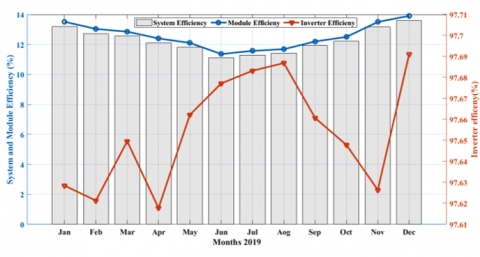
The measured annual average monthly efficiency of the array, inverter, and system are presented in Figure 9. The higher cell temperature recorded in summer results in a maximum reduction of array efficiency. The lower value of the array efficiency noticed in June is 11.36%, which represents a decrease of 24.26%. The reduction of the cell’s temperature in the autumn leads to an improvement in the array efficiency, which reached 12.73%. The array efficiency value is measured in spring as 12.45%, which represented a drop of 17% from the rated efficiency. However, in the winter period, a maximum array efficiency of 13.48% is achieved due to the weak cell temperature. In addition, the 13.91% highest amount of the PV array efficiency is reached in December, where the cell temperature is minimum. According to the average annual efficiency of the array, it is found an amount up to 12.55%, which represents a reduction of 16.33% compared to the array's nominal efficiency. The inverter’s efficiency is affected by the in-plane variation of solar radiation [20] and the ambient temperature [21]. It is noted that the efficiency of the inverter remains stable with a recorded annual average of 97.66%. The system efficiency is highest when both the array and the inverter are at their maximum efficiency. The system's maximum efficiency is 13.17%, which is recorded in winter.
This great efficiency value is because of the excellent amount of array efficiency. Further, the system's minimum efficiency achieved in the summer months is 11.27%, owing to the reduced efficiency of the array. Furthermore, the system's lower efficiency in June is 11.1%, which is achieved through higher cell temperatures and lower array efficiency. For the present grid-connected PV plant, the average annual system efficiency is 12.26%.
Figure 9. Average monthly efficiency of an array, system, and inverter
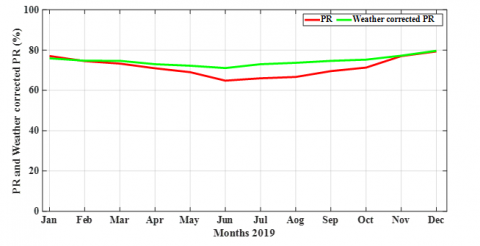
4.2.3 Performance ratio (PR) and weather-corrected PR
The plant's PR shows the efficiency of the PV plant in converting solar radiation into electricity. However, the PV system's nominal PR can never be achieved in real environmental conditions due to unavoidable losses. As depicted in Figure 10, the monthly average performance ratio value of the PV system under study varies from 64.8% to 79.34%. The highest RP value is obtained in June at the moment the cell’s temperature is 46.19°C, whereas the maximum RP value is obtained in December (79.34%) when the temperature of the cell is 26.04°C. Note that the higher PR value in winter is caused by the great inverter, array, and system efficiency values recorded. The average monthly RP variation according to the temperature of the PV cell is plotted in Figure 11. As a result, the slope’s negative gradient obtained -0.4675 means that raising the temperature of the cell reduces the system's PR. Besides, the maximum PR value is 76.9% in the winter period, while the minimum value is 65.82% in the summer period. The plant's annual average RP is reported at 71.59%. Figure 10 shows the uncorrected and corrected PR, the incentive to modify the RP measure into a weather-corrected number is obvious. It can be noted that the calculated uncorrected PR varies by 14.5% over the year. Therefore, this bias will result in erroneous high amounts during the winter months and erroneous low amounts during the summer months. However, the corrected PR is almost stable over the year.
Figure 10. Average monthly performance ratio (PR) and weather-corrected PR
Figure 11. Performance ratio (PR) variation according to cell temperature
4.2.4 Total produced energy
The PV system's total produced energy is based on the intensity of solar radiation and its availability. As shown in Figure 12, the availability of irradiation is highest in June as a result of the maximum number of sunshine hours, leading to a maximum monthly average of 112.3 MWh/day of electricity. December has the lowest monthly average daily electricity production (77.37 MWh/day) caused by lower solar irradiation. The annual average daily electricity production is 97.52 MWh/day.
In addition, the capacity utilization factor (CUF) percentage of the present system varies between 16.65% and 24.57% on average per month over the analyzed year. As shown in Figure 12, the minimum monthly average CUF value is 16.65% recorded in December, while the maximum value of 24.57% is reached in April. It can be seen from Figure 13 that the CUF clearly correlates (R² = 0.92) with in-plane solar radiation levels indicating that the CUF rises when increasing the radiation level. According to the seasons, the highest CUF is recorded in spring at 23.14% while the lowest is 19.49% in winter. The CUF in summer is recorded as 22.45%, which is lower compared to spring but higher compared to winter. Meanwhile, the CUF value in autumn is lower than in summer and reaches 19.58%. This gives an annual average monthly CUF value of 21.16%.
Figure 12. Alternative output energy and capacity utilization factor
Figure 13. Variation of CUF as a function of the in-plan radiation
4.2.5 Loss calculation
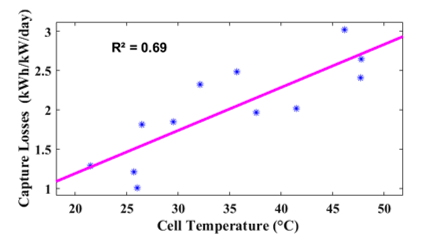
The monthly average system losses ($L_s$) and the capture losses (Lc) are presented in Figure 14. The system losses, $L_s$, vary throughout the year between 0.0953 h/day and 0.1440 h/day. Overall, $L_s$ has a seasonal minimum average equal to 0.112 h/day in autumn, whereas the maximum average is in spring at 0.134 h/day. On the other hand, the highest monthly average $L_c$ is reported in June as a result of the elevated temperature of the cell, and it increases as the cell’s temperature increases, as depicted in Figure 15. However, it was found that the maximum seasonal average of $L_c$ recorded in summer is 2.68 h/day, as listed in Table 4. Also, the annual monthly average of $L_c$ is obtained to be 2.0 h/day compared to $L_s$ of 0.12 h/day.
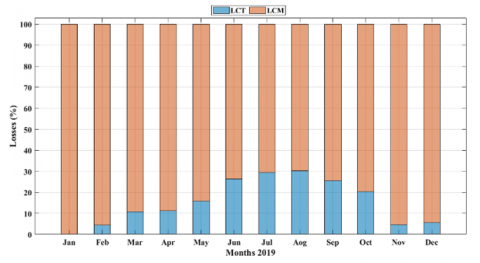
As far as capture losses ($L_c$) are concerned, they can be divided into two components, namely thermal (LCT) and miscellaneous capture losses (LCM). The LCT evolves as a function of the seasonal temperature variation of the PV cells. In order to calculate the LCT, the module temperature ratio (- 0.44%/°C) is used for the power. Therefore, due to the higher temperature of the cell, the higher LCT is 0.7963 h/day in June and the lowest is 0 h/day in January because of the lowest temperature of the cell (below 25°C).
Miscellaneous capture losses are defined as the failures that appear in the PV plant’s DC side as a result of soiling effects, mismatch losses of the modules, shadowing losses, losses of cables and diodes, as well as mismatch losses. In autumn, when the module surface is relatively clean and the index of the sky brightness is high, the lowest monthly average daily LCM is found to be 0.9515 h/day. However, the highest monthly average daily LCM in summer is 2.2180 h/day. The LCT and LCM annual variation is shown in Figure 16. As seen, the LCT has an annual average of 15.36% compared to 84.63% for the LCM.
Figure 14. Final yield average, and final yield, capture losses, and system losses average monthly
Figure 15. Capture loss variation corresponding to the cell temperature
4.2.6 Soiling effect evaluation
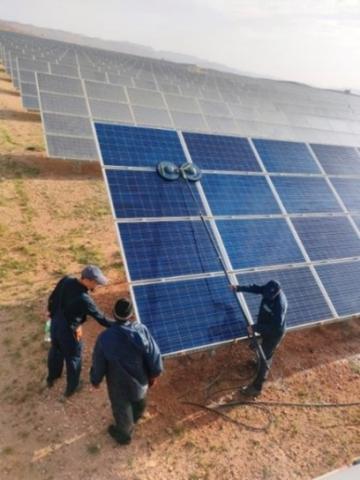
In this section, the impact of dust on power generation is investigated. The accumulation of dust on the surface of the components is important, and the dust mainly accumulates on the bottom corners of the components. This accumulation of dust has two effects: (1) reducing solar radiation reaching the solar cells and (2) creating partial shading of the modules.
Figure 16. Thermal losses and miscellaneous capture losses variation
Figure 17. Photograph of dust accumulation clean-up operation
For investigating the dust effect on power production, a subfield of 500 kWp is taken for clean-up evaluation as shown in Figure 17. Figure 18 shows the comparison of the PR performance ratio of two sub-fields between 18 May 2022 and 19 June 2022. It can be noticed that the PR performance ratio is improved in the case of the cleaned sub-field. The average PR after the cleaning operation reaches 65.74% against 62.63% for the uncleaned sub-field.
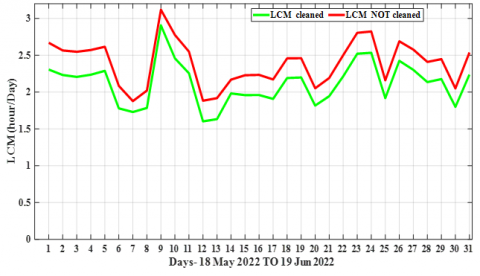
Figure 19 illustrates the miscellaneous capture losses (LCM) of two sub-fields for the studied period. The average capture loss LCM for the uncleaned sub-field is 2.39 h/day. However, this average is reduced by a rate of 11.71% for the cleaned subfield (2.11 h/d).
Figure 18. Performance ratio comparison
Figure 19. Miscellaneous capture losses comparison
The analysis of a 20 MWp grid-tied PV plant in Ain El-Melh, Algeria revealed promising results. The plant achieved significant annual yield values, demonstrating efficient energy production. The high-efficiency rates of the inverter and the overall system contribute to the plant's optimal performance. The calculated performance ratio and capacity utilization factor indicate the effective utilization of the PV plant. The analysis also revealed the impact of soiling on performance, with notable improvements observed after cleaning. The study's findings hold significant importance for Algeria and similar regions with comparable high plateau climates. The research demonstrates the feasibility and effectiveness of large-scale grid-tied PV plants in harnessing solar resources and achieving renewable energy goals.
[1] IEA. (2019). World Energy Outlook 2019. Paris.
[2] Zhang, L., Zheng, H., Wan, T., Shi, D., Lyu, L., Cai, G. (2021). An integrated control algorithm of power distribution for islanded microgrid based on improved virtual synchronous generator. IET Renewable Power Generation, 15(12): 2674-2685. https://doi.org/10.1049/rpg2.12191
[3] Silvestre, S., Chouder, A. (2008). Effects of shadowing on photovoltaic module performance. Progress in Photovoltaics: Research and Applications, 16(2): 141-149. https://doi.org/10.1002/pip.780
[4] Nikmehr, N., Najafi-Ravadanegh, S. (2015). Optimal operation of distributed generations in micro-grids under uncertainties in load and renewable power generation using heuristic algorithm. IET Renewable Power Generation, 9(8): 982-990. https://doi.org/10.1049/iet-rpg.2014.0357
[5] Bevrani, H., Ghosh, A., Ledwich, G. (2010). Renewable energy sources and frequency regulation: survey and new perspectives. IET Renewable Power Generation, 4(5): 438-457. https://doi.org/10.1049/iet-rpg.2009.0049
[6] Kumar, D.S., Yagli, G.M., Kashyap, M., Srinivasan, D. (2020). Solar irradiance resource and forecasting: a comprehensive review. IET Renewable Power Generation, 14(10): 1641-1656. https://doi.org/10.1049/iet-rpg.2019.1227
[7] Zangerolame Taroco, L.S., Sabbá Colares, A.C. (2019). The framework convention on climate change and the Paris agreement: Challenges of the conference of the parties. Prolegómenos, 22(43): 125-135. https://doi.org/10.18359/prole.3449
[8] Ghezloun, A., Merabet, H., Oucher, N., Djouder, R. (2020). COP 24: Algeria’s commitments in the fight against climate change. In AIP Conference Proceedings. https://doi.org/10.1063/5.0033521
[9] R. Direction energie, “Ministère de l’Énergie , Algérie,” Direction energie renouvelable, 2020. https://www.energy.gov.dz/?rubrique=energiesnouvelles-renouvelables-et-maitrise-de-lrenergie (accessed Dec. 05, 2021).
[10] Kim, J.G., Kim, D.H., Yoo, W.S., Lee, J.Y., Kim, Y.B. (2017). Daily prediction of solar power generation based on weather forecast information in Korea. IET Renewable Power Generation, 11(10): 1268-1273. https://doi.org/10.1049/iet-rpg.2016.0698
[11] Loukriz, A., Saigaa, D., Drif, M., Hadjab, M., Houari, A., Messalti, S., Saeed, M.A. (2021). A new simplified algorithm for real-time power optimization of TCT interconnected PV array under any mismatch conditions. Journal Européen des Systèmes Automatisés, 54(6): 805–817. https://doi.org/10.18280/jesa.540602
[12] Eke, R., Demircan, H. (2013). Performance analysis of a multi crystalline Si photovoltaic module under Mugla climatic conditions in Turkey. Energy conversion and Management, 65: 580-586. https://doi.org/10.1016/j.enconman.2012.09.007
[13] de Lima, L.C., de Araújo Ferreira, L., de Lima Morais, F.H.B. (2017). Performance analysis of a grid-connected photovoltaic system in northeastern Brazil. Energy for Sustainable Development, 37: 79-85. https://doi.org/10.1016/j.esd.2017.01.004
[14] Al-Badi, A.H. (2018). Measured performance evaluation of a 1.4 kW grid-connected desert-type PV in Oman. Energy for Sustainable Development, 47: 107-113. https://doi.org/10.1016/j.esd.2018.09.007
[15] Xydis, G. (2013). The wind chill temperature effect on a large-scale PV plant—An exergy approach. Progress in Photovoltaics: Research and Applications, 21(8): 1611-1624. https://doi.org/10.1002/pip.2247
[16] Al-Sabounchi, A.M., Yalyali, S.A., Al-Thani, H.A. (2013). Design and performance evaluation of a photovoltaic grid-connected system in hot weather conditions. Renewable Energy, 53: 71-78. https://doi.org/10.1016/j.renene.2012.10.039
[17] Bouacha, S., Malek, A., Benkraouda, O., Arab, A. H., Razagui, A., Boulahchiche, S., Semaoui, S. (2020). Performance analysis of the first photovoltaic grid-connected system in Algeria. Energy for Sustainable Development, 57: 1-11. https://doi.org/10.1016/j.esd.2020.04.002
[18] Dierauf, T., Growitz, A., Kurtz, S., Hansen, C. (2013). Weather-corrected performance ratio technical report NREL/TP-5200-57991. Tech. Rep. NREL/TP-5200-57991.
[19] Kaldellis, J.K., Kapsali, M., Kavadias, K.A. (2014). Temperature and wind speed impact on the efficiency of PV installations. Experience obtained from outdoor measurements in Greece. Renewable Energy, 66: 612-624. https://doi.org/10.1016/j.renene.2013.12.041
[20] Ayompe, L.M., Duffy, A., McCormack, S.J., Conlon, M. (2011). Measured performance of a 1.72 kW rooftop grid-connected photovoltaic system in Ireland. Energy Conversion and Management, 52(2): 816-825. https://doi.org/10.1016/j.enconman.2010.08.007
[21] Rouholamini, A., Pourgharibshahi, H., Fadaeinedjad, R., Abdolzadeh, M. (2016). Temperature of a photovoltaic module under the influence of different environmental conditions–experimental investigation. International Journal of Ambient Energy, 37(3): 266-272. https://doi.org/10.1080/01430750.2014.952842