Ding Wang
© 2023 IIETA. This article is published by IIETA and is licensed under the CC BY 4.0 license (http://creativecommons.org/licenses/by/4.0/).
OPEN ACCESS
Guided by market orientation, the traditional mass production mode has gradually shifted to the multi-variety small-batch production mode, so it’s of certain necessity and practical and theoretical value to research the logistics service quality of multi-variety small-batch production. This paper explores the quality management and control for the whole-process logistics service of multi-variety small-batch production (MVSBP) manufacturing. Firstly, the authors analyzed the factors affecting the MVSBP logistics system of production and manufacturing enterprises, and plotted the distribution paths between different functional areas in the production workshop. Then, the simulation steps of the MVSBP logistics system were detailed, and the simulation software was introduced. After that, the three elements of MVSBP logistics, namely, site selection, path design, and warehousing, were optimized, before providing the optimization objective function. Finally, the MVSBP logistics system was simulated on a real case: the production logistics management of a porcelain blank processing workshop. The simulation results demonstrate the effectiveness of our quality management and control strategy for production logistics.
multi-variety small-batch production (MVSBP), logistics service, quality management and control
With the growth of the economy, and improvement of living standards, the manufacturing industry changes dramatically to meet the increasingly diverse needs for products [1-5]. Under the influence of market orientation, the traditional large-scale batch production model gradually shifts towards the model of multi-variety small-batch production (MVSBP) [6-15]. Many manufacturing enterprises focus on the production quality control of products, and the duration of product research. These two factors directly affect the sales, aftersales, and consumer satisfaction of products, and even impact the market competitiveness of manufacturing enterprises. As a key impactor of these two factors, the logistics service of manufactured products has a direct bearing on the organization of production, the implementation of production and assembly plan, and product delivery. But the impactor has not received much attention [16-24]. Therefore, it is theoretically and practically significant to explore the logistics service quality for the production and manufacturing of multi-variety small-batch products.
Digital transformation may improve business processes, and enhance the flexibility of manufacturing and logistics networks. Birkmaier et al. [25] performed a discrete event simulation (DES) on the digital transformation potential of industry 4.0 to robust production logistics networks, and observed the simulation results in different scenes. The simulation results help to identify potential flexible measures, quantify their effects, and mitigate the uncertainty in the control of production logistics networks. From multiple angles and aspects, Cui [26] discussed and analyzed the optimization of corporate production logistics systems based on computer simulation, introduced the steps of computer simulation, and compared the computer simulation-based corporate production logistics system with the conventional corporate production logistics system, revealing the application effect of computer simulation. Their research offers theoretical suggestions for enterprises to optimize their systems. For manufacturing enterprises, reliable production planning and scheduling lay the basis for efficient processing of orders, and underpin the integration and coordination of all participants in the supply chain. Therefore, it is increasingly difficult to identify and solve the inefficiency or other problems induced by the planning process of the industrial supply chain. Lucht et al. [27] proposed a convenient way to describe, visualize, and analyze the scheduling behavior of manufacturing enterprises with very few data, summarized the key evaluation indices of planning quality, and constructed an evaluation model covering two dimensions: planning stability, and planning accuracy.
In static collaboration, the dynamic problems cannot be solved easily, due to the limited resources. To address this defect, Kai et al. [28] proposed a unit-level synchronized management method for MVSBP production logistics. The traditional digital manufacturing workshop cannot satisfy the modern manufacturing needs for the MVSBP of gas monitors. Contraposing the complex production process involving digital equipment, digital control, and digital key technologies, Wang et al. [29] presented a solution to gas monitor workshop based on intelligent manufacturing, constructed an information flow model for the implementation of the integrated framework and activities, and realized the underlying equipment layer, the intermediate layer of design and manufacturing management, and the intelligent control layer.
Based on the development progress of the understanding and methodology of logistics service quality, present world field scholars have carried out studied on the components, models, and performance assessment of the quality of logistic service, however, the research on the whole-process of multi-variety small-batch production is insufficient. In order to effectively improve the quality of logistics service during the entire process of multi-variety small-batch production, this paper conducted relevant research on quality management and control. Section 2 analyzes the factors affecting the MVSBP logistics system of production and manufacturing enterprises, and plots the distribution paths between different functional areas in the production workshop. Section 3 details the simulation steps of the MVSBP logistics system, and introduces the simulation software. Section 4 optimizes the three elements of MVSBP logistics, namely, site selection, path design, and warehousing, and provides the optimization objective function. Finally, the MVSBP logistics system was simulated on a real case: the production logistics management of a porcelain blank processing workshop. The simulation results demonstrate the effectiveness of our quality management and control strategy for production logistics.
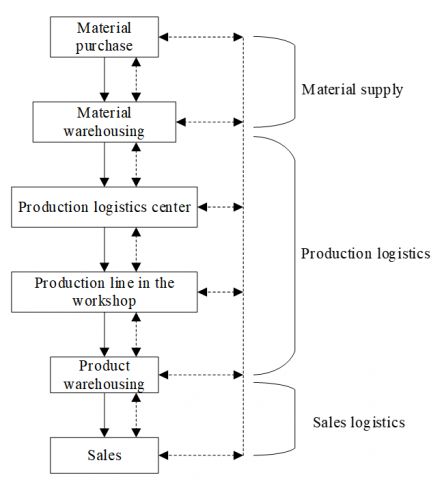
Multi-variety small-batch production is a kind of manufacturing method whose production objects are of many types (they vary in specification, model, size, shape, and colour, etc.), and the production quantity of each type of products is relatively small. The main reasons limiting production efficiency and logistics service quality include the parallel production of multi-type products, the uncertain order results and production cycle, and changing materials and requirements, and the resulted serious procurement delay. During MVSBP logistics, the production materials, including raw materials and parts, are transported by vehicles from an external location to production workshops, stored properly in different warehouses, and distributed to different production lines of the workshops. Then, the products are manufactured through operations like dismantling, processing, and packaging. Finally, the finished products are distributed to consumers. Figure 1 explains the entire MVSBP logistics system.
Different from the mass production mode, multi-variety small-batch production needs to deploy more types of less quantity materials, so this paper holds that the MVSBP logistics system mainly encompasses two parts, namely, the external logistics system and the internal logistics system. The external logistics system is responsible for the following logistics: the purchase of raw materials or parts, and the distribution of finished products. The internal logistics system is responsible for transporting raw materials or parts between warehouses and workshops. Therefore, logistics activities occur in every link of the production and manufacturing process. In other words, MVSBP logistics is the primary link in the production and manufacturing process, and an important component of corporate logistics.
Nevertheless, there is a crucial difference between MVSBP logistics and corporate logistics. MVSBP logistics, as a consumptive production behavior, does not lead to value increment. The value of MVSBP logistics is mainly manifested as ensuring the smoothness of production and manufacturing process. By contrast, corporate logistics creates values through the spatial flows of materials and products, and elevates the values of the enterprises. It can be considered that supplier satisfaction, production guarantee ability, distribution ability, interface management ability, and warehouse management ability are the core criteria for measuring the logistics service quality of manufacturing enterprises.
The MVSBP logistics system of production and manufacturing enterprises is mainly affected by the following factors:
(1) The prerequisite for the orderly logistics of MVSBP is to have a reasonable layout of production workshops, which can prevent the crossing between production logistics paths, shorten the low distance of production materials, and reduce the logistics cot.
(2) To ensure the production efficiency of the entire MVSBP process, it is necessary to avoid the frequent and repeated transport of production materials per unit time. The key is to implement a reasonable operation sequence that maintain the interconnection between operations. This is because the logistics direction of production materials depends on the production operations.
(3) The efficient operation of the MVSBP logistics system is promoted by simple, unobstructed, and crossing-free distribution paths. If the paths are complex, obstructed, and crossing each other, the system will face a low efficiency.
(4) The loading/unloading and transport of production materials are inseparable from the MVSBP process. Orderly and timely loading/unloading can effectively lower the cost of production logistics, and enhance the service quality of the MVSBP logistics system. That is, the logistics system for multi-variety small-batch production has achieved high supplier satisfaction, it has a certain guarantee ability, material distribution ability, workshop equipment allocation and management ability, and intelligent storage management ability for multi-variety small-batch production.
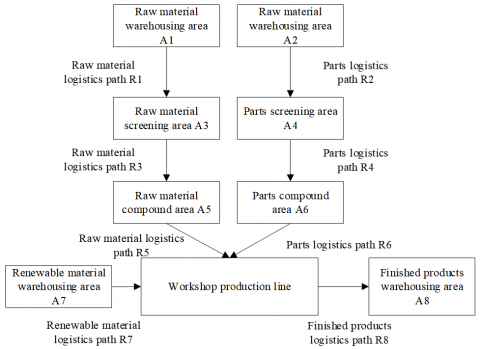
Among the above four factors, the distribution path planning between different functional areas in the workshop is the precondition for analyzing the logistics correlation. Figure 2 presents the distribution paths between different functional areas in the production workshop. The correlation analysis facilitates the layout optimization of the workshop. The functional areas are either assistive or responsible for production and manufacturing. The logistics volume of each functional area can be derived from the distribution paths between them, and the demand for each production material per unit time.
Figure 1. MVSBP logistics system
Figure 2. Distribution paths between different functional areas in the production workshop
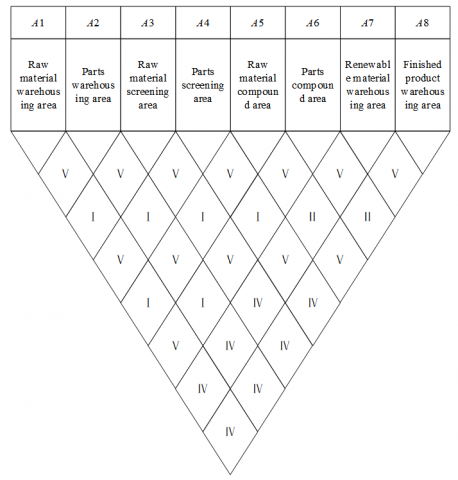
For production materials like raw materials or parts, a few recyclable pollutants and wastes may be generated during the logistics process and the entire process of MVSBP. To realize green production, the intensity of the recycling logistics of such pollutants and wastes was neglected. Without considering the logistics volume of assistive functional areas, the authors only fully considered the logistics volume between the functional areas responsible for production and manufacturing. Then, the logistics intensity between functional areas is illustrated by Figure 3.
Figure 3. Logistics intensity between functional areas
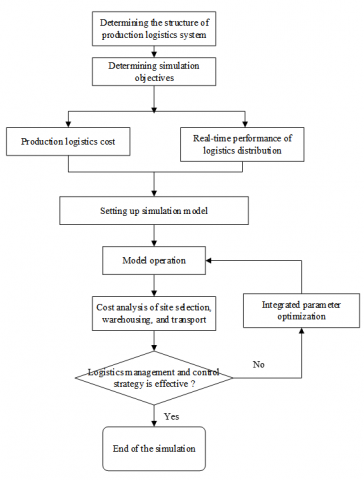
The simulation of the MVSBP logistics system relies on computer and other technologies to duplicate the features and functions of the real-world production logistics system, and sets up a model capable of emulating the logistics service activities of the system. The purpose of the simulation is to model the MVSBP logistics system, and simulate and solve the thorny issues in various logistics activities of the real-world system through experiments. Figure 4 provides the simulation steps of the MVSBP logistics system.
The simulation of the MVSBP logistics system needs support from suitable software. The common simulation software includes Flexism, Witness, ShowFlow, and AutoMod. Here, Flexism is selected for simulation modeling of our MVSBP logistics system, given its superiority in three-dimensional (3D) image processing, artificial intelligence, and data mining. Flexism can provide various physical units, such as mechanical equipment and transportation equipment. The physical models established by the software can display 3D effects, and verify the feasibility of the management and control strategy for the production logistics system more intuitively and systematically. On this basis, it is possible to design the best logistics paths, and optimize the logistics management and control for the real-world production logistics system.
Figure 4. Simulation steps of the MVSBP logistics system
So far, the research into the simulation and integrated design of production logistics systems mostly tackle problems like site selection-path design, site selection- warehousing, and warehousing-path design. Little attention is paid to the problem of site selection-path design -warehousing. In fact, this problem is frequently encountered by real-world production and manufacturing enterprises in the quality management and control of production logistics, and boasts profound research and application values.
The existing studies on site selection-path design-warehousing mostly focus on single-variety large-batch products, and tackles the logistics management and control in a single cycle with a single service object, although there are multiple cycles and service objects. What is worse, the influence of real-time logistics distribution on the swiftness of logistics management and control is largely overlooked. As a result, the final logistics management and control strategy rarely meet the production efficiency required for the full process of the MVSBP.
In response to the above problems, this paper builds an integrated optimization model for the site selection-path design -warehousing of MVSBP logistics. Apart from the production logistics cost, the real-time performance of logistics distribution was taken as a design objective. Under the premise of the accuracy and suitability of the model, the site selection, warehousing, and path design of logistics management and control are optimized synthetically to swiftly respond to the production efficiency requirements of the entire production and manufacturing process, and to ensure the practicality and effectiveness of the design scheme.
Our research on the site selection-path selection- warehousing of the MVSBP logistics is based on a three-echelon production logistics system with one upstream production workshop, several candidate production logistics centers, and several functional areas of the workshop. In the system, the geographical location of each logistics node and destination node has been preset. The workshop and production logistics centers constitute the primary distribution system. The production logistics centers and the functional areas form the secondary distribution system. Out of the candidate production logistics centers, reasonable centers should be selected, with their capacities determined, to serve as the intermediate nodes between the workshop and its functional areas. The production logistics services are driven by the stochastic demand of the functional areas. In each period, every functional area has a certain demand for different production materials, which obeys the preset production arrangement. In addition, each production logistics center needs to establish strategies for warehousing control and logistics services according to the demand of the functional areas.
Firstly, the site selection cost of the integrated optimization model for the site selection-path design-warehousing of MVSBP logistics was analyzed as follows: Out of the candidate production logistics centers, several centers with suitable capacities are selected and constructed. Let gmj denote the construction cost of center j with the capacity level m. Then, the state of the center can be described by a binary function:
$V_j^m=\left\{\begin{array}{l}1, \it { if center }\ j \text { is open with the capacity level }\ m \\ 0, \it { otherwise }\end{array}\right.$ (1)
Then, the site selection cost can be calculated by:
$G_1=\sum_{j \in J} \sum_{m \in M_j} \,g_j^m \cdot V_j^m$ (2)
Let J be the set of candidate centers; T be the set of multi-variety products; βjt be the safety coefficient of production material t in center j at the fixed warehousing level in the research period; Koj be the order lead time of center j in the research period; ψlt be the standard deviation of the demand of functional area l for material t in each production cycle of the research period; Fjt be the warehousing cost per unit of production material t in center j in the research period; mdl be the total number of production cycles in the research period; λlt be the mean demand of functional area l for material t in each production cycle of the research period; Tj be the fixed cost of center j ordering products from the workshop each time. Then, the state of material distribution to each functional area can be described by abinary function:
$B_{j l}=\left\{\begin{array}{l}1, \it { if \;production \;line\; node } \;l \text { is assigned to center } j \\ 0, \it { otherwise }\end{array}\right.$ (3)
Then, the warehousing cost of each production material can be calculated by:
$\begin{aligned} & G_2=\sum_{j \in J} \sum_{t \in T} \beta_{j t} \cdot \sqrt{K o_j \cdot \sum_{l \in L} \psi_{l t}^2 \cdot B_{j l}} \cdot F_{j t} \cdot V_j^m+ \\ & \sum_{j \in J} \sum_{t \in T} \sqrt{m_{d j} \cdot \sum_{l \in L}\left(\lambda_{l t} \cdot B_{j l}\right) \cdot T_j \cdot F_{j t}} \cdot V_j^m\end{aligned}$ (4)
Let SH be the logistics cost of a vehicle per unit distance; elk be the logistics distance from node l to node k; g be the fixed cost of dispatching a vehicle; Uo be the number of vehicles being dispatched in production cycle o, which equals the number of paths in cycle s; slt(o) be the actual demand of functional area l for production material T; USH be the maximum load of a vehicle; ej,0 be the transport distance from center j to the workshop. Then, the correlation between functional areas can be described by a binary function:
$S_{l k q}=\left\{\begin{array}{l}1, \it { if \;node }\; l \text { is the antecedent node of node } \;k\; \it { on\; path } \;u \\ 0, \it { otherwise }\end{array}\right.$ (5)
Let O be the set of cycles, i.e., the research period. Then, the transport cost can be calculated by:
$\begin{aligned} & G_3=\sum_{o \in O}\left(S H \cdot \sum_{u \in U} \sum_{l \in N} \sum_{k \in N} e_{l k} \cdot S_{l k u o}+g \cdot U_o\right)+ \\ & \sum_{j \in J} \sum_{t \in T}\left(\begin{array}{l}I N T\left[\sum_{o \in O} \sum_{l \in L}\, s_{l t}(o) \cdot B_{j l} / W_{j t}\right] \cdot \\ I N T\left[W_{j t} / U_{S H}\right] \cdot\left(2 S H \cdot e_{j 0}+g\right)\end{array}\right) \cdot V_j^m\end{aligned}$ (6)
Let olk=elk/ulk be the transport time from node l to node k. Then, the objective function for the time cost of the production logistics can be expressed as:
$G_4=\sum_{o \in O}\left(\left(\sum_{u \in U} \sum_{l \in N} \sum_{k \in l} o_{l k} \cdot S_{l k u o}\right) / U_o\right) m_{d l}$ (7)
This paper took the logistics management of multi-variety small-batch production of ceramic blank in pottery and porcelain factory as the example to simulate the logistics system of multi-variety small-batch production. The processing of porcelain blanks involves the following operations: Firstly, the mud in the warehousing area is compressed into blanks. Then, the blanks are dried in an oven. After that, some dried blanks are sent to the automatic printing area for printing, and the rest are directly sent to the cage area for baking.
From the above processing flow, it can be learned that compression, demolding, drying, and glazing are four closely correlated operations. Meanwhile, caging, printing, and firing also have strong correlations. Material exchanges and logistics are frequent between different functional areas.
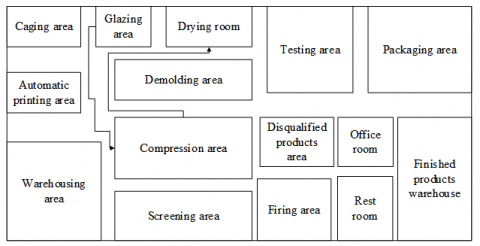
Figure 5. Original layout plan of the production workshop
As shown in Figure 5, caging, printing, and firing areas are separated by compression and demolding areas. The separation adds to the transport demand of vehicles, and results in many crossing points between logistics paths, making it very likely for the paths to be clogged. Besides, the firing area is very close to the office room and rest room. The high temperature of the firing area poses a danger to the working and rest of the staff. The office area and rest room should be far from the firing area. To sum up, the original layout of the porcelain blank processing workshop is unreasonable.
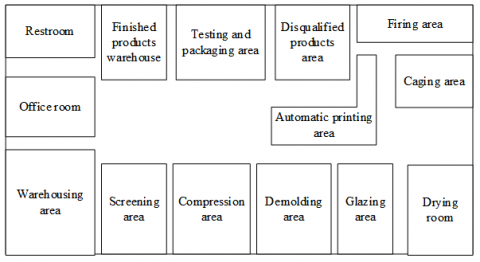
During the layout optimization, it is important to consider the area of each functional area. According to the actual condition of the processing workshop, a west-east logistics channel was designed to facilitate daily management and logistics activities, reducing the congestion probability of the logistics paths. Then, the testing area was merged with the packaging area to save space. For better ventilation, the firing area and drying room were arranged at the corners, aiming to reduce the impacts of the high-temperature environment on the working and rest of the staff and the semi-finished products (Figure 6).
Figure 6. Optimized layout plan of the production workshop
Table 1. Waiting time of production materials for transportation after the optimization
|
Name of functional area |
Minimum waiting time (s) |
Maximum waiting time (s) |
Mean waiting time (s) |
|
Screening area |
2.01 |
629.17 |
248.51 |
|
Compression area |
3.85 |
362.74 |
136.29 |
|
Demolding area |
3.69 |
695.13 |
328.51 |
|
Drying room |
3.46 |
308.29 |
139.06 |
|
Glazing area |
0.25 |
271.95 |
58.41 |
|
Automatic printing area |
0.21 |
236.74 |
22.95 |
|
Caging area |
0.36 |
695.18 |
136.29 |
|
Firing area |
0.26 |
334.52 |
114.71 |
|
Total |
14.09 |
3533.72 |
1184.73 |
Table 2. Mean waiting time before and after optimization
|
Name of temporary storage |
Pre-optimization mean waiting time (s) |
Post-optimization mean waiting time (s) |
|
Pre-screening temporary storage |
258.14 |
291.35 |
|
Post-screening temporary storage |
369.27 |
102.35 |
|
Pre-compression temporary storage |
135.05 |
/ |
|
Post-compression temporary storage |
63.29 |
/ |
|
Pre-demolding temporary storage |
5.13 |
/ |
|
Post-demolding temporary storage |
96.18 |
/ |
|
Pre-drying temporary storage |
33.52 |
/ |
|
Post-drying temporary storage |
68.29 |
239.72 |
|
Pre-glazing temporary storage |
138.47 |
306.95 |
|
Post-glazing temporary storage 1 |
192.61 |
184.37 |
|
Post-glazing temporary storage 2 |
352.94 |
315.05 |
|
Post-glazing temporary storage 3 |
167.42 |
176.59 |
|
Pre-automatic printing temporary storage |
14.26 |
58.15 |
|
Post-automatic printing temporary storage |
147.28 |
36.29 |
|
Pre-caging temporary storage |
63.29 |
/ |
|
Post-caging temporary storage |
59.18 |
/ |
|
Pre-firing temporary storage |
67.35 |
/ |
|
Post- firing temporary storage |
42.57 |
/ |
|
Pre-testing temporary storage |
3.19 |
/ |
|
Pre-packaging temporary storage |
48.16 |
136.29 |
|
Total |
2325.59 |
1847.11 |
Table 3. Vehicle transport distance before and after optimization
|
Vehicle number |
Pre-optimization transport distance |
Post-optimization transport distance |
Difference |
|
1 |
8136.42 |
6352.98 |
1783.44 |
|
2 |
53623.08 |
51243.47 |
2379.61 |
|
3 |
21956.27 |
18329.52 |
3626.75 |
|
4 |
41523.62 |
32162.86 |
9360.76 |
|
5 |
12635.08 |
12433.84 |
201.24 |
|
6 |
56951.37 |
42539.42 |
14411.95 |
|
7 |
10522.46 |
7261.53 |
3260.93 |
|
8 |
45812.17 |
37482.19 |
8329.98 |
|
9 |
33629.42 |
29635.74 |
3993.68 |
|
10 |
16235.84 |
13263.81 |
2972.03 |
|
Total |
301025.73 |
250705.36 |
50320.37 |
The time of the disqualified products area was neglected, because the blanks in this area do not affect the subsequent operations. Table 1 presents the waiting time of production materials for transportation after the optimization.
Table 2 compares the mean waiting time of production materials for transportation before the optimization of site selection – path design – warehousing with that after optimization.
As shown in Table 2, the total mean waiting time of production materials for transportation before the optimization of site selection – path design – warehousing was 2,325.59s. After the optimization, the total mean time was reduced by 478.48s to 1,847.11s. It’s verified that the average waiting time can be effectively reduced by scientifically adjusting the “site selection – path – storage” arrangements of the logistics of multi-variety small-patch production, therefore, it’s known that the optimization and adjustment of the logistic system of blank processing workshop of ceramic factory were effective.
In addition, Table 3 compares the total transport distances of 10 vehicles in the research period before and after the optimization of site selection – path design – warehousing.
In the same research period, the total transport distance of vehicles dropped from 301,025.73m to 250,705.36m, falling by 50,320.37m. In our model, product demand and vehicle speed are not adjusted, suggesting that the number of enroute porcelain products does not change. Thus, the reduction of transport distance is attributable to the optimization of site selection – path design – warehousing. This also proves that the MVSBP logistics system can be improved effectively through the site selection – path design – warehousing optimization.
Figure 7. Trend of production logistics cost
Figure 8. Trend of time cost
Figures 7 and 8 show the trends of production logistics cost and time cost, respectively. It can be seen that, after the execution of the solving algorithm, the site selection cost, path design cost, and warehousing cost of MVSBP logistics, as well as the time of production logistics, all tended to be stable. The most obvious improvements were achieved for transport cost and time cost. The results demonstrate the effectiveness of adjusting the location of functional areas, and optimizing logistics paths.
This paper explores the management and control of logistics service quality in the whole process of MVSBP manufacturing. After analyzing the factors affecting the MVSBP logistics system of production and manufacturing enterprises, the authors introduced the distribution paths between the functional areas in the production workshop, detailed the simulation steps of the MVSBP logistics system, and selected suitable simulation software. On this basis, the three key elements of MVSBP logistics, namely, site selection, path design, and warehousing, were optimized, and the optimization objective function was presented. Finally, the MVSBP logistics system was simulated on a real case: the production logistics management of a porcelain blank processing workshop.
Through experiments, the original and optimized layout plans of the workshop were displayed. Besides, the authors obtained the waiting time of production materials for transportation after the optimization of site selection – path design -warehousing, compared the mean waiting time of production materials for transportation before and after the optimization, and contrasted the total transport distance of ten vehicles before and after the optimization. The results show that the scientific adjustment of the site selection – path design – warehousing of MVSBP logistics can effectively shorten the mean waiting time. The production logistics system of the porcelain blank workshop was effectively optimized and adjusted.
[1] Yi, L., Gläßner, C., Aurich, J.C. (2019). How to integrate additive manufacturing technologies into manufacturing systems successfully: A perspective from the commercial vehicle industry. Journal of Manufacturing Systems, 53: 195-211. https://doi.org/10.1016/j.jmsy.2019.09.007
[2] Marcone, M.R. (2019). Innovative supply chain in made-in-Italy system. The case of medium-sized firms. The Journal of Corporate Governance, Insurance, and Risk Management (JCGIRM), 6(2): 50-62.
[3] Zhang, Q., Mu, R., Zhang, Z., Hu, Y., Liu, C., Zhang, L., Yu, X. (2020). Competitiveness evaluation of high-quality manufacturing development in the yangtze river economic belt. International Journal of Sustainable Development and Planning, 15(6): 875-883.
[4] Pereira, C., Sachidananda, H.K. (2022). Impact of industry 4.0 technologies on lean manufacturing and organizational performance in an organization. International Journal on Interactive Design and Manufacturing (IJIDeM), 16(1): 25-36. https://doi.org/10.1007/s12008-021-00797-7
[5] Liu, C. (2020). Multi-agent modeling of the collaborative operation of the producer service supply chain under the intelligent manufacturing clusters in the Yangtze river delta. Journal Européen des Systèmes Automatisés, 53(4): 487-492. https://doi.org/10.18280/jesa.530406
[6] Zhou, X., Govindaraju, K., Jones, G. (2018). Monitoring fractional nonconformance for short-run production. Quality Engineering, 30(3): 498-510. https://doi.org/10.1080/08982112.2017.1360499
[7] Kothari, S., Peck, T., Zeng, J., Oblea, F., Votaw, A. E., Dispoto, G. (2015). Simulation as a cloud service for short-run high throughput industrial print production using a service broker architecture. Simulation Modelling Practice and Theory, 58: 115-139. https://doi.org/10.1016/j.simpat.2015.05.003
[8] Papadopoulos, B.K., Sfiris, D. (2014). Adaptive fuzzy estimators in control charts for short run production processes. International Journal of Fuzzy Systems, 16(4): 435.
[9] He, Y. (2021). Fast Job Recognition and Sorting Based on Image Processing. Traitement Du Signal, 38(2): 421-429.
[10] Zhang, P., Su, Q., Li, C., Wang, T. (2014). An economically designed sequential probability ratio test control chart for short-run production. Computers & Industrial Engineering, 78: 74-83. https://doi.org/10.1016/j.cie.2014.10.002
[11] Zhong, J.L., Ma, Y.Z. (2014). Integrated optimization for SPC and maintenance strategy of two-stage series repairable systems oriented to short-run production. Computer Integrated Manufacturing Systems, 20(8): 1959-1968.
[12] Khatun, M., Khoo, M.B., Lee, M.H., Castagliola, P. (2019). One-sided control charts for monitoring the multivariate coefficient of variation in short production runs. Transactions of the Institute of Measurement and Control, 41(6): 1712-1728. https://doi.org/10.1177/0142331218789481
[13] Zhang, P.W., Su, Q., Wang, T.T. (2013). Economic design of VSI control chart for short-run production. System Engineeriing-Theory & Practice, 33(5): 1185-1191.
[14] Naitove, M. (2015). Short-run specialist chases higher productivity while staying lean. Plastics Technology, 61(3): 144.
[15] Bessegato, L.F., Quinino, R.C., Duczmal, L.H., Lee Ho, L. (2012). On-line process control using attributes with misclassification errors: An economical design for short-run production. Communications in Statistics-Theory and Methods, 41(10): 1813-1832. https://doi.org/10.1080/03610926.2010.551451
[16] Li, Y., Chu, F., Feng, C., Chu, C., Zhou, M. (2018). Integrated production inventory routing planning for intelligent food logistics systems. IEEE Transactions on Intelligent Transportation Systems, 20(3): 867-878. https://doi.org/10.1109/TITS.2018.2835145
[17] Chen, J.H., Yan, S., Tai, H.W., Chang, C.Y. (2017). Optimizing profit and logistics for precast concrete production. Canadian Journal of Civil Engineering, 44(6): 393-406. https://doi.org/10.1139/cjce-2016-0401
[18] Lin, K.Y., Yao, Y. (2022). A review of digital twin in logistics: applications and future works. Journal of Engineering Management and Systems Engineering, 1(1): 32-42. https://doi.org/10.56578/jemse010105
[19] Sokolov, A., Syunev, V. (2019). Decision support system for wood fuel production and logistics. In International Scientific Conference Energy Management of Municipal Facilities and Sustainable Energy Technologies EMMFT, pp. 849-857. https://doi.org/10.1007/978-3-030-19868-8_83
[20] Zhang, Z., David, J. (2019). An entropy-based approach for assessing the operation of production logistics. Expert Systems with Applications, 119: 118-127. https://doi.org/10.1016/j.eswa.2018.10.044
[21] Luo, H., Wang, K., Kong, X. T., Lu, S., Qu, T. (2017). Synchronized production and logistics via ubiquitous computing technology. Robotics and Computer-Integrated Manufacturing, 45: 99-115. https://doi.org/10.1016/j.rcim.2016.01.008
[22] Kadłubek, M., Thalassinos, E., Noja, G.G., Cristea, M. (2022). Logistics customer service and sustainability-focused freight transport practices of enterprises: Joint influence of organizational competencies and competitiveness. J. Green Econ. Low-Carbon Dev, 1(1): 2-15. https://doi.org/10.56578/jgelcd010102
[23] Vijayakumar, V., Sgarbossa, F., Neumann, W.P., Sobhani, A. (2022). Framework for incorporating human factors into production and logistics systems. International Journal of Production Research, 60(2): 402-419. https://doi.org/10.1080/00207543.2021.1983225
[24] Straka, M., Hricko, M. (2022). Software system design for solution of effective material layout for the needs of production and logistics. Wireless Networks, 28(2): 873-882. https://doi.org/10.1007/s11276-020-02267-6
[25] Birkmaier, A., Oberegger, B., Felsberger, A., Reiner, G., Sihn, W. (2021). Towards a robust digital production and logistics network by implementing flexibility measures. Procedia CIRP, 104: 1310-1315. https://doi.org/10.1016/j.procir.2021.11.220
[26] Cui, Z.G. (2020). Application research of enterprise production logistics system based on computer simulation technology. In The 2020 International Conference on Machine Learning and Big Data Analytics for IoT Security and Privacy: SPIoT-2020, Volume 2, pp. 420-425. https://doi.org/10.1007/978-3-030-62746-1_63
[27] Lucht, T., Muetze, A., Kaempfer, T., Nyhuis, P. (2021). Model-Based Approach for Assessing Planning Quality in Production Logistics. IEEE Access, 9: 115077-115089. https://doi.org/10.1109/ACCESS.2021.3104717
[28] Kai, Z., Ting, Q., Yanghua, P., Hao, L., Congdong, L., Huang, G.Q. (2017). Cell-level Production-Logistics Synchronization for multi-variety and small-batch Production: A step toward industry 4.0. In 2017 IEEE 14th International Conference on Networking, Sensing and Control (ICNSC), pp. 419-424. https://doi.org/10.1109/ICNSC.2017.8000129
[29] Wang, K., Zhang, F., Wang, W., Qian, Y. (2019). The multi-varieties small-batch gas monitor flexible digital job shop design and integration technology research. In IOP Conference Series: Materials Science and Engineering, 616(1): 012028. https://doi.org/10.1088/1757-899X/616/1/012028