Ghalia Merzougui*![]() | Nadia Boulelouah
| Nadia Boulelouah![]() | Abdelheq Mokhtari
| Abdelheq Mokhtari![]() | Abderraouf Hebira
| Abderraouf Hebira
© 2024 The authors. This article is published by IIETA and is licensed under the CC BY 4.0 license (http://creativecommons.org/licenses/by/4.0/).
OPEN ACCESS
This research aimed to develop computer vision and machine learning models to improve durum wheat quality control in Algeria. Durum wheat is a vital cereal crop in Algeria used for many staple foods. Currently, quality control relies on manual evaluation which is too lengthy and tedious. To address this, models utilizing image processing and 200 image descriptors, including 102 texture features, 8 morphological features, and 90 colour features, were developed to automate classification of durum wheat species, varieties, and impurities. An optimized Support Vector Machine (SVM) model was implemented hyperparameters tuning. The models achieved exceptional performance, classifying durum wheat species with 99% accuracy, varieties with 95% accuracy, and impurities with 94% accuracy. This illustrates the significant potential of tailored computer vision and machine learning techniques to enable automated quality control. The models could be integrated into crop certification workflows, increasing productivity.
durum wheat, quality control, variety/impurity classification, image segmentation, machine learning, hyperparameter tuning
Wheat is indeed one of the most important staple crops globally and for the Algerian population. It is a crucial component of the agri-food industry in Algeria due to the dietary patterns and habits of the population, particularly regarding semolina and flour derived from durum wheat. The significance of wheat in the global food supply chain is evident from its role as a staple food in many low- and middle-income countries, as well as its status as the most frequently cultivated crop in the world [1, 2].
Djermoun showed that the quality seeds of durum wheat has a deep impact on increasing production rates [3]. The quality of seeds is responsible for at least a 10-20% increase in productivity (IFPRI). Seed production demands meticulous care, precise procedures, and advanced technical skills. Ensuring access to high-quality seeds necessitates adherence to plant reproduction regulations. Expanding the number of producers would enable the availability of larger seed quantities for farmers. Implementing quality control measures guarantees the genetic and physiological integrity of seeds throughout the propagation, post-harvest, and storage stages until subsequent planting [4, 5].
Maintaining high quality wheat is essential for the proper functioning of the global food production system. Research conducted by Djermoun, has shown the profound impact of wheat seed quality on improving production rates [3]. One of the main concerns in ensuring this quality is to maintain the purity of the product by eliminating any foreign contaminants. In Algeria, the evaluation and certification of agricultural seeds, including durum wheat, are entrusted to two major agricultural entities: the Cooperative of Cereals and Food Legumes (CCLS) and the National Centre for Seed and Plant Control and Certification (CNCC). This certification process involves a thorough inspection of the harvest/crops.
After delivering their crops to CCLS or CNCC centres in their respective provinces, farmers and seed multipliers submit samples for a detailed analysis. This analysis includes visual and manual inspections as well as categorization of impurities, including inert substances, plant residues, damaged grains, rotten grains, among others. Additionally, various varieties of wheat and other species such as barley, bread wheat and triticale are subjected to scrutiny and quantification in the same sample. It should be noted that this procedure strictly adheres to the standards outlined in the Official Journals of the Algerian Government 88/521 and 249/3 published in October 1995.
Until now, however, seed classification in Algeria has been based on manual visual inspection. It should be noted that a laboratory engineer spends almost four hours to perform this task on a single sample. This method is time-consuming and error prone due to the human element involved and the need for specialist expertise.
Addressing these challenges, adopting cutting-edge technologies such as computer vision and artificial intelligence offers a more effective and accurate solution. The advancement in computer vision techniques and algorithms enables machines to comprehend and interpret visual information from their surroundings. Various articles, such as Velesaca [6], exemplify the potential of computer vision systems and machine learning algorithms for performing complex tasks related to seed quality control. Several studies utilize machine learning algorithms [7-12], while others employ deep learning models [13-18], all of which have yielded promising.
This study aims to develop an intelligent classification model for Algerian Durum wheat varieties, species and accompanying impurities using computer vision and machine learning techniques. This model can be used to create an automated system for wheat seed approval. Our research makes two key contributions: First, we present an efficient image segmentation method using classical techniques, favoured for simplicity and low computing needs while still producing excellent results. Secondly, we improve the Support Vector Machine (SVM) machine learning model through meticulous adjustments like optimal hyperparameter selection and optimal normalization of image descriptors. Overall, this research endeavors to deliver an effective, reliable, and cost-efficient automated classification.
The upcoming section will concentrate on pertinent research work to discover the suitable methods and approaches for our case. This will be trailed by the Materials and Methods segment, which will furnish a thorough record of our strategy and the validation of our findings. Ultimately, we will initiate a discussion of our results and assess the approach we administered.
In this section, an in-depth literature review was conducted, exploring relevant work and publications in the field of AI applications in agriculture, automated seed quality certification, and crop evaluation (harvest assessment). We conducted a comparative analysis of related research studies based on the type of model used, the accuracy achieved, the size of the dataset, the type of imaging device used for data acquisition, and the types of grains to be identified. This comparison is summarized in Table1.
The majority of the articles listed in Table 1 focus primarily on categorizing the most common types of global food grains, including rice, wheat, maize, and cocoa. These categorizations cover various aspects, such as the different varieties of these grains or the detection of impurities. This classification can be done either separately for each type of grain or in a combined manner.
Image acquisition for these models is carried out using devices such as professional cameras, mobile devices or scanners, ensuring that the images are presented in RGB format. Nevertheless, it should be noted that a limited number of studies have used specialized and expensive devices designed to capture spectral or hyperspectral images [19, 20], mainly due to the cost involved. It is pertinent to highlight that traditional machine learning models require manual extraction of descriptors, usually carried out using classical computer vision techniques, to capture various grain attributes such as colour, morphology, texture and others, for training purposes. Note that other studies, like [21], use initial layers of a deep learning model for feature extraction, followed by classification using Machine learning model. In contrast, deep learning models automate this process. While excelling in autonomous feature extraction from raw data, the notable downside of this capability lies in the requirement for extensive training datasets, often numbering in millions, to derive effective features and prevent overfitting. Furthermore, the inherent "black-box" nature of deep neural networks poses challenges in interpreting decision-making processes, especially in applications where interpretability holds paramount importance.
Research efforts have been made to integrate models from both categories, with a primary focus on comparing their performance outcomes, as exemplified by the works of [22-24]. Lopes et al. [22] conducted a study in which they trained a Support Vector Machine (SVM) to classify five different cocoa varieties, achieving an accuracy rate of 84.98%. Subsequently, they assessed the accuracy of the SVM in comparison to ResNet18 and ResNet50 models. Remarkably, the ResNet18 model outperformed the SVM, achieving a significantly higher accuracy of 98.82% following complete retraining on the new dataset. In a separate study documented by Kiratiratanapruk et al. [23], the InceptionResNetV2 model showcased its prowess in terms of accuracy when compared to classical Machine Learning (ML) models. Meanwhile, Koklu, and Ozkan [24] delivered into a comprehensive examination of the accuracy achieved by three distinct models: Artificial Neural Networks (ANN), Deep Neural Networks (DNN), and Convolutional Neural Networks (CNN). Notably, the CNN model demonstrated the highest accuracy among the three. Despite the excellent accuracy obtained, it should be mentioned that this type of models requires massive datasets and extensive computing resources for training. They tend to overfit smaller data sets, unlike traditional ML approaches which can work well with limited data. The hardware requirements of deep learning limit accessibility for many users without access to specialized GPUs or clusters.
Nevertheless, Khatri et al. [7] attempted to merge many classical models, leveraging the strengths of each through the application of the hard voting technique. Their ensemble machine learning model outperformed each of the individual models tested separately, demonstrating an increase in accuracy. but this type of models has drawbacks centred on computational requirements and extended training times, especially as the ensemble size increases. In addition, if the base models have similarities or share common flaws, the whole may fail to deliver significant improvements.
Regarding the realm of research employing deep learning models, it's noteworthy to distinguish three distinct subcategories: custom Convolutional Neural Network (CNN) models, pre-trained CNN models using transfer learning (such as VGG16, ResNet, AlexNet), and advanced CNN models exemplified by YOLO v5 and v7. The first two subcategories require the segmentation of composite images containing multiple grains into individual images. This segmentation task is performed using conventional techniques like thresholding and Watersheding, with thresholding being the prevailing choice due to its simplicity and efficiency, as documented by Velesaca et al. [6]. However, it's important to acknowledge that the efficacy of this method is more pronounced when objects within the image do not overlap. In practice, thresholding can be supplemented by pre-processing and/or post-processing steps aimed at improving image quality and, consequently, the classification accuracy of the model.
Remarkably, custom CNN models, such as SeedNet [14] and CNN64 [25], have demonstrated marginally superior performance in comparison to pre-trained models. This phenomenon can be attributed to the reduced number of model parameters and the inherent simplicity of recognizing objects (grains) within the images. The complexity of tuning hyperparameters in deep learning models, whether custom or pre-trained, lies in the nuanced process of selecting optimal configurations for these hyperparameters, including learning rates and batch sizes, which are essential to achieve optimal model performance. This demanding task involves extensive experimentation and substantial computational resources.
Advanced CNN models incorporate sophisticated computer vision techniques, including semantic or instance segmentation, as exemplified by R-CNN and its various iterations [26], along with object detection, as exemplified by the YOLO model and its iterations [19, 27]. These latter models are characterized by real-time responsiveness, although it should be noted that their accuracy tends to be lower when compared to R-CNN models.
The research outlined in Table 1 includes the use of various classical machine learning techniques, that have produced impressive levels of accuracy. In particular, the Support Vector Machine (SVM) model has demonstrated robustness, as evidenced by studies conducted by Kiratiratanapruk et al. [23], Koklu et al. [24], Agarwal and Bachan [9], and Xu et al. [28]. The SVM model achieved varied precision results in the classification of different materials. Specifically, it showed a relatively modest precision of 83% for rice classification [23] and 84% for cocoa classification [22]. Conversely, it showed higher performance in the classification of dry beans [24], wheat [9], and maize [28], with respective precisions of 93.19%, 93%, and 96.46%.
The Artificial Neural Network (ANN) model has also exhibited its proficiency in the works [8, 10-12, 29] achieving accuracies ranging from 95% to 98.2%. Furthermore, de Medeiros et al. [30] achieved a high accuracy of 97% by using the Linear Discriminant Analysis (LDA) model, albeit with a relatively small dataset.
It is noteworthy that in the context of Algeria, a single study conducted by Laabassi et al. [18] has ventured into the realm of deep learning for the classification of two varieties of durum wheat and two varieties of bread wheat. This study achieved an accuracy rate of 95.68% using the DenseNet model. Consequently, our research represents one of the pioneering efforts in Algeria to apply artificial intelligence and computer vision techniques to the classification of durum wheat grain varieties and impurities.
The limitations associated with deep learning, such as the demand for extensive labelled data, significant computational resources, and challenges in hyperparameter tuning, can pose considerable obstacles. In scenarios with a specific and limited dataset size, SVM, with its capacity to perform well with smaller datasets and reduced computational requirements, may present a more practical solution. The simplicity and interpretability of SVM models can also be advantageous, addressing concerns related to the intricate "black-box" nature of deep neural networks. Furthermore, SVM's resilience against overfitting and its ability to handle complex decision boundaries make it a valuable alternative, particularly when faced with the constraints of a constrained dataset and limited computational capacity.
Table 1. Related works uses classical machine learning
|
Paper |
Models |
Extraction Features |
DataSet |
Device |
Seed Kind |
Accuracy |
|
[7] |
KNN, NB, CART, Gaussian, Hard Voting |
Morphology (Area, Perimeter ...etc) |
210 Images 3 wheat varieties Kama, Rosa, and Canadian |
XRay (Kodak Plates) |
Wheat |
95% Hard Voting |
|
[23] |
LR, LDA, KNN, SVM |
Shape, Colour, Texture |
14 rice varieties 2900 each class |
Flatbed Scanner (600Dpi) |
Rice |
83 % SVM
|
|
[8] |
PCA, SVM, ANN |
Texture 125 Feature (LBP, GLCM, GLRM) |
350 Image 7 varieties |
Webcam Logitech |
Wheat |
95% ANN (with 20 features) |
|
[30] |
LDA, RF, SVM |
|
700 Images 7 varieties |
|
soybean seed |
97% LDA |
|
[22] |
SVM, RF Resnet18, ResNet50 |
Colour, Texture 92 features |
3468 images 5 varieties |
CCD Camera 12.6Mp |
Cacao |
84.98% SVM 96.82%ResNe |
|
[24] |
MLP, SVM KNN, DT |
16 features (Shape, dimensional) |
13611 images 7 varieties |
RGB Camera 2.2Mp |
dry beans |
93.19% SVM |
|
[9] |
SVM, KNN MLP, NB |
23 features (colour, Texture) |
60 wheat grains 2 classes (fresh and rotten) |
Mobile Camera |
Wheat |
93% SVM |
|
[28] |
MLP, DT, LDA, NB, SVM, KNN AdaBoast |
16 features (4 shapes ,12 dimensions) Otsu segment |
8080 images 5 varieties |
RGB camera |
Maize |
96.46% SVM |
|
[10] |
ANN |
236 features (morphology, colour, wavelet...) |
3000 images 3 classes |
Camera |
Vitreous, starchy wheat, impurities |
93.46% ANN |
|
[11] |
ICP+ANN + extraction features |
|
720 images 9 classes |
Scanner |
-wheat vs nonWheat -wheatClasses -non-wheat |
- 96.25%,
- 87.50%, - 77.22%, |
|
[12] |
ANN |
12 features |
200 wheat grains |
Camera |
Soft & durum wheat |
MAE = 9.8x10 -6 |
Our research methodology consists of a sequence of modules, beginning with data acquisition, followed by dataset refinement, and culminating in the presentation of model development. Finally, we conclude with a thorough examination of the results and a comprehensive discussion to assess the performance of our model, comparing its findings with related research.
3.1 Data collection
We obtained samples of wheat seed and impurities from two institutions: the Seed Batch Control Centre (CCLS) and the National Crop Control Centre (CNCC). The CNCC samples included four different varieties of durum wheat, namely Vitron, Bousellam, GTA, and Oued El-Bared. Meanwhile, the CCLS samples included three other cereal species, including bread wheat, barley, triticale, and oats. The sample collection also included two types of impurities, mitadine and lean grains. This approach resulted in a total of nine different classes.
The process of capturing images of these grains followed a specific procedure. Grains from each class were photographed using a scanner (brother dcp-t310) and organized into folders corresponding to their respective classes. A black background was used during the scanning process to minimise the effect of shadows. The different types of grain were positioned on an A4 paper before scanning. The scanner's image resolution was configured at 600 dots per inch (dpi), with lighting conditions and contrast both set to 50%. Additionally, the scanning mode was selected as colour with 24 bits per pixel.
3.2 Dataset preparation
The performance of a machine learning (ML) model largely depends on the quality of the dataset used for its training. Several fundamental conditions, such as the adequate dataset size, class balance, and data quality, play a crucial role in determining this quality. Figure 1 illustrates the different steps we took to prepare a high-quality dataset, accompanied by a detailed explanation of each step that follows.
3.2.1 Image segmentation
Image segmentation plays a central role in the identification and classification of various objects within an image, with a particular focus on its utility in the classification of wheat grains. This task can be performed either by classical techniques such as thresholding, edge detection, region-based methods and watershed analysis [31, 32], or by approaches based on artificial intelligence (AI) [33]. The latter category includes unsupervised clustering methods such as k-means and mean shift, and deep learning techniques such as convolutional neural networks (CNN), region-based CNNs (R- CNN), the fastest, fastest R-CNNs. R-CNN, R-CNN mask and object detection.
According to the findings from the literature review, classical methods hold a prominent position in grain classification applications. Techniques such as Otsu's thresholding and the Canny edge detector are widely favoured due to their simplicity and minimal computation time. It's important to highlight that their effectiveness depends largely on meticulous consideration of the environmental conditions to attain optimal results. These achievements are commonly realized in industrial settings where an industrial camera is used within a controlled processing setup, to ensure a stable image background.
In such well-controlled environments, the use of classical image segmentation methods proves to be not only sufficient, but also optimal to achieve the desired objectives. However, it's important to recognize that challenges may arise in scenarios where grains are in close contact, particularly during the scanning of wheat grains that contain different species or impurities. In such complex situations, classical approaches are often limited and may not provide the desired results.
Figure 1. Dataset preparation steps
Therefore, the image segmentation process in our system involves four sequential steps, namely image pre-processing, Otsu's thresholding, Canny edge detection, and image post-processing. These deliberate steps are strategically designed to improve the quality of the segmentation results while effectively addressing potential challenges posed by situations involving multiple grain contacts.
Once the image segmentation has been successfully completed, the next step is to precisely crop the segmented image into discrete individual grain images. This precise partitioning/segmentation/separation allows each grain to be isolated and analysed individually. This meticulous process enables us to curate a dataset that is well suited to efficient classification algorithms and the extraction of key characteristics related to cultivated grains.
Step 1: Image Pre-processing
Prior to the actual segmentation process, we implemented three distinct methods. The "Grayscale" conversion technique was applied to transform the colour image into grayscale. Following this, we employed the Adaptive Median Filter [34, 35] to effectively eliminate salt and pepper noise from the image. Additionally, the Gaussian Filter [36] was utilized to efficiently attenuate high-frequency noise and impart smoothness to the grayscale image.
Step 2: Image Segmentation Combination with Two Methods
In this step, there is a combination of two image segmentation methods: Otsu’s thresholding [37] and Canny edge detection [37, 38]. To improve the accuracy and quality of the overall image segmentation, we use a bitwise OR operator to combine the results of both methods, see (Figure 1).
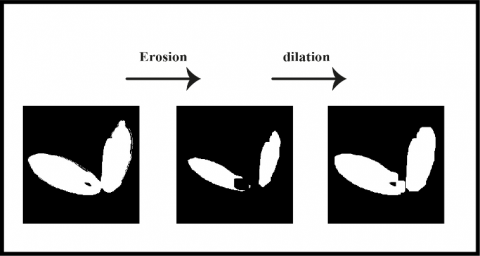
Step 3: Image post-processing
After combining the two segmented images, the resulting image undergoes a sequence of post-processing procedures. In our approach (as shown in Figure 2), we use two different morphological operations: erosion and dilation.
Erosion, a morphological operation, causes the foreground regions of an image's boundaries to contract or erode. Conversely, dilation, the opposite of erosion, expands the boundaries of an image's objects by scanning the image and adding pixels to the edges of the object.
Figure 2. Morphological operations on an image contain multiple touching grains
3.2.2 Contour detection and image cropping
The next step after segmentation is contour detection. Contours are continuous curves that follow the edges of objects in an image. Once the contours are detected, the image is cropped to isolate individual grains. The cropping process uses OpenCV's boundingRect function to obtain the coordinates of the bounding rectangle for each contour. Criteria such as the minimum contour area are used to filter out undesirable contours.
Then, in order to standardize the input for classification while preserving the distinct characteristics of different grains, the cropped grain images are centred within fixed-size black images. A custom function is implemented using Python and OpenCV to generate fixed-size black images, calculate optimal positions for placing the grains at the center, and accurately position the grains within the fixed-size images. (Figure 1).
3.2.3 Dataset equalization and partitioning
As a result of the image segmentation process and subsequent image cropping, we obtained individual images each with a single grain, from the scanned images. However, this process resulted in an unbalanced dataset where the number of images in each class varied significantly. For example, there were 4500 images of barley, 2051 images of oats, but only 750 images of Mitadine. It was noted that this case of unbalanced data leads to the problem of a poorly trained model and therefore the 'Accuracy' evaluation metric can be misleading because it does not reflect the training state of the model.
To avoid this problem, we need to ensure a balanced representation of classes within our dataset. To do this, we followed a systematic approach. Instead of using traditional methods such as data augmentation or resampling, we divided the dataset into three separate groups: one for species, one for impurities, and one for varieties. Each of these groups was meticulously organized to contain an equal number of samples for each class. This deliberate distribution allows us to maintain uniformity in the number of images across all classes, making it easier to train and evaluate fair and efficient models.
Subsequently, we collectively allocated 80% of each group to the training and validation subsets. The remaining 20% were reserved for testing and evaluation, where the performance of the models would be comprehensively evaluated. For clarity, let’s break down the breakdown of each group.
Group 01: Contains a total of 10,000 images of 5 different species. We assigned 8,000 images for training and validation (80%/20%), while the remaining 2,000 images are designated for testing as shown in the Table 2.
Table 2. Dataset partitioning of species
|
|
Durum Wheat |
Bread Wheat |
Barly |
Oats |
Triticale |
|
Train/validation |
1600 |
1600 |
1600 |
1600 |
1600 |
|
Test |
400 |
400 |
400 |
400 |
400 |
Group 02: Contains a total of 4,200 images of 4 different Durum wheat varieties. We assigned 3,360 images for training and validation (80%/20%), while the remaining 840 images are designated for testing as shown in the Table 3.
Table 3. Dataset partitioning of durum wheat varieties
|
|
Bousselam |
Oued el Bared |
Vitron |
GTA |
|
Train/validation |
840 |
840 |
840 |
840 |
|
Test |
210 |
210 |
210 |
210 |
Group 03: Contains a total of 2,860 images of 4 different impurities. We assigned 2,288 images for training and validation (80%/20%), while the remaining 572 images are designated for testing as shown in the Table 4. Note that we have included durum wheat in this category to enable the model to distinguish among the three impurity types and durum wheat grains.
Table 4. Dataset partitioning of durum wheat impurities
|
|
Durum Wheat |
Bread Wheat |
Lean Wheat |
Mitadine |
|
Train/validation |
572 |
572 |
572 |
572 |
|
Test |
143 |
143 |
143 |
143 |
In summary, we meticulously balanced our dataset by creating three distinct groups for species, impurities, and varieties. Each group maintained an equal distribution of samples across all classes to ensure fairness in model training and evaluation. Subsequently, we divided each group into 80% training and validation data, reserving 20% for comprehensive testing and performance assessment. This strategic approach lays the foundation for robust model training and accurate quality assessment of wheat grains.
3.3 Model construction
The construction of our model involves several stages, each of which requires the application of various methods in order to achieve an optimal classification model with a high level of accuracy for durum wheat grains and their different varieties and impurities.
We first discuss the methods used to extract descriptors from the images in our dataset, followed by a review of the normalisation techniques applied to these descriptors.
We then explain the adaptation of the Support Vector Machine (SVM) model for multiclass classification. We present the specific methods used to find the optimal hyperparameters of the model. During the training phase, we also explore different combinations of the extracted descriptors to determine the most effective combination among them.
3.3.1 Image descriptors
In the context of using machine learning and computer vision, descriptors involve capturing and quantifying significant information from the image of interest, which is in our case is the image of raw grains and impurities. These image descriptors play a key role in the ongoing image classification tasks that we are undertaking in our research. We have classified the image descriptors into three distinct categories: morphological descriptors, color descriptors, and texture descriptors [39].
For the morphological descriptors, we extracted eight essential features, including area, perimeter, circularity, aspect ratio, as well as shape factor1(sf1), shape factor2 (sf2), shape factor3(sf3), and shape factor4 (SF4). These descriptors provide insight into the size, shape, and geo-characteristics of the grains.
In terms of colour features, we carried out comprehensive assessments across different colour spaces and channels, such as RGB, HSV, XYZ, LAB, and YCbCr. In our research, we computed statistical metrics such as mean, standard deviation, skewness, kurtosis, and entropy for each of these different colour channels. This approach results in a total of 90 colour-related features.
In terms of textures, we calculate 102 features using both the Gray-Level Run Length Matrix (GLRM) and Gray-Level Co-occurrence Matrix (GLCM) algorithms [40, 41]. For the GLRM, we consider multiple distance and angle configurations, including distances of 1, 2, 3, and 4 units, and angles of 0, π/4, π/2, and 3π/4 radians, effectively capturing texture information across various spatial relationships. Additionally, for the GLCM, we focus on distances of 1 unit and angles of 0, π/4, π/2, and 3π/4 radians, ensuring a comprehensive analysis of texture patterns in our wheat seed image dataset.
The computed image descriptors, comprising a total of 200 features including 102 texture features, 8 morphological features, and 90 colour features, enable comprehensive characterization of the raw grain images. This combined feature set contributes to robust and discriminative image classification.
3.3.2 Features normalisation
In our relentless pursuit of precision in classifying different wheat grains, we’ve ventured into the realm of feature normalization. This crucial step, often underestimated, plays a key role in ensuring that our machine learning model can make the most of the diverse range of image descriptors extracted from our wheat grains images.
First, we explored the Min/Max normalization technique also known as Min-Max Scaling. Its main advantage lies in its ability to place all features on a uniform scale, neatly confined between the values of 0 and 1. This is particularly beneficial when dealing with descriptors that encompass different units and magnitudes. The Max/Min Normalization technique ensures that no feature dominates the learning process due to its inherent scale. Despite these advantages, Min/Max normalization also has its limitations: while it's successful at rescaling features within a certain range, it can be sensitive to outliers. Outliers can have a disproportionate impact on the scaling process, potentially leading to a loss of information or distortions/bias in the data [42].
In our search for robustness in the face of outliers, we turned our attention to Robust Normalization. Robust Normalization takes refuge in the shelter of the median and interquartile range (IQR). In the presence of outliers, which can be a turbulent force in real-world datasets, Robust Normalization stands as a steadfast guardian. It shields our model from the disturbances caused by extreme values. While robust Normalization is effective in reducing the influence of outliers, it can lead to non-zero means and varying standard deviations across features, which may impact model convergence and interpretation.
In contrast, Standardization Normalization, also called Z-Score, ensures a mean of 0 and a standard deviation of 1 for all features, promoting consistent scaling and aiding model convergence. This uniformity in feature scaling allows for fair comparisons and mitigates the dominance of any single feature. Consequently, in our dataset where consistency, robustness, and interpretability are paramount, Z-Score Normalization emerges as the optimal choice, overcoming the limitations of Robust Normalization and improving the precision and stability of our classification model.
3.3.3 Support Vector Machine (SVM) model
Machine learning is a discipline within the realm of artificial intelligence that focuses on developing algorithms and statistical models where computer systems learn and improve their task performance by analysing and adapting to data patterns without being explicitly programmed for those tasks [43]. This technology has been applied in computer vision, which aims to give machines the ability to interpret and understand visual information extracted from images or videos, emulating the human capacity for visual perception and interception [44].
In the overarching context, we look at the application of machine learning and computer vision to the complex task of wheat seed species classification. This task involves the systematic categorization and differentiation of various wheat seed species based on their distinctive visual characteristics.
Among the many machine learning algorithms available, we selected the Support Vector Machine (SVM) [39] as the cornerstone of our classification machine learning model. SVM is known for its proficiency in handling high-dimensional data, which makes it particularly well-suited for the multi-feature descriptors derived from our seeds and impurities images. However, it's important to note that SVM is inherently designed for binary classification tasks, where it seeks to find an optimal hyperplane in feature space to separate two distinct classes.
To harness the full potential of SVM in our multi-class classification challenge, we've strategically employed the One-vs-All (OvA) approach [45]. This technique transforms our multi-class problem into a series of binary classification subproblems, where each class is treated as a separate binary classification task against all other classes.
In the following section, we delve into the process of training our SVM model, using the standardized normalization features and employing the one-vs-all approach to address multi-class classification.
3.3.4 Fine tuning SVM model and training
In almost every machine learning project, we train different models on the dataset and select the one with the best performance. We found that an important factor in the performance of these models is their hyperparameters. Once we set appropriate values for these hyperparameters, the performance of the model can improve significantly. Note that there is no way to know the best values for the hyperparameters in advance, so ideally, we should try all possible values to find the optimal ones. Doing this manually could take a lot of time and resources, so we use the grid search method to automate hyperparameter tuning. In this article, we have used the grid search technique, which is based on the k-fold cross-validation approach.
K-Fold Cross validation: is a fundamental technique widely used to evaluate the performance of machine learning and deep learning models by partitioning the dataset into ‘k’ subsets (folds) of equal size. The model is trained and evaluated ‘k’ times, with each fold serving as a validation set once, while the remaining folds are used for training. This process ensures that each data point is part of the validation set exactly once, allowing for a comprehensive evaluation of the model’s performance [46].
The choice of K should strike a balance between the representativeness of each fold and computational efficiency. In our research, we carefully considered this balance and decided to use K = 5 as the number of folds for our experiments. This choice ensured a meaningful evaluation of model performance while making efficient use of our computational resources.
Grid Search: is the process of performing hyperparameter tuning in order to determine the optimal values for a given model [47, 48]. We pass predefined values for hyperparameters to the grid Search function. We do this by defining a dictionary in which we mention a particular hyperparameter along with the values it can take. The Grid Search method tries all combinations of the values passed in the dictionary and evaluates the model for each combination using the Cross-Validation method. Hence after using this function, we get the accuracy/loss for each combination of hyperparameters and we can choose the one with the best performance. C and kernels are some of the hyperparameters of an SVM model that we are interested in this article.
kernel: It represents the type of kernel to use (RBF is the default). Choosing the right kernel is crucial, and each kernel has its own advantages. For example, in the case where the dataset is linearly separable, it is preferable to use the linear kernel. In the case where the dataset has several classes, the best choice is the RBF (Radial Basis Function) because it supports projection into high-dimensional spaces. Note that this choice is more questionable in terms of computing power.
Figure 3. Scheme of 5-Fold Cross validation with SVM for optimal hyperparameters
C: This is the precision regularization parameter. If the C is high, we will choose a hyperplane with a smaller margin, so that the classification error rate will be lower. The use of this hyperparameter helps to avoid overfitting.
In the model training phase, our primary goal is to optimize the hyperparameters of the Support Vector Machine (SVM) model for optimal performance. This essential step involves K-Fold cross-validation with K set to 5, which allows us to rigorously assess the model's performance while preventing overfitting.
Within the K-fold cross-validation framework, we conduct an in-depth grid search, systematically testing a range of 'C' values (0.01, 0.03, 0.1, 0.3, 1, 3, 10, 30, 100, 300) and experimenting with different kernel functions, including linear and radial basis function (RBF). Note that the rest of the hyperparameters are set to their default values. This meticulous process aims to uncover the optimal hyperparameter settings that best suit our unique classification challenge (Figure 3).
The result of our grid search with cross-validation revealed the ideal hyperparameters for each dataset. For the species dataset, 'C' was set to 30, with a linear kernel. In contrast, for the variety’s dataset, 'C' was set to 100, using the linear kernel. Finally, for the impurity’s dataset, 'C' was set to 3, using the linear kernel. These carefully chosen hyperparameters serve as the cornerstone of our SVM models, ensuring that they are fine-tuned for their respective classification tasks.
The confusion matrix is a table layout that visualizes the performance of a model, the actual target values and model output values are compared in this matrix, which has the same number of rows and columns as classes. where True Positive (TP) is the instances that are correctly classified as positive by a classification model, True Negative (TN) The instances that are correctly identified as negative by a classification model, FalsePositive (FP): The instances that are incorrectly classified as positive by a classification model, False Negative (FN): The instances that are incorrectly classified as negative by a classification model. We use the information in this matrix to calculate various performance metrics, including precision (1), recall (2), F1 Score (3), and accuracy (4), to evaluate the effectiveness of the classification model used in our study.
Precision (1): for a specific class is the ratio of true positive predictions for that class to the total predicted positives for that class. It provides insights into the model's ability to avoid false positives specifically for the considered class.
$Precision =\frac{T P}{T P+F P}$ (1)
Recall (2): for a specific class is the ratio of true positive predictions for that class to the total actual positives for that class. It measures the model's ability to capture all relevant instances of the considered class.
$Recall =\frac{T P}{T P+F N}$ (2)
F1-Score (3): is the harmonic mean of precision and recall, offering a balanced measure that considers both false positives and false negatives.
$F1 Score =\frac{2 * \text { precsion } * \text { Recall }}{\text { precsion }+ \text { Recall }}$ (3)
Accuracy (4): is the percentage of correct predictions out of the total number of predictions made by a model, it gives an overall measure of how accurate the model is in its classifications.
$Accuracy =\frac{T P+T N}{T P+T N+F P+F N}$ (4)
4.1 Results and discussion
During the training of the SVM model, we applied the one-Vs-all technique with scaled features normalized by the Z-score method. Five combinations of features (namely colour, texture, morphological, colour + texture, and combined all Features) were prepared to determine which combination gave the highest accuracy. The test results are shown in Table 5.
Table 5. SVM Accuracy with different features combination
|
|
Accuracy |
||
|
Features |
Species |
Impurities |
Varieties |
|
Colour |
96.9 |
92.3 |
85.83 |
|
texture |
94.45 |
79.37 |
77.26 |
|
Morphological |
90.4 |
71.15 |
56.54 |
|
Colour + texture |
98.45 |
94.23 |
94.52 |
|
Combined all |
99 |
93.88 |
95.55 |
The analysis revealed that colour features alone were highly effective for species classification with 96.9% accuracy (4) and impurity detection (92.3%) by capturing unique colour patterns, but less optimal for variety classification (85.83%).
Texture features significantly contributed to species classification (94.45%) by identifying textural variations, yet struggled to differentiate subtle impurity (79.37%) and variety (77.26%) differences.
While morphological features excelled at species classification (90.4%) through structural characterization, they lacked specificity for precise variety and impurity distinctions.
Ultimately, combining complementary colour and texture features enabled high accuracy across all categories - species (98.45%), impurities (94.23%), varieties (94.52%) by integrating distinguishing textural and morphological traits.
This nuanced accuracy breakdown underscores the pivotal role of feature selection in optimizing SVM model performance, emphasizing the effectiveness of combined features in achieving superior classification outcomes across species, impurities, and wheat varieties.
For a more detailed evaluation of the model, we analyse the results using the confusion matrix for each dataset, namely impurities, varieties, and species. In Figure 4, we observe that our SVM model, after a fine-tuning process, has achieved a remarkable and competitive classification performance of barely species compared to the deep learning model Bayram and Yildiz [49]. The performance was evaluated using the F1 score see (3), which ranged from 98.62% to 99.75%. It is important to note that there is a very small variation between precision and recall for the different species classes, as well as for the classes corresponding to impurities.
Regarding the impurity classes in Figure 5, we found that the bread wheat and lean wheat classes were classified very satisfactorily, with high precision values of 96.57% and 96.47%, respectively. Conversely, the "mitadine" and durum wheat classes obtained slightly lower values, about 6% to 4% less than the first two classes. This classification discrepancy can be attributed to the physical similarities between durum wheat and mitadine types. Mitadine are altered durum wheat kernels that the model sometimes struggles to distinguish from regular durum wheat. Specifically, 8 mitadine images were misclassified as durum wheat and 9 durum images as mitadine, resulting in recalls of 92.30% and 90.20% respectively. This indicates the need to re-examine the extracted features or expand the dataset size. Refining the features or training examples could potentially improve the model's ability to make nuanced distinctions between these physically similar wheat classes.
Figure 4. Confusion matrix of the best model for species
Figure 5. Confusion matrix of the best model for impurities
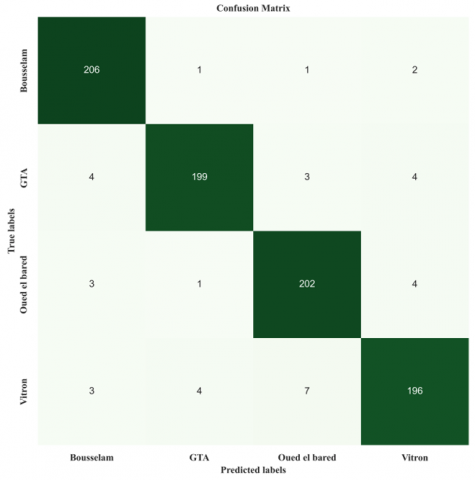
Figure 6. Confusion matrix of the best model for varieties
Regarding variety classification in Figure 6, our SVM model identified the "Vitron" variety with a slightly lower accuracy. On the other hand, the model achieved a higher recall of 96.19% for the "Oued el Bared" variety. This superior performance can be explained by the distinct colour and morphological characteristics of this variety compared to others.
To ensure the relevance and credibility of our model, we make a comparison with similar work results (presented in Table 6). In this comparison, we try to identify recent research studies that closely align with our own work, focusing on grain types (specifically, Durum wheat and its varieties, along with impurities).
Table 6. Comparison the accuracy of SVM with similar work
|
Paper |
Year |
Wheat Kind |
Accuracy |
|
[7] |
2022 |
3 varieties |
95.0% |
|
[8] |
2022 |
7 varieties |
95.0% |
|
Our SVM |
|
4 varieties |
95.55% |
|
[9] |
2023 |
2 impurities |
93% |
|
[10] |
2019 |
3 Impurities |
93.46% |
|
Our SVM |
|
3 impurities |
94.23% |
|
[18] |
2021 |
Vitron variety |
80.15% |
|
Our SVM |
|
Vitron variety |
93.33% |
Both studies by Khatri et al. [7, 8] in Table 6 used classical machine learning models to classify wheat varieties. Khatri et al. [7] aggregated the results of three models (KNN, Naive Bayes, and Decision Tree) using majority voting to achieve an accuracy of 95%. At the same time, Khojastehnazh and Roostaei [8] compared two models, ANN and SVM, with ANN achieving the highest accuracy of 95%. It is worth noting that our fine-tuned SVM model delivered impressive results, surpassing both of these closely related studies with an even slightly higher accuracy of 95.55%.
Regarding research similar to ours in terms of classification of impurities associated with wheat and using SVM as a model, we can mention the works of Agarwal and Bachan [9] and Kaya and Saritas [10], both of which achieved an accuracy of 93%. However, our improved SVM model achieved a superior accuracy of 94.29%. This highlights the effectiveness of our improved SVM model and the credibility of its results.
The last comparison we made involved comparing our model with a deep learning model presented in the study by Laabassi et al. [18]. In this study, the DenseNet model achieved a classification recall of 80.15% for the Vitron variety, while our own model achieved a recall of 93.33% for the same variety. This comparison once again underlines the effectiveness and credibility of our approach, especially for the classification of Durum wheat varieties.
Our approach excels in fine-tuning the SVM model, outperforming more complex counterparts like ensembles and deep networks. This optimized SVM offers advantages, requiring less data and computational resources while maintaining interpretability. Yet, limitations include reliance on handcrafted feature extraction, demanding domain expertise and potentially introducing biases. Additionally, there's a risk of reduced generalization as the model is optimized on a specific dataset with particular conditions.
This study presented a durum wheat classification model for Algerian varieties using computer vision and an optimized support vector machine model. The aim was to improve the efficiency and precision of quality control processes for this vital cereal crop for agriculture.
The proposed approach aimed to effectively differentiate durum wheat species, identify common impurities and accurately categorize the main Algerian durum wheat varieties. Through optimized image processing and extraction of colour, texture and morphological features, optimal hyperparameter search, the developed SVM model achieved strong performance exceeding 95% accuracy for variety classification, 94.23% for impurities and 99% for species.
Future works should focus on evaluating the approach through to develop a method for selecting the most optimal and efficient image descriptors. Moreover, our aspiration is to develop a unified model capable of recognizing and categorizing all three classes species, varieties, and impurities simultaneously. This model aims to streamline the integration into an automated system for the certification process of durum wheat.
We would like to express our gratitude to the CNCC Setif and the CCLS Batna for their collaboration in providing various samples of grain for classification purposes, thus contributing to the development of our dataset. We would like to express our gratitude to agronomical engineers Hebira A. and Saadoune I. for their valuable contribution to data collection, as well as to computer scientists Koulib A., Merzougui H. and Maalem S. for their essential collaboration in developing some methods used in our study.
[1] Amir, Y., Djabri, D., Guellil, H., Youyou, A. (2004). Influence of environmental factors on the quality of wheat grown in Algeria. Journal of Food Agriculture and Environment, 2(2): 315-319. https://doi.org/10.1234/4.2004.217
[2] Erenstein, O., Jaleta, M., Mottaleb, K.A., Sonder, K., Donovan, J., Braun, H.J. (2022). Global trends in wheat production, consumption and trade. In: Reynolds, M.P., Braun, HJ. (eds) Wheat Improvement. Springer, Cham. 47-66. https://doi.org/10.1007/978-3-030-90673-3_4
[3] Djermoun A. (2009). La production céréalière en Algérie: Les principales caractéristiques. Revue Nature et Technologie, 1: 45-53.
[4] Abdelguerfi, A., Talamali, L. (2002). Les enjeux de la production de semences et plants et la nécessité d’une organisation en Algérie. Revue Algérienne d'Agriculture et de Développement Rural, 12(2): 45-58.
[5] Nadimi, M., Hawley, E., Liu, J., Hildebrand, K., Sopiwnyk, E., Paliwal, J. (2023). Enhancing traceability of wheat quality through the supply chain. Comprehensive Reviews in Food Science and Food Safety, 22: 2495-2522. https://doi.org/10.1111/1541-4337.13150
[6] Velesaca, H.O., Suárez, P.L., Mira, R., Sappa, A.D. (2021). Computer vision based food grain classification: A comprehensive survey. Computers and Electronics in Agriculture, 187: 106287. http://dx.doi.org/10.1016/j.compag.2021.106287
[7] Khatri, A., Agrawal, S., Chatterjee, J.M. (2022). Wheat seed classification: Utilizing ensemble machine learning approach. Scientific Programming, 2022: 2626868. https://doi.org/10.1155/2022/2626868
[8] Khojastehnazhand, M., Roostaei, M. (2022). Classification of seven Iranian wheat varieties using texture features. Expert Systems with Applications, 199: 117014. https://doi.org/10.1016/j.eswa.2022.117014
[9] Agarwal, D., Bachan, P. (2023). Machine learning approach for the classification of wheat grains. Smart Agricultural Technology, 3: 100136. https://doi.org/10.1016/j.atech.2022.100136
[10] Kaya, E., Saritas, İ. (2019). Towards a real-time sorting system: Identification of vitreous durum wheat kernels using ANN based on their morphological, colour, wavelet and gaborlet features. Computers and Electronics in Agriculture, 166: 105016. https://doi.org/10.1016/j.compag.2019.105016
[11] Ebrahimi, E., Mollazade, K., Babaei, S. (2014). Toward an automatic wheat purity measuring device: A machine vision-based neural networks-assisted imperialist competitive algorithm approach. Measurement, 55: 196-205. https://doi.org/10.1016/j.measurement.2014.05.003
[12] Sabanci, K., Kayabasi, A., Toktas, A. (2017). Computer vision‐based method for classification of wheat grains using artificial neural network. Journal of the Science of Food and Agriculture, 97(8): 2588-2593. https://doi.org/10.1002/jsfa.8080
[13] Lingwal, S., Bhatia, K.K., Tomer, M.S. (2021). Image-based wheat grain classification using convolutional neural network. Multimedia Tools and Applications, 80: 35441-35465. https://doi.org/10.1007/s11042-020-10174-3
[14] Loddo, A., Loddo, M., Di Ruberto, C. (2021). A novel deep learning based approach for seed image classification and retrieval. Computers and Electronics in Agriculture, 187: 106269. https://doi.org/10.1016/j.compag.2021.106269
[15] Zhu, C., Miao, T. (2022). Research on wheat impurity image recognition based on convolutional neural network. In: Xiang, W., Han, F., Phan, T.K. (eds) Broadband Communications, Networks, and Systems. BROADNETS 2021. Lecture Notes of the Institute for Computer Sciences, Social Informatics and Telecommunications Engineering, 413: Springer, Cham. https://doi.org/10.1007/978-3-030-93479-8_23
[16] Han, K., Zhang, N., Xie, H., Wang, Q., Ding, W. (2023). An improved strategy of wheat kernel recognition based on deep learning. DYNA Ingenieria e Industria, 98(1): 91-97. http://dx.doi.org/10.6036/10686
[17] Zhang, Z., Zuo, Z., Li, Z., Yin, Y., Chen, Y., Zhang, T., Zhao, X. (2023). Real-time wheat unsound kernel classification detection based on improved YOLOv5. Journal of Advanced Computational Intelligence and Intelligent Informatics, 27(3): 474-480. https://doi.org/10.20965/jaciii.2023.p0474
[18] Laabassi, K., Belarbi, M.A., Mahmoudi, S., Mahmoudi, S.A., Ferhat, K. (2021). Wheat varieties identification based on a deep learning approach. Journal of the Saudi Society of Agricultural Sciences, 20(5): 281-289. https://doi.org/10.1016/j.jssas.2021.02.008
[19] Yin Shen, Yanxin Yin, Bin Li, Chunjiang Zhao, Guanglin Li (2021). Detection of impurities in wheat using terahertz spectral imaging and convolutional neural networks. Computers and Electronics in Agriculture, 181: 105931. https://doi.org/10.1016/j.compag.2020.105931
[20] Bao, Y., Mi, C., Wu, N., Liu, F., He, Y. (2019). Rapid classification of wheat grain varieties using hyperspectral imaging and chemometrics. Applied Sciences, 9(19): 4119. https://doi.org/10.3390/app9194119
[21] Naik, N.K., Sethy, P.K., Devi, A.G., Behera, S.K. (2023). Hybrid Enhanced Featured AlexNet for Milled Rice Grain Identification. Ingénierie des Systèmes d'Information, 28(3): 663-668. https://doi.org/10.18280/isi.280315
[22] Lopes, J.F., da Costa, V.G.T., Barbin, D.F., Cruz-Tirado, L.J.P., Baeten, V., Barbon Junior, S. (2022). Deep computer vision system for cocoa classification. Multimedia Tools and Applications, 81(28): 41059-41077. https://doi.org/10.1007/s11042-022-13097-3
[23] Kiratiratanapruk, K., Temniranrat, P., Sinthupinyo, W., Prempree, P., Chaitavon, K., Porntheeraphat, S., Prasertsak, A. (2020). Development of paddy rice seed classification process using machine learning techniques for automatic grading machine. Journal of Sensors, 2020: 7041310. https://doi.org/10.1155/2020/7041310
[24] Koklu, M., Ozkan, I.A. (2020). Multiclass classification of dry beans using computer vision and machine learning techniques. Computers and Electronics in Agriculture, 174: 105507. https://doi.org/10.1016/j.compag.2020.105507
[25] Kozłowski, M., Górecki, P., Szczypiński, P.M. (2019). Varietal classification of barley by convolutional neural networks. Biosystems Engineering, 184: 155-165. https://doi.org/10.1016/j.biosystemseng.2019.06.012
[26] Velesaca, H.O., Mira, R., Suárez, P.L., Larrea, C.X., Sappa, A.D. (2020). Deep learning based corn kernel classification. IEEE/CVF Conference on Computer Vision and Pattern Recognition Workshops (CVPRW), Seattle, WA, USA, pp. 294-302. https://doi.org/10.1109/CVPRW50498.2020.00041
[27] Wang, Y.H., Su, W.H. (2022). Convolutional neural networks in computer vision for grain crop phenotyping: A review. Agronomy, 12(11): 2659. https://doi.org/10.3390/agronomy12112659
[28] Xu, P., Yang, R., Zeng, T., Zhang, J., Zhang, Y., Tan, Q. (2021). Varietal classification of maize seeds using computer vision and machine learning techniques. Journal of Food Process Engineering, 44(11): e13846. https://doi.org/10.1111/jfpe.13846
[29] Javanmardi, S., Ashtiani, S.H.M., Verbeek, F.J., Martynenko, A. (2021). Computer-vision classification of corn seed varieties using deep convolutional neural network. Journal of Stored Products Research, 92: 101800. https://doi.org/10.1016/j.jspr.2021.101800
[30] de Medeiros, A.D., Capobiango, N.P., da Silva, J.M., da Silva, L.J., da Silva, C.B., dos Santos Dias, D.C.F. (2020). Interactive machine learning for soybean seed and seedling quality classification. Scientific Reports, 10(1): 11267. https://doi.org/10.1038/s41598-020-68273-y
[31] Kefali, A., Sari, T., Sellami, M. (2009). Evaluation de plusieurs techniques de seuillage d’images de documents arabes anciens. In: 5ème symposium international Images Multimédias Applications Graphiques et Environnements, pp. 123-134.
[32] Gonzalez, R.C., Woods, R.E. (2018). Digital image processing. 4th Edition. https://www.pearson.com/en-us/subject-catalog/p/digital-image-processing/P200000003224?view=educator.
[33] Vinoth Kumar, B., Sabareeswaran, S., Madumitha, G. (2020). A decennary survey on artificial intelligence methods for image segmentation. In: Venkata Rao, R., Taler, J. (eds) Advanced Engineering Optimization Through Intelligent Techniques. Advances in Intelligent Systems and Computing, Springer, Singapore, 949. https://doi.org/10.1007/978-981-13-8196-6_27
[34] Hwang H., Haddad, R.A. (1995). Adaptive median filters: New algorithms and results. IEEE Transactions on Image Processing, 4(4): 499-502. https://doi.org/10.1109/83.370679
[35] Lin, H.M., Willson A.N. (1988). Median filters with adaptive length. IEEE Transactions on Circuits and Systems, 35(6): 675-690. https://doi.org/10.1109/31.1805
[36] Gedraite, E.S., Hadad, M. (2011). Investigation on the effect of a Gaussian Blur in image filtering and segmentation. Proceedings ELMAR-2011, Zadar, Croatia, pp. 393-396.
[37] Sonka, M., Hlavac, V., Boyle, R. (2013) Image Processing, Analysis, and Machine Vision (4th edition). Cengage Learning.
[38] Canny, J.F. (1986). A computation approach to edge detection. IEEE Transactions on Pattern Analysis and Machine Intelligence, PAMI-8(6): 679-698. https://doi.org/10.1109/TPAMI.1986.4767851
[39] Cortes, C., Vapnik, V. (1995). Support-vector networks. Machine Learning, 20: 273-297. https://doi.org/10.1007/BF00994018
[40] Khojastehnazhand M., Roostaei, M. (2022). Classification of seven Iranian wheat varieties using texture features. Expert Systems with Applications, 199: 117014. https://doi.org/10.1016/j.eswa.2022.117014
[41] Mohanaiah, P., Sathyanarayana, P., GuruKumar, L. (2013). Image texture feature extraction using GLCM approach. International Journal of Scientific and Research Publications, 3(5): 1-5.
[42] Raju, V.N.G., Lakshmi, K.P., Jain, V.M., Kalidindi, A., Padma, V. (2020). Study the influence of normalization/transformation process on the accuracy of supervised classification. 2020 Third International Conference on Smart Systems and Inventive Technology (ICSSIT), Tirunelveli, India, pp. 729-735. https://doi.org/10.1109/ICSSIT48917.2020.9214160
[43] El Naqa, I., Murphy, M.J. (2015). What is machine learning?. In: El Naqa, I., Li, R., Murphy, M. (eds) Machine Learning in Radiation Oncology. Springer, Cham. https://doi.org/10.1007/978-3-319-18305-3_1
[44] Mahadevkar, S.V., Khemani, B., Patil, S., Kotecha, K., Vora, D.R., Abraham, A., Gabralla, L.A. (2022). A review on machine learning styles in computer vision—Techniques and future directions. IEEE Access, 10: 107293-107329. https://doi.org/10.1109/ACCESS.2022.3209825
[45] Crammer, K., Singer, Y. (2001). On the algorithmic implementation of multiclass kernel-based vector machines. Journal of Machine Learning Research, 2: 265-292.
[46] Stone, M. (1978). Cross-validation: A review, Series Statistics, 9(1): 127-139. https://doi.org/10.1080/02331887808801414
[47] Feurer, M., Hutter, F. (2019). Hyperparameter optimization. In: Hutter, F., Kotthoff, L., Vanschoren, J. (eds) Automated Machine Learning. The Springer Series on Challenges in Machine Learning. Springer, Cham. https://doi.org/10.1007/978-3-030-05318-5_1
[48] Syarif, I., Prugel-Bennett, A., Wills, G. (2016). SVM parameter optimization using grid search and genetic algorithm to improve classification performance. TELKOMNIKA; Yogyakarta, 14(4): 1502-1509. http://dx.doi.org/10.12928/telkomnika.v14i4.3956
[49] Bayram, F., Yildiz, M. (2023). Classification of some barley cultivars with deep convolutional neural networks. Journal of Agricultural Sciences, 29(1): 262-271. https://doi.org/10.15832/ankutbd.815230