Nawfal Berbiche*![]() | Mustapha Hlyal
| Mustapha Hlyal![]() | Jamila El Alami
| Jamila El Alami![]()
© 2024 The authors. This article is published by IIETA and is licensed under the CC BY 4.0 license (http://creativecommons.org/licenses/by/4.0/).
OPEN ACCESS
In light of recent mutations and economic volatility stemming from unforeseen global events and increasing security concerns, supply chains are confronted with the complex challenge of fulfilling uncertain customer demands while ensuring sustained value addition. This study introduces a novel approach utilizing fuzzy logic decision-making automation to address and mitigate the impact of current disruptions. By employing if-then scenarios, this methodology facilitates the generation of more accurate predictions and smarter supply planning, enabling effective decision-making, particularly in critical areas such as semiconductor supply sourcing. The integration of Artificial Intelligence within this framework provides dynamic visibility into real-world supply chain operations, thereby aiding in more informed and effective regulatory decisions and fostering continuous improvement. The core innovation of this research lies in the development of a unique Mamdani-fuzzy logic model designed to enhance supply planning. This model extends beyond the realm of efficient inventory management to encompass safer demand forecasting and market segmentation, showcasing its superiority in versatility and effectiveness compared to conventional methods, and leveraging expert knowledge to navigate uncertainties. Through the process of fuzzification, relevant indicators such as Consumption Severity, Market Sensitivity, and Commodity Importance are identified and modeled, with input variables being assigned membership functions and categorized into varying degrees of significance. The Mamdani-inference rules are then formulated, and the output of the fuzzy logic model is defuzzified using the centroid technique to derive precise supply quantities. Simulations conducted in MATLAB demonstrate the model's capacity to convert uncertainty into optimal supply measures across diverse scenarios, thereby enhancing safety and efficiency within the supply chain by minimizing excess inventory and preventing stockouts. This hybrid approach, combining mathematical reasoning with human expertise, validates the efficacy and robustness of fuzzy logic as a potent cognitive and modeling technique for facilitating precise and responsive decision-making in the face of unexpected incidents, imprecision, and qualitative factors affecting the supply chain.
decision-making automation, fuzzy logic, Mamdani approach, MATLAB, predictive models, supply chain planning, uncertainty mitigation
In light of recent sudden mutations and economic instability brought on by unforeseen events and global insecurity, intelligent decision-making automation has become instrumental, especially in overcoming pandemics, border closures, scarcity of raw materials, and war requirements. Supply chain problems affected the global economy, international security, and automotive manufacturing, along with many other industries that suffered from low storage and long delivery lead times for parts and components. Given the growing balance imperative between resilience and efficiency as per the Standard & Poor’s Global 2022 Report, these complex and uncontrollable logistics systems strive harder to satisfy the uncertain demands of individuals, private companies, and even alert government organizations.
COVID-19 provoked unforeseen demand fluctuations, shortages, and transportation restrictions, highlighting the limitations of traditional supply planning models and the need for a new era of agile and intelligent fuzzy automation systems to navigate the uncertainties precipitated by the crisis, ensuring adaptability and resilience. These multidimensional, diverse, and inter-organizational aspects have led to a vast number of metrics and complex data exchanges throughout the chain, making it challenging to assess and improve supply chain performance.
The core problem lies in the conventional rigidity of supply chain models, which often struggle to accommodate the inherent uncertainties and dynamic nature of the modern business environment. The current great power rivalry in a de-globalizing world corroborates how the breaking-point sourcing of critical raw materials and lithography equipment is rare and highly controlled to supply semiconductors, threatening the economic security of even many developed countries [1]. In mathematical modeling of real-world optimization or decision problems, the hypothesis assuming data is exact is unrealistic in the context of unforeseen logistics disruptions, crises, and information vagueness [2]. Artificial intelligence could pave the way for organizations to solve most supply chain disruptions and mitigate impacts by running scenarios using digital twins, generating accurate forecasting, and making fast decisions. Fuzzy logic, with its ability to handle imprecise and uncertain information, emerges as a promising paradigm and effective mathematical method to mitigate the impact of disruptions, grow supply chain value, and reduce risks. It helps develop through inference rules smart inventory-distribution planning and predictive models by considering multiple criteria, relevant indicators, and if-then scenarios. By delving into specific instances and scenarios, we illustrate how fuzzy logic's inherent flexibility and adaptability make it an indispensable tool for decision-makers navigating the turbulent waters of supply chain disruptions to ensure resilience in the face of uncertainty.
This paper elucidates how fuzzy logic, by incorporating nuanced decision-making processes, not only enhances the adaptability of supply chains but also provides a robust framework for proactively addressing disruptions and unnecessary costs. The suggested fuzzy reasoning and decision-making model solves the problem of how to plan and control the supply chain when several network nodes are interrupted at the same time by events that were not expected or could not be avoided [3]. Therefore, human-like decision-making will help supply chain leaders anticipate efficiently required supply quantities to avoid shortages, risks, and loss of competitive advantage through focus and adaptation to three relevant indicators: consumption intensity, market or customer sensitivity, and commodity importance. The main goal of this study is to present a new and improved Mamdani-fuzzy logic model for supply planning that goes beyond just managing inventory efficiently. It also includes safer demand forecasting and market segmentation. This is possible because it is more flexible and effective than other fuzzy types at using expert knowledge in the form of linguistic rules to deal with difficult problems and uncertainty or imprecision. This paper propels the discourse forward by introducing a Mamdani fuzzy reasoning and decision-making model that transcends the limitations of previous approaches. Unlike its predecessors, the Mamdani model excels in capturing and processing the inherent fuzziness and imprecision pervasive in real-world supply chain scenarios, offering a comprehensible and explainable decision-making process, empowering stakeholders to understand and trust the automated supply planning recommendations, and minimizing the impact of unforeseen disruptions.
After presenting the proposed fuzzy logic approach, including its applications in the supply chain, we will define the relevant indicators influencing supply chain performance simultaneously in terms of resilience, efficiency, and safety. Secondly, we will proceed to these indicators’ modeling by fuzzification (Phase 2) within membership functions, reflecting the analysis of their behavior in an uncertain environment. Next, we develop the fuzzy decision rules (Phase 3) to follow with Mamdani defuzzification (Phase 4). Finally, we come up with the simulation results and discussion that would guide supply chain decision-makers.
Fuzzy logic plays an increasing role in decision-making and optimization of supply chain performance as an expansion of traditional crisp logic to better represent and manipulate uncertain and abstract information.
2.1 Historical background
The savvy scientist Lotfi Zadeh introduced fuzzy sets in 1965 for the first time and in the 1970s to deal with vague data through natural language terms and extend from then to fuzzy logic theory [4]. Based on Zadeh’s 1973 introduction of semantic variables and study of fuzzy algorithms for complex systems and knowledge-based decision processes, Pr. Mamdani was the first to apply this theory in practice in 1974 to control a steam engine and boiler combination [5-7]. Later on, 1978 marked the first successful implementation of fuzzy control in a full industrial process [8]. And it was made practically useful in the 1990s in Japan by Sujeno, who introduced fuzzy logic measures, integrals, and controllers in creating driver assistance and braking systems to protect drivers from careless collisions [9]. In the study by Zadeh et al. and Kindo et al. [7, 10], Lotfi ZADEH highlighted fuzzy logic as a basis for the theory of possibilities through the definition of a set of mathematical principles for knowledge representation based on degrees of truth and membership rather than on the net membership of traditional binary or boolean logic (values 0 or 1) [7, 10].
Hence, fuzzy logic reasoning is more insightful and intuitional than classical logic. Considering a fuzzy number is a fuzzy set of real numbers, it helps designers comprehend imprecise and challenging-to-model situations by determining the membership functions of fuzzy sets and the inference rules. A belonging or representative function that gives each object a grade of membership between zero and one describes this class of objects with a continuum of membership grades, as illustrated in Figure 1. In other words, fuzzy logic allows displaying, in many real-world scenarios, the degree of truth of a statement through a range of values between 0 and 1 instead of 0 or 1. Table 1 explains different operations according to the interrelation both between the sets themselves and between the sets and the control objective.
Table 1. Operations of fuzzy sets
|
Meaning |
Set Notation |
Logic Notation |
Membership Function |
|
Equivalence |
$A=B$ |
$\mu_A(x) \Leftrightarrow \mu_B(x)$ |
$\mu_A(x)=\mu_B(x)$ |
|
Implication |
$A \subset B$ |
$\mu_A(x) \Rightarrow \mu_B(x)$ |
$\mu_A(x) \leq \mu_B(x)$ |
|
Complement (Negation) |
$\bar{A}$ |
$-\mu_A(x)$ |
$\mu_A(x)=1-\mu_A(x)$ |
|
Union, OR (Disjunction) |
$A \cup B$ |
$\mu_A(x) \vee \mu_B(x)$ |
$\mu_{A \vee B}(x)=\max \left\{\mu_A(x), \mu_B(x)\right\}$ |
|
Intersection, AND (Conjunction) |
$A \cap B$ |
$\mu_A(x) \wedge \mu_B(x)$ |
$\mu_{A \wedge \mathrm{B}}(x)=\min \left\{\mu_A(x), \mu_a(x)\right\}$ |
Figure 2 explains the different types of membership functions. Explicitly, the validity of a proposition is a degree of membership in a set [11, 12]. Recently, the pandemic accelerated the adoption of digital technologies in supply chain management, such as artificial intelligence, data analytics, and automation, to enhance visibility, agility, and decision-making in their supply chains. The adaptability of fuzzy logic to handle uncertainty, coupled with its capacity to integrate expert knowledge in the form of linguistic rules, scenario analysis, and continuous learning, positions it as a robust tool for enhancing real-time decision-making and resilience to address a wide range of future supply chain disruptions and navigate the complexities of an ever-evolving business and crisis relief landscape. To handle unexpected incidents, uncertain or imprecise information, and qualitative factors impacting supply chain performance, fuzzy logic is a powerful modeling and reasoning technique for more accurate and effective decision-making, like in Figure 3.
Figure 1. Binary versus fuzzy logic [13]
Figure 2. Different types of membership functions [13]
Figure 3. Objective of fuzzy logic
2.2 Fuzzy logic methodology preview
In general, the development of the fuzzy logic model follows a systematic and structured approach aimed at harnessing its adaptability and effectiveness in solving problems, controlling systems, and improving supply planning amidst uncertainties. The methodology unfolds in the key steps of 1) problem definition and variable identification; 2) linguistic variable definition; 3) rule base formulation by expert knowledge; 4) fuzzy inference system (FIS) design; 5) membership function tuning; and 6) validation and performance evaluation.
For an easier understanding, the fourth step of the FIS design is the core of the methodology, as it involves the construction of the Mamdani fuzzy reasoning model. This system integrates linguistic variables, rules, and a fuzzification process, translating input variables into actionable decisions through a set of well-defined fuzzy rules. Hereafter, we can observe the usefulness of fuzzy logic applications in supply chain management.
2.3 Fuzzy logic applications in supply chain
There are many sectors where fuzzy logic models demonstrate smart decision support systems for great performance improvement and uncertainty mitigation. Especially in robotics [14], image recognition [15], the automotive industry, medical fields, and, of course, complex supply chain management. From demand forecasting and inventory management to supplier selection and risk mitigation, fuzzy logic offers a versatile framework to address multifaceted challenges, as detailed in the following supply chain applications.
2.3.1 Demand forecasting
Despite vagueness or imprecise information, fuzzy logic enables more accurate demand forecasts, taking into account time-series prediction [16], customer behavior, seasonality, and volatile market conditions that are difficult to quantify. It helps mitigate uncertainty by incorporating linguistic variables and qualitative inputs, offering a range of possible outcomes rather than just a single point estimate. Predictive models deal often with either quantity or lead time [17].
2.3.2 Inventory management
Fuzzy systems can help supply chain managers in inventory optimization along with uncertainty mitigation of multiple factors, such as demand volatility, lead-time and production capacity variability, or supply disruptions. Combining qualitative matters like risk assessment, quantitative data, and experts’ knowledge makes scientists use fuzzy logic as a powerful tool to make decisions that are more informed on how much inventory to order and to minimize stockouts and excess inventory. In the study by Shekarian et al. [18], the author presented a comprehensive review of fuzzy inventory management works since the 1980s. They investigated notably four main classes related to fuzzy inventory control models: fuzzy economic order quantity (EOQ), fuzzy inventory lot-sizing models, and fuzzy integrated supply chain [19-21].
2.3.3 Supplier selection
Fuzzy logic models allow the evaluation and selection of potential suppliers while simultaneously considering multiple criteria that are difficult to quantify. In addition to quality, cost, and lead time, suppliers’ evaluation processes can involve expertise, subjective preferences, and reputation.
In the study by Lin [22], the author chose the three most significant criteria and established a selective supplier evaluation model through fuzzy logic inference using MATLAΒ. It increases the company’s efficiency and competitiveness through suppliers’ ranking and scale-adapted resource allocation [5, 23].
2.3.4 Risk management
Uncertainty mitigation and risk reduction become more tractable for supply chain decision-makers in complex real-world networks with multiple abrupt disruptions [24]. For example, some disaster response experts can use fuzzy logic to model and simultaneously combine the three criteria of risk detection, severity, and probability of its occurrence. Then they come up with the risk priority number so that they can proactively identify, prioritize, and address risks, along with resilience and efficiency, through multiple quasi-real “If, then” situations [25].
2.3.5 Successful tangible application
A multinational manufacturing company struggling to provide effective solutions to face demand variability and lead time uncertainties through traditional supply planning models often suffers from suboptimal inventory levels and disrupted production schedules. Recognizing the need for a more adaptive approach, the company implemented a Mamdani-fuzzy logic model, incorporating linguistic variables ("high," "medium," and "low"), to represent the imprecise nature of demand forecasts and lead times. Expert-derived fuzzy rules captured the nuanced relationships between these variables, resulting in a significant reduction in excess inventory costs while simultaneously improving customer service levels. It empowered decision-makers to understand and trust the automated recommendations, fostering widespread acceptance and utilization within the organization.
If data availability and precision, easily quantifiable, facilitate the application of deterministic methods, scenarios where the supply chain exhibits uncertainty, information vagueness, and qualitative factors require the use of fuzzy logic that is more appropriate to guide supply chain decision-makers.
2.4 Research gap
This paper contributes a transformative paradigm to the existing body of knowledge by presenting a Mamdani fuzzy reasoning and decision-making model that not only adeptly handles uncertainties in supply planning but also ensures transparency and interpretability in decision outcomes, thereby reshaping the landscape of intelligent automation in supply chain management.
This research not only addresses the exigencies of the current volatile landscape shaped by the pandemic but also paves the way for a new era of intelligent automation in supply planning, ensuring adaptability and resilience in the face of unforeseen challenges and uncertainty or imprecision. The main purpose and novelty of this study is that it offers an inclusive and unique Mamdani-fuzzy logic model to enhance supply planning by integrating simultaneously efficient inventory management, priority-based demand forecasting, and market segmentation, aided by expert knowledge in the form of linguistic rules. It is not only theoretically grounded but also practically applicable to real-world supply chain challenges, providing a potential transformative impact on supply planning under uncertain conditions.
While many studies on fuzzy logic in supply chain management have explored various methodologies, such as Takagi-Sugeno models or adaptive neuro-fuzzy inference systems, emphasizing computational efficiency and accuracy, a notable gap persists in addressing the still-compromised interpretability of fuzzy decision-making models and considering simultaneously consumption intensity along with both product and market or customer importance. The proposed Mamdani fuzzy logic model fills this critical gap by prioritizing interpretability and impactful drivers in supply chain scenarios where decision-makers require a clear understanding of how the model offers practical and transparent recommendations for navigating the complexity of disruptions, like in the COVID-19 pandemic.
3.1 The proposed approach
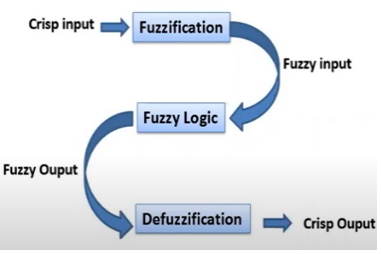
The model starts with data acquisition regarding network information and related criteria. Then the mechanism of fuzzy logic encompasses three main stages displayed in Figures 4 and 5: fuzzification, fuzzy inference, and defuzzification.
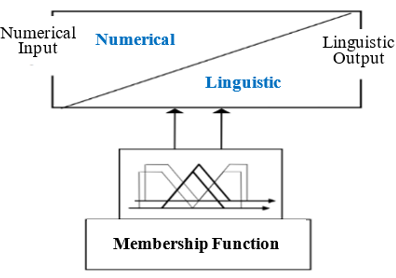
Fuzzification is the process that permits the conversion from the real world to the fuzzy world, assigning real data a qualification in natural language [26]. This is the most important step because it lets precise numerical variables or data that describe the relevant criteria be turned into linguistic variables with degrees of membership. This takes into account the fact that real-life situations aren't always precise or certain, as shown in Figure 6.
A practical example of demand forecasting is given for better understanding:
(1) Considering the crisp number “160 units per week” as its numerical input.
(2) Defining linguistic variables (such as "low," "medium," and "high") to represent different levels of demand that capture the qualitative aspects of the numerical input.
Figure 4. Fuzzy logic processing [27]
Figure 5. Fuzzy logic control phases
Figure 6. Fuzzification model
Figure 7. Fuzzy inference styles
(3) Membership functions establish the degree of membership of the numerical or crisp input to fuzzy sets, determining the level of "belongingness" of the input to each linguistic variable (e.g., a triangular membership function for “low” demand might have a peak at 120 units and an extent between 80 and 160 units).
(4) Assessing the degree of membership of 160 units per week for each linguistic variable based on membership functions gives a 0.6 (60%) degree of membership to “medium” demand and 0.3 (30%) to “high” demand.
(5) Numerical input is now transformed into linguistic terms with associated degrees of membership, expressing demand forecasts as “medium (0.6), high (0.3),” meaning a higher degree of association with the “medium” category.
Fuzzy logic models can effectively capture and process vague information by turning clear inputs into linguistic variables with corresponding degrees of membership. This sets the stage for strong decision-making in supply chain management. Next comes the brain part of the fuzzy method, known as the experts’ intelligence or fuzzy inference. It connects the inputs to the outputs to make smart decisions through predefined rules, called inference rules, following the If-Then approach in Figure 7. This process justifies why this discipline necessitates a specific level of knowledge and know-how to elaborate on and analyze the models expertly. In our study, we adopted the Mamdani-style fuzzy inference model using MATLAB.
Consequently, the phase of defuzzification, or the inverse linguistic to real or numerical transition, has to be performed to find out the variable’s precise, crisp value. Following defuzzification, the model suggests supply chain regulation strategies as decision classes for specialists and decision-makers. They can either discover improved decisions through retroaction or confirm and implement the proposed indications, which would consolidate the expertise with the recommendations made. Therefore, we illustrate through simulations how easy it is to use this methodology and how interesting it is to model knowledge toward the automatic decision-making process.
Our project developed a Mamdani fuzzy model as if the expert, often in coordination with the decision-maker, primarily sets the three supply chain indicator inputs and uses a rules-based fuzzy inference. Next, using the linguistic terms of high, medium, and low degrees, which will be translated into digits, we will estimate the optimal supply level through Mamdani defuzzification. The reasons behind this choice over other fuzzy types are its versatility and effectiveness in incorporating expert knowledge in the form of linguistic rules to handle complex problems and uncertainty or imprecision. The subsequent sections will delve into each phase in detail, providing insights into the intricacies of model development, validation, and the potential transformative impact on supply planning under uncertain conditions.
3.2 Indicators modelling by fuzzification
3.2.1 Relevant supply chain indicators
Budgetary constraints and challenging real-world environments triggered by unexpected incidents and disruptions lead to complex supply chain and operations management with multiple volatile factors. Hence, decision-makers in public, private, and non-governmental organizations seek situational intelligence tools and predictive models that enable the optimal supply level to ensure resilience, efficiency, and risk management. In this paragraph, we show three relevant supply chain indicators at the intersection of demand forecasting, inventory, and risk management:
Using the MATLAB software program, we elaborated an automated decision-making model following the fuzzy logic approach. In fact, the required efficient supply will be obtained depending on the analytical conjunction of the three abovementioned supply chain KPIs, as detailed in Figure 8. Data acquisition questions will help the organization find out what is needed to improve supply chain performance in terms of resilience and efficiency, with fewer risks. In other words, answer the question of how much to supply of each commodity for each customer or market in an uncertain environment. The identification of supply level is mostly done by the simultaneous conjunction of the three criteria [3, 4].
Figure 8. Proposed fuzzy model with 3 inputs and 1 output
(1) Consumption Severity (CS): rating the consumption cadences to determine the supply level that would satisfy demand depending on seasonality, operational tempo for production units, or sudden surges in demand due to unexpected incidents and highly complex operations. Thus, changing customer behaviors call for decision-makers to use adequate tools to adapt to recent volatile business, military, and even humanitarian supply chains, such as in disaster response management. It also allows us to cope with many behavioral and environmental hazards, like tactical attrition, fierce competition, and climatic change, which directly affect consumption severity. This push-pull approach would control demand variability and supply levels, ensuring both resilience and efficiency.
(2) Market Sensitivity (MS): assessing the volume of the market shares and benefits that represent a demand point or market for the company or the organization. Due to limited distribution capacity or stocks in dispersed networks, most large companies have to prioritize satisfying their customers through an adequate supply level according to the potential added value or the consequences estimated for each potential distribution problem. Hence, market sensitivity or customer scaling can be the 20% of customers representing 80% of sales value, the market that could cause a drastic fall in demand or conditionate the future of the company, and indeed even operation results or return on investment.
(3) Commodity Importance (CI): measuring the delivered commodity contribution to the organization's core mission success or performance results, along with the severity of the effect of commodity unavailability on the supply chain and the company's operational readiness. This indicator allows decision-makers to estimate the required supply level that helps the most to maintain and develop current or new customers’ loyalty through the degree of satisfaction of their most important requirement.
(4) Efficient Supply (ES): The calculation of the supply index will guide supply chain managers to make the right decisions through a scenario-adapted plan and define the supply index (ES) based on consideration of the cited three relevant criteria: of Consumption Severity (CS), Customer or Market Sensibility (CMS) and Commodity Importance (CI). We will use fuzzy logic to come up with the Efficient Supply Index (ES) by combining the three criteria at the same time. This is because classical logic only gives us a rough idea of what will happen when we look at two possibilities (0 and 1) for each previous indicator, such as presence/no presence, intense/no intense, sensible/no sensible, and vital/no vital.
Efficient Supply Index= Consumption Rate$\wedge$ Market/Customer Sensibility$\wedge$ Commodity Importance= Consumption Rate*Market/Customer Sensibility*Commodity Importance (1)
E S=C S \wedge M C S \wedge C I=C S \times M C S \times C I
To offer adaptive decision-making in quasi-real world supply chain scenarios, this Efficient Supply Index is indeed computed through the identification of the consumption severity related to customer behavior in a high-tempo volatile environment (demand/operation intensity) as well as the estimation of the customers’ value among the global market of the organization (customer or market sensitivity) and the assessment of potential supply disruption risks, including the magnitude of their impacts on their core mission or benefit (commodity importance). To simplify this type of math, the objective of the present article is to show the usefulness of fuzzy logic to plan efficient supply decision-making. Figure 8 summarizes our model as it appears in MATLAB Simulink.
3.2.2 Indicators modelling: fuzzification
Fuzzification permits the stratification and modeling of the indicators through the numerical-to-linguistic conversion of diverse variables characterizing them.
(1) Fuzzy set configuration
In order to make sure that the model accurately represents the supply chain in the real world, the linguistic levels for each indicator were chosen after a careful study of their nature and how they can change. The goal was to find a balance between detail for accuracy and simplicity for ease of interpretation. For instance, in terms of disruption impact severity, customer lines’ shutdown or a shortage of vital commodities are deemed devastating.
The degrees or levels of each supply chain indicator are set in the Tables 2–5.
Table 2. Four Levels of Consumption Severity
|
Consumption Severity |
Description |
|
Extreme |
Controlled competition, maximum consumption rate, total capacity usage, season pick, top operational readiness, and technical and tactical attritions. |
|
High |
High-tempo operations, low competitors’ presence, season start, high mission-capable readiness with technical or tactical attrition. |
|
Medium |
Standard operational cadence, fierce competition, end of season, normal activity without tactical attrition. |
|
Low |
Stable consumption rate with low activity, out-of-season. |
Table 3. Three Levels of Market/Customer Sensitivity
|
Market Sensitivity |
Description and Risk Impact Severity |
|
Strategic |
The best or most loyal customer segment produces most of the revenue, mission success, and new clients. Biggest market shares or added value region (risk of grave damage impact). |
|
Advantageous |
New, impulse and researchers’ customers (risk of serious damage impact) |
|
Normal |
Discount-seekers, lookers, wandering, and need-based customers (low risk) |
Table 4. Three Levels of Commodity Importance
|
Commodity Importance |
Description and Risk Impact Severity |
|
Vital |
It is necessary to produce or supply a service or commodity to satisfy customers for business continuity or top ROI (risk of grave damage impact). |
|
Essential |
Contributing greatly to customer satisfaction, mission success, or company development (risk of serious damage impact). |
|
Useful |
Hampering operational readiness while remaining mission-capable and present to maintain regular customers even with low profit (low risk). |
Table 5. Three Levels of Efficient Supply
|
Efficient Supply (Output) |
Description |
|
High |
Resilient and sufficient supply without stockouts but tolerated few overstocks, especially for vital commodities and strategic customers. It ensures utmost customer satisfaction, optimal performance, and maximum added value in high-tempo operations (to avoid grave damage risks). |
|
Standard |
Enough supply to meet demand through the best supply/demand trade-off with very few stockouts or overstocks (to avoid serious damage risks). |
|
Low |
Standard supply to meet demand within a short lead-time without overstocks (low-incurred risk). |
Figure 9. Membership functions of inputs (µ(CS), µ(MS), µ(CI)) and output (µ(ES))
Table 2 indicates four linguistic levels of consumption severity, mirroring the operational tempo for better forecasting and resilience. The four levels of consumption severity were chosen to capture a finer degree of granularity in controlling the pace of consumption and enhance the model's sensitivity to different degrees of severity. It enables a more nuanced analysis and accurate representation of the supply chain in a hostile environment.
This indicator is usually affected by fierce competition in the business landscape and by human casualties or combat intensity in military or humanitarian operations.
The added value and the severity of the damage impact characterize the categories of market/customer sensitivity, commodity importance, and the required efficient supply, respectively, in Table 3.
To avoid unnecessary complexity without necessarily enhancing the model's predictive accuracy, the choice of three linguistic levels for other indicators is rooted in simplifying assumptions by capturing essential variations that aid in the model's straightforward interpretability and comprehension of the outputs by decision-makers or stakeholders who may not possess an in-depth understanding of fuzzy logic principles.
(2) Membership function: Fuzzification of indicators
Our method uses the belonging functions that the logistician experts have articulated to visually represent each variable’s degree of truth. We will use the trapezoidal membership functions for all the indicators’ modeling, assigning relevant linguistic qualifiers to scale each indicator. All the input and output variables gravitate between three category levels of truth except for the consumption severity with four operational paces. Compared to single peak-triangular functions and high Gaussian functions' sensitivity to extreme value, the choice of trapezoidal membership functions allows greater flexibility, the ability to handle asymmetry and uncertainty, providing distinct control over both rising and falling, and the easier interpretability of gradual transitions that align well with human reasoning. In the supply chain context, the advantages of trapezoidal functions can have significant impacts on decision-making. The membership functions and linguistic terms characterizing the fuzzy subsets of each KPI are detailed successively in Figure 9.
3.3 Fuzzy Inference: Brain of fuzzy logic
3.3.1 Inference rules
According to its etymology, inference is the process of drawing a conclusion or going from statistical sample data or judgment that is regarded as exact to generalizations, as of the population parameters' values, typically with computed degrees of possibility. In mathematical reasoning, fuzzy inference makes it possible to develop a decision through the use of rules described by linguistic terms indicating fuzzy output, as shown in Figure 10. Each IF-THEN form of rule contains two parts: While the “IF” portion is the antecedent, one or more premises or conditions, the “Then” part is the conclusion or the consequence. These rules link linguistic variables together to draw inferences, where the inference engine defines the if-then decision rules applied by the specialists to input variables through the fuzzy operators “OR, AND, or both." When we apply the “And” fuzzy intersection operator, we evaluate the conjunction of the rule antecedents.
1) After the identification of linguistic variables associated with the 3 input indicators (4 levels of consumption severity, 3 levels of market sensitivity, and 3 levels of product importance), the derivation of fuzzy inference rules involves systematically 2) combining these different levels, leading to 36 fuzzy inference rules calculated by the Cartesian product of the linguistic variables associated with each indicator: 4 (Consumption Severity) x 3 (Market Sensitivity) x 3 (Product Importance). 3) Each combination of linguistic variables (if... part) corresponds to a unique fuzzy inference rule, to which 4) a consequent (then... part) is assigned based on the specific decision or action to be taken in response to the combination of linguistic variables. 5) Expert input and domain knowledge: The derivation of fuzzy inference rules is based principally on expert opinion, which can also be upgraded in some cases by iterative refinement of empirical data from the feedback loop after the 6) validation phase to enhance the model's accuracy. The formulation of rules may involve input from supply chain experts who provide their domain knowledge, experience, and insights into how the linguistic variables interact, and the rules are grounded in practical considerations to influence supply chain decisions. For example:
If Consumption Severity is Extreme and Market Sensitivity is Strategic and Commodity Importance is Vital
Then Efficient Supply is High
If……Then
Rule 1: If CS=Extreme and MCS=Strategic and CI=Vital Then ES=High
....
Rule 36: If CS=Low and MCS=Normal and CI=Useful Then ES=Low
So, we introduced (36) Rules as we have the conjunction of 4 consumption severity levels and 3 levels of both market sensitivity and commodity importance, leading to:
$E S I=C S \wedge M C S \wedge C I$ (2)
In the format of:
$\mu_{A \cap B}(X)=\min \left[\mu_A(X), \mu_B(X)\right]$ (3)
The representation of the (36) rules is displayed in Figure 11. The study by Soulhi et al. [27] and more recently in 2022 by Admi Syarif et al. [28] highlighted the utmost importance of a fuzzy medical expert system based on unprecise existing skin symptoms in alleviating human suffering. The system uses the dermatologist specialist's knowledge and know-how to diagnose and provide the patient's severity level for the disease, succeeding in all tests with an accuracy of 95.6%.
Figure 10. Fuzzy inference
Figure 11. (36) Rules view
3.3.2 Mathematical representation
R1: if X1 is A11 and X2 is A12 …. and Xn is A1nthen y is C1
Rm: if X1 is Am1 and X2 is Am2 …. and Xn is Amnthen y is Cm
(1) Rules of inference are formulated like in Figure 12.
X=(X1 , X2 ,........Xn): Vector of inference
A=[Am, n]: Characteristic Matrix
C=(C1, C2, ....... Cm): Result Vector
$\mu_m=\prod_{j=1}^n \mu_{m j}\left(X_n\right)$ (4)
µm: belonging degree to membership function decision class
µmj: belonging degree to membership function criterion
(2) Rules view is displayed in Figure 12 hereafter
Figure 12. Rules' base matrix
3.3.3 Defuzzification
During the defuzzification, fuzzy linguistic variables are translated into numerical digits, characterizing the required efficient supply for each scenario. In other words, the conversion of linguistic terms to real data, or to round off a fuzzy set into a crisp member. This phase is important as, for example, without intelligent measurement of demand forecasting through selective consumption severity and market sensitivity, we can neither define the needed prior supplies to avoid the grave impact of stockouts and cash flow loss due to excess inventory nor simulate properly the possibilities and the promising outcomes that might be engendered.
$E S^*=Y^*=\frac{\int_y y \times \mu(y) d y}{\int_y \mu(y) d y}$ (5)
Figure 13. Centroid method
In this subject, different methods exist in the literature for defuzzification [29, 30]: the Max-Centership Method, the Centroid Method, the Weighted Average Method, and the Mean-Max Method. In our model, we apply the center of gravity method, which considers all the available information illustrated in Figure 13.
To validate that the fuzzy model produces reliable and accurate forecasts for concrete recommendations, we ensure that the previous steps are followed in the right order and that the model is thoroughly tested, verifying the quality and relevance of inputs and the appropriateness of the rule base to the desired outcomes, aided by the expert feedback throughout the model development and results validation. After the first wave of simulation results, we conduct a sensitivity analysis and robustness assessment of the model to evaluate how variations in input indicators impact the outputs. The analysis identified some critical variables that deserve more attention, like the “importance of the product,” that influence the level of supply highly compared to other indicators. Consequently, the model is iteratively refined, resulting, for example, in a proportional adjustment of the “required supply” when the linguistic variable "Product Importance is Vital.”
Compared with other models used in supply chain simulation [31] and forecasting, the advantages offered by the proposed fuzzy model stem from its ability to handle uncertainty or imprecise information, incorporate expert knowledge, and facilitate interpretability for decision-makers in complex, dynamic environments. Fuzzy logic models can also be refined and improved over time through an iterative process. To make sure that other researchers could use our scientific contribution again and again, our fuzzy model followed the steps for using a Mamdani fuzzy logic model in supply chain forecasting. It was unique because it took three different indicators into account at the same time, which will be shown in the next section.
In these simulations, we use a modeling technique that reproduces the behavior dynamics of the proposed configuration to have a better comprehension and control of its evolution concerning the change of dimensions [30] for supply chain improvement. Using the MATLAB software program, we elaborated an automated decision-making model following the fuzzy logic approach. Hence, different combination cases will be treated, searching for global efficiency through each situation intelligence adapted to existing consumption severity, market/customer sensitivity, and commodity importance. We simulate our fuzzy model by introducing the level of the 3 indicators and 36 rules (described above in Section 3.3.1) to feed and get expressive surface views. However, we consider the following simplifying assumptions to facilitate the interpretability of results for decision-makers and enhance understanding of the model: the same weight for each indicator, only three levels for two indicators, and the use of only the trapezoidal membership functions.
The resulting curve visualizes the interrelations between the two axes, representing simultaneously two indicators as inputs while the third is fixed in advance at the medium level [X1, 50, X3], with the Required Efficient Supply Index as output. Next, we will analyze and interpret them to understand the experts' judgment and lessons learned, corroborate their adoptions, and reorient decision-makers.
4.1 Case 1: [CS, MCS, 50] (Figure 14)
The indicator of commodity importance is fixed in advance in Essential, corresponding to its medium level in Figure 15.
Figure 14. Inputs setting with fixed commodity importance: [CS, MCS, 50]
Figure 15. Curve of case 1: [CS, MCS, 50]
Interpretation: The surface view of case 1 makes it easily apparent that when both the consumption severity and market sensitivity indicators are zero or very close to zero, the Efficient Supply Index is at its lowest. However, when one of them is null and the other is medium, or when both of them are medium, the output is medium. Otherwise, the efficient supply quantity is maximum when the consumption severity is extreme or high and the market sensitivity is strategic.
On the other hand, experts inspired by the established rules can perceive that the graph is not symmetrical. It illustrates clearly that the increase in consumption severity from low to medium levels (since CS<10%) impacts the supply level more rapidly and importantly than the market sensitivity does in the two lower levels. But for strategic markets or customers, the required efficient supply is automatically at its maximum since the medium level of consumption severity highlights the utmost importance given to customers’ satisfaction.
4.2 Case 2: [CS, 50, CI]
The indicator of market sensitivity is fixed in advance in Advantageous, referring to its medium level in Figure 16.
Interpretation: The curve of Case 2 has the same tendency observed in Case 1 regarding the minimum Efficient Supply Index when the two indicators of consumption severity and commodity importance are null or close to zero, or medium supply quantity when one of them is medium and the other is null, or when both of them are medium. The efficient supply quantity is maximum when consumption severity is extreme and commodity importance is mostly essential.
However, in opposition to case 1 results, this surface view reveals the great impact of commodity importance on configuring the supply index and, therefore, its climax contribution to mission success and safety through risk mitigation for decision-makers and supply chain leaders. In fact, we observe the exponential surge of required supply either almost automatically when the CI is judged vital or when the commodity's importance is growing from useful to advantageous degrees, even when the consumption severity is very low to null. On the other hand, the same output starts to increase only once the consumption severity approaches a higher degree.
Figure 16. Curve of case 2_[CS, 50, CI]
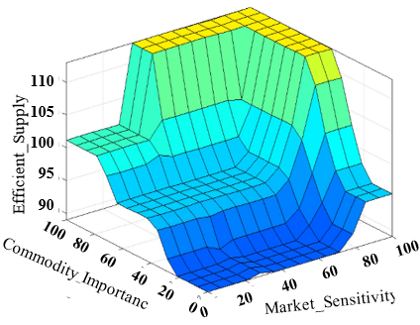
4.3 Case 3: [50, MCS, CI]
The consumption severity is pre-fixed in medium in Figure 17.
Figure 17. Curve of case 3_ [50, MS, CI]
Interpretation: With its smooth low-to-top progression surface, the control graph is different when compared with the two previous ones, characterized generally by three main, almost plain surfaces. They consist of a tiny low, a large medium, and an important top-supply-level section.
However, this curve confirms the pinnacle role of commodity importance in determining the required supply level. To illustrate this, while the supply level remains low and stable until strategic market sensitivity, when the commodity is at a useful degree, the results indicate that the required efficient supply evolves from then, like the same increasing trend of commodity importance, confirming developments observed by Maaref and Barret’s contribution [32, 33].
These simulations' interpretations highlight how the required efficient supply index, following generally only consumption severity, was improved by market sensitivity and, more importantly, except for the strategic customer category, by commodity importance. Furthermore, when we repeat simulations with the same input many times, we get the same surface view of outputs. On the other hand, the model sensitivity is high when we change the levels of product importance, the most influential parameter, because disruptions in “Vital Commodity” could have devastating impacts. Except for two parameters or when changing the membership function shape, the model remains generally robust to transitions in inputs. Compared to the trends observed in real-world humanitarian and military supply chain scenarios, the author, along with other experts, finds that the obtained results demonstrate the model's efficacy in optimizing inventory levels, improving demand forecasting accuracy, and minimizing the impact of unforeseen disruptions.
In contrast to the yes/no possibilities of supply chain factors giving forcibly biased planning due to static visibility, this fuzzy logic model can be used to generate valuable suggestions and manage the required quantity of supply depending simultaneously on operational intensity-based consumption severity scenarios, market segment sensitivity, and commodity importance. This situational intelligence, reinforced by regular validation, feedback, and refinement, helps decision-makers build dynamic visibility for a more responsive, efficient, profitable, and safer supply chain in a volatile environment.
The present contribution shows the significant importance of the integration of artificial intelligence through fuzzy logic in providing a more comprehensive, dynamic visibility of the supply chain for more effective and informed decisions and the continuous improvement of modern organizations. We have presented in this paper a Mamdani-fuzzy logic model that accounts for the vagueness, uncertainty, and complexity of real-world supply chain systems and reduces the impact of abrupt incidents and continued global crisis repercussions, climate change, pandemics, or conflicts’ insecurity.
We built up intelligent fuzzy decision-making automation where human-like judgment can successfully come up with the required efficient supply for various “what-if” scenarios, avoiding traditional binary predictions. The simulations of this invaluable approach combined simultaneously three relevant supply chain indicators: consumption severity, market/customer sensitivity, and commodity importance, which were more impactful. Unlike conventional models that faltered in the face of unprecedented disruptions, the proposed Mamdani model excels in its capacity to embrace uncertainty. By incorporating linguistic variables and expert-derived fuzzy rules, it not only adapts to the dynamic nature of the supply chain but also thrives in scenarios where traditional models decline. The changes on the three axes' surfaces make it clear that the connection between fuzzy logic and supply chain management can turn uncertainty into a set amount of supplies that are needed and help with making decisions that are flexible. The proposed fuzzy logic model has made it possible for the supply chain to be more responsive, efficient, and safe. It does this by connecting demand forecasting, inventory and category management, lowering risk, and making more money.
To sum up, this interface that combines mathematical reasoning with human expertise shows how useful and strong fuzzy logic is, since these simulations would not be possible with the Boolean approach. It paves the way to understand, analyze, and reuse the learning results, confirming fuzzy logic as a powerful modeling and cognitive technique for more accurate and effective decision-making. Because using fuzzy logic in the real world is so important, this study can help close the gap between theoretical progress and practical application. It can do this by showing the model's benefits and gradually incorporating them, even though there may be some problems with integrating them into existing systems and people being resistant to change.
Our perspective is that the fuzzy logic model developed in the current paper can serve as a foundational framework for smart global supply chains like Zara organization [34], which are affected by additional uncertainties. It can also be adapted to address local challenges, such as parking solutions proposed by Tuncer and Yar [35] to get more parking space availability, lower search time, and reduced cost, along with the utmost visitors’ satisfaction. Based on current findings, Mamdani models, with their fuzzy logic and linguistic rules, provide interpretability, flexibility in decision-making, and strengths in capturing uncertainties in supply chain forecasting. Further studies should investigate whether Sugeno models, with their crisp logic, may excel in situations where precise decision-making is crucial.
[1] Teer, J., Bertolini, M., Ritoe, J.A., Heyster, S., Sweijs, T., de Wijk, R., Rademaker, M., Vlaskamp, M., Patrahau, I., Thompson, J., Kim, S., Minicozzi, R., Meszaros, A., Cisco, G., Gorecki, M. (2022). Winning interdependence: Semiconductor and CRM rivalry in a de-globalizing world. In Reaching breaking point: The semiconductor and critical raw material ecosystem at a time of great powers rivalry. Hague Centre for Strategic Studies, Nederland, pp. 60-77. http://www.jstor.org/stable/resrep44057.8
[2] Nejjar, B. (2020). Supply chain et crises systémiques: l’apport des méthodes de modélisation et de simulation pour améliorer la résilience-cas de la pandémie de covid-19. International Journal of Accounting, Finance, Auditing, Management and Economics, 1(2): 2-22. https://doi.org/10.5281/zenodo.4016645
[3] Kozarević, S., Puška, A. (2018). Use of fuzzy logic for measuring practices and performances of supply chain. Operations Research Perspectives, 5: 150-160. https://doi.org/10.1016/j.orp.2018.07.001
[4] Zadeh, L.A. (1965). Fuzzy sets. Information and Control, 8(3): 338-353. https://doi.org/10.1016/S0019-9958(65)90241-X
[5] Zadeh, L.A. (1973). Outline of a new approach to the analysis of complex systems and decision processes. IEEE Transactions on Systems, Man, and Cybernetics, (1): 28-44. https://doi.org/10.1109/TSMC.1973.5408575
[6] Assilian, S., Mamdani, E.H. (1974). Learning control algorithms in real dynamic systems. In 4th IFAC/IFIP International Conference on Digital Computer Applications to Process Control: Zürich, Switzerland, Part I. Berlin, Heidelberg: Springer Berlin Heidelberg, pp. 13-24. https://doi.org/10.1007/978-3-642-65796-2_2
[7] Zadeh, L.A. (1978). Fuzzy sets as a basis for a theory of possibility. Fuzzy Sets and Systems, 1(1): 3-28. https://doi.org/10.1016/0165-0114(78)90029-5
[8] Wang, L.X. (1997). A course in fuzzy systems and control. Prentice-Hall International, Inc., NJ, USA. https://research.iaun.ac.ir/pd/naghsh/pdfs/UploadFile_2079.pdf
[9] Ji, J., Sato, K., Tominaga, N., Zhao, Q. (2008). Head pose recognition with NNC-Trees. In 2008 Japan-China Joint Workshop on Frontier of Computer Science and Technology. IEEE, Nagasaki, Japan, pp. 214-219. https://doi.org/10.1109/FCST.2008.28
[10] Kindo, A.A., Kaladzavi, G., Malo, S., Camara, G., Tapsoba, T.M.Y. (2020). Fuzzy logic approach for knowledge modeling in an Ontology: A review. In 2020 IEEE 2nd International Conference on Smart Cities and Communities (SCCIC), Ouagadougou, Burkina Faso, pp. 1-8. https://doi.org/10.1109/SCCIC51516.2020.9377335
[11] Jang, J.S. (1993). ANFIS: Adaptive-network-based fuzzy inference system. IEEE transactions on systems, man, and cybernetics, 23(3): 665-685. https://doi.org/10.1109/21.256541
[12] Dzitac, I., Filip, F.G., Manolescu, M.J. (2017). Fuzzy logic is not fuzzy: World-renowned computer scientist Lotfi A. Zadeh. International Journal of Computers Communications & Control, 12(6): 748-789. https://doi.org/10.15837/ijccc.2017.6.3111
[13] Tabit, S., Soulhi, A. (2022). Industial performance control with fuzzy logic and ahp methods. Journal of Theoretical and Applied Information Technology, 100(3). http://www.jatit.org/volumes/Vol100No3/6Vol100No3.pdf
[14] Kondratenko, Y.P., Kozlov, O.V., Gerasin, O.S., Zaporozhets, Y.M. (2016). Synthesis and research of neuro-fuzzy observer of clamping force for mobile robot automatic control system. In 2016 IEEE First International Conference on Data Stream Mining & Processing (DSMP), Lviv, Ukraine, pp. 90-95. https://doi.org/10.1109/DSMP.2016.7583514
[15] Bezdek, J.C. (2013). Pattern recognition with fuzzy objective function algorithms. Springer Science & Business Media. https://doi.org/10.1007/978-1-4757-0450-1
[16] Pourabdollah, A., Wagner, C., Aladi, J.H., Garibaldi, J.M. (2016). Improved uncertainty capture for nonsingleton fuzzy systems. IEEE Transactions on Fuzzy Systems, 24(6): 1513-1524. https://doi.org/10.1109/TFUZZ.2016.2540065
[17] Bouhadi, O.E., Azmani, M., Azmani, A. (2022). Using a fuzzy-bayesian approach for predictive analysis of delivery delay risk. International Journal of Advanced Computer Science and Applications, 13(7): 316-326. https://doi.org/10.14569/IJACSA.2022.0130740
[18] Shekarian, E., Kazemi, N., Abdul-Rashid, S.H., Olugu, E.U. (2017). Fuzzy inventory models: A comprehensive review. Applied Soft Computing, 55: 588-621. https://doi.org/10.1016/j.asoc.2017.01.013
[19] Shekarian, E., Olugu, E.U., Abdul-Rashid, S.H., Bottani, E. (2016). A fuzzy reverse logistics inventory system integrating economic order/production quantity models. International Journal of Fuzzy Systems, 18: 1141-1161. https://doi.org/10.1007/s40815-015-0129-x
[20] Shekarian, E., Olugu, E.U., Abdul-Rashid, S.H., Kazemi, N. (2016). An economic order quantity model considering different holding costs for imperfect quality items subject to fuzziness and learning. Journal of Intelligent & Fuzzy Systems, 30(5): 2985-2997. https://doi.org/10.3233/IFS-151907
[21] Kahraman, C., Gülbay, M., Kabak, Ö. (2006). Applications of fuzzy sets in industrial engineering: A topical classification. Fuzzy Applications in Industrial Engineering, 1-55. https://doi.org/10.1007/3-540-33517-X_1
[22] Lin, C.T. (2020). A base on fuzzy theory to supplier evaluation and selection optimization. Discrete Dynamics in Nature and Society, 2020: 1-5. https://doi.org/10.1155/2020/5241710
[23] Labib, A.W. (2011). A supplier selection model: A comparison of fuzzy logic and the analytic hierarchy process. International Journal of Production Research, 49(21): 6287-6299. https://doi.org/10.1080/00207543.2010.531776
[24] Vieira, A.A., Dias, L., Santos, M.Y., Pereira, G.A., Oliveira, J. (2020). Supply chain risk management: An interactive simulation model in a big data context. Procedia Manufacturing, 42: 140-145. https://doi.org/10.1016/j.promfg.2020.02.035
[25] Lakhouil, H., Soulhi, A. (2023). Supply chain risk assessment with fuzzy logic applied to the failure mode and effect analysis method. Journal of Theoretical and Applied Information Technology, 101(10): 4071-4077. http://www.jatit.org/volumes/Vol101No10/35Vol101No10.pdf
[26] Mamdani, E.H. (1976). Advances in the linguistic synthesis of fuzzy controllers. International Journal of Man-Machine Studies, 8(6): 669-678. https://doi.org/10.1016/S0020-7373(76)80028-4
[27] Soulhi, A., Guedira, S., El Alami, N.E. (2009). Decision-making automation fuzzy decision-making in industry. In Proceedings of The 8th WSEAS International Conference on Artificial Intelligence, Knowledge Engineering and Data Bases, pp. 181-185. https://dl.acm.org/doi/10.5555/1553921.1553959
[28] Admi Syarif, A.S., Mayda, B.F., Aristoteles, A., Agus, W. (2022). Implementation of fuzzy expert system on skin diseases. International Journal of Advanced Computer Science and Applications, 13(12): 528-536. http://dx.doi.org/10.14569/IJACSA.2022.0131264
[29] Omar, A.S., Waweru, M., Rimiru, R. (2015). A literature survey: Fuzzy logic and qualitative performance evaluation of supply chain management. International Journal of Engineering and Science (IJES), 4(5): 56-63. https://www.theijes.com/papers/v4-i5/Version-1/G0451056063.pdf
[30] Pokoradi, L. (2002). Fuzzy logic-based risk assessment. AARMS, Academic and Applied Research in Military Science, 1(1): 63-73. https://www.researchgate.net/publication/267548987
[31] Ye, X.J. (1994). Modélisation et simulation des systèmes de production: Modélisation et simulation des systèmes de production: Une approche orientée-objets. Modélisation et simulation. INSA de Lyon, Français. https://theses.hal.science/tel-00821121
[32] Perny, P., Zucker, J.D. (1999). Collaborative filtering methods based on fuzzy preference relations. Proceedings of EUROFUSE-SIC, 99: 279-285. https://www.researchgate.net/publication/2328086
[33] Maaref, H., Barret, C. (1999). Optimization of a fuzzy controller for a reactive navigation. In N-E Mastorakis (Eds.), Computational Intelligence and Applications. World Scientific, 193-198.
[34] Berbiche, N., Hlyal, M., El Alami, J. (2020). Exponential success through integrated supply chain optimization, ecomotional intelligence and reputation-based leadership: Zara model. In IOP Conference Series: Materials Science and Engineering. IOP Publishing, 827(1): 012058. https://doi.org/10.1088/1757-899X/827/1/012058
[35] Tuncer, T., Yar, O. (2019). Fuzzy logic-based smart parking system. Ingénierie des Systèmes d'Information, 24(5): 455-461. https://doi.org/10.18280/isi.240501