Aishah Almiman![]() | Mohamed Tahar Ben Othman*
| Mohamed Tahar Ben Othman*![]()
© 2024 The authors. This article is published by IIETA and is licensed under the CC BY 4.0 license (http://creativecommons.org/licenses/by/4.0/).
OPEN ACCESS
In the realm of Educational Data Mining (EDM), the predictive analysis of student performance has emerged as a pivotal area of interest, particularly within computer science education. This investigation employs machine learning and data mining techniques to project academic outcomes of computer science undergraduates, anchoring its framework on the Association for Computing Machinery's (ACM) 2013 Body of Knowledge (Bok), as delineated in the curriculum guidelines for undergraduate computing programs. Encompassing 18 Knowledge Areas (KAs), each with multiple Knowledge Units (KUs), the ACM2013 guideline serves as a comprehensive scaffold for curriculum development, ensuring an inclusive coverage of essential skills and subjects. Through an analysis of data from 2,756 students across nine years at Qassim University's College of Computer Science, this study aims to pinpoint performance levels across various KAs and semesters. Linear regression models were constructed to predict student performance, with their accuracy evaluated through Mean Absolute Error (MAE), Mean Square Error (MSE), and Root Mean Square Error (RMSE). The predictive accuracy varied across courses, with "Systems Programming" and "Graduation_1" demonstrating high alignment with actual scores, while courses like "Artificial Intelligence" and "Compiler Design" revealed significant discrepancies. A correlation analysis between predicted and actual scores further assessed the models' precision. Findings underscore the utility of EDM in academic settings, especially for tailoring predictive models that enhance student performance prediction in computer science. The identification of KAs with high predictive accuracy corroborates the curriculum's alignment with student achievements, whereas lower accuracy areas highlight potential gaps in curriculum or pedagogy, offering vital insights for educators and curriculum designers to refine educational strategies and resources for improved student outcomes.
Educational Data Mining (EDM), Association for Computing Machinery (ACM), Knowledge Area (KA), data mining, machine learning, prediction model
EDM is a field that uses faculty experience and student performance data to gain insights. As education evolves, EDM has become more critical, especially in developing predictive systems. However, these systems face challenges due to the complexity of the educational process, which includes factors like educational background, learning resources, environment, teacher experience, and student abilities [1].
In recent years, higher education enrollment has expanded rapidly. However, this has resulted, as mentioned in the study by Mi [2], in a decline in academic quality, which can be attributed to the continuous provision and rapid evolution of curricula. This decline is mainly due to a lack of respect for the different areas of knowledge needed at each curriculum level and their periodical assessments. Comprehensive curricula, such as the CS2013 Computer Science Model Curriculum, have been introduced to tackle this challenge. This model and the ACM's BoK outline 18 KAs essential for computer science education. These KAs are further divided into KUs, which offer educational institutions the flexibility to customize courses while ensuring coverage of critical topics and skills such as teamwork, communication, and problem-solving. This framework is particularly beneficial for undergraduate programs, providing a foundation for evaluating students' analytical and practical skills [3].
Previous research on predicting student performance has used various approaches, reflecting the multifaceted nature of educational outcomes. A systematic review of 743 articles published between 2010 and 2017 provided by Hellas et al. [4] showed that computer science was the most studied subject, with classification techniques being the most commonly used (39.9%) and linear modeling being the most popular method (17.7%). A comprehensive study by Namoun and Alshanqiti [5] of 62 articles published between 2010 and 2020 highlighted the diverse use of statistical analysis, supervised and unsupervised machine learning, with statistical analysis being the most applied technique (45.16%). The accuracy of these methods varied, with techniques like hybrid random forest and feedforward 3-L neural networks achieving high accuracy rates of up to 99.98%. Ahmed et al. [6] used in algorithms like decision trees, SVM, and neural networks to predict the suitability of computer science as a degree, demonstrating the Random Forest algorithm's superior predictive capability in categorizing student outcomes. Similarly, Nosseir and Fathy [7] apply neural network techniques for pre-university performance prediction, while Jain and Solanki [8] compare various classifiers, including Extreme Gradient Boosting. These studies show the diverse landscape of techniques in EDM, each contributing uniquely to understanding and enhancing student performance prediction.
This proposal presents a new model for forecasting student performance by measuring student performance on the ACM BoK for computer science program. Our model aims to establish a connection between the comprehensive KAs outlined by the ACM and quantifiable student outcomes to identify and address any possible weaknesses. We intend to utilize linear regression, which is a supervised machine learning technique with appropriate customizations, to anticipate students' current and future performance. The final aim is to create a practical tool for EDM that enhances the educational journey for students in their institutions. This will help any institution assess the program's educational objectives in an effective way.
This study presents a detailed overview of different approaches used to anticipate student performance, encompassing the advancements from 2010 to the present.
In the research by Hellas et al. [4] and by conducting a systematic review of 743 articles published between 2010 and 2017, it has been found that classification, clustering, and statistical techniques, particularly linear modeling, are extensively used. This trend forms a strong base for our research.
Expanding on this idea, we have looked into newer studies up to 2023. These studies demonstrate a trend toward using machine learning and statistical analysis for EDM. While supervised machine learning is not as commonly used, it has much potential yet to be explored. This changing landscape has influenced our methodology, and we are now exploring more advanced machine-learning techniques [5].
Our analysis is crucial in identifying both the strengths and challenges of existing methods. Several studies have employed different algorithms, such as decision trees, SVMs, and neural networks, to develop robust prediction frameworks. However, these models need more flexibility to address diverse educational pathways [6]. Our research has integrated more dynamic models to adapt to varying student learning experiences.
Furthermore, predicting students' performance at an early stage and applying classification algorithms [7, 8] emphasize the significance of timely interventions. However, these studies also warn against overfitting and stress the importance of generalizable models. To tackle this challenge, our research uses a comprehensive approach that considers a broader range of factors related to students.
In addition, our study incorporates insights from applications of expert systems and multiple regression models in educational settings [9, 10]. We extend these methodologies by integrating them with advanced data mining techniques, offering a more comprehensive view of student performance prediction.
In a study conducted by Gull et al. [11], six algorithms were employed, including logistic regression and support vector machines, to forecast the final grades of undergraduate students based on various term activities. The results of the study demonstrate the effectiveness of linear models. In a subsequent study, Nuankaew and Thongkam [12] explored a more comprehensive range of algorithms and highlighted the robustness of Random Forest in predicting academic performance across different disciplines. These findings are consistent with our approach, which incorporates a more diverse range of predictive factors.
They utilize various innovative techniques, such as RTV-SVM [13], ANOVA analysis [14], and DNN models [15], to improve their predictive framework. These studies demonstrate the effectiveness of specific methodologies in predicting student performance based on term activities, course correlations, and online engagement, respectively. By using multiple linear regression in blended learning environments, Xu et al. [16] showed how important it is to take into account different types of learning activities in predictive models.
Other studies used various predictive models in EDM and drew insights from multiple methodologies. Yan [17] utilized XGBoost, a decision tree-based algorithm, to demonstrate the effectiveness of gradient-boosting frameworks. Their adherence to the CRISP-DM methodology shows a structured approach to predictive modeling, from understanding the educational field to evaluating models against established metrics such as RMSE and MAE. The success of the XGBoost model in their research, marked by its low MAE and high R2, is beneficial for our study, suggesting the potential of advanced ensemble techniques in educational settings.
MD and Krishnamoorthy [18] conducted a study on student performance at Amrit University in India. They used context-bound cognitive skill scores to analyze the data and improve predictive modeling in education. Their approach involved using various algorithms, such as logistic regression and SVM, which helped them gain insights into the complexity of educational data and the importance of using diverse analytical methods. By focusing on cognitive skills, they were able to develop a nuanced understanding of student performance, which is crucial for creating comprehensive predictive models.
Subahi [19] proposed the ACM criteria-based approach, combining technical and non-technical factors to predict future career paths. The study applied neural networks to EDM, but it also revealed practical challenges such as data scarcity and manual effort requirements. This provides valuable insights for our research on balancing technical sophistication with practical feasibility.
The landscape of EDM is rich with diverse methodologies aimed at predicting student performance. A notable addition to this body of work is "Performance Prediction of Students in Higher Education Using a Multi-Model Ensemble Approach". This study delves into the efficiency of ensemble classification techniques, including bagging, boosting, stacking, and voting, offering a nuanced perspective on the predictability of student outcomes. Drawing on quantitative data from a Pakistani university's learning management system, the research employs a blend of algorithms such as Naive Bayes, J48 decision trees, Adaboost, logistics, and multilayer perceptron to forecast academic success. The findings reveal the strengths of the boosted tree method in managing vast datasets with significant standard deviations and the advantages of stacking for smaller data samples. Crucially, the study explores the correlation between teacher employment status and student performance, providing valuable guidance for educational leadership. These results show that ensemble learning models can be useful in analyzing education. In some cases, these combined methods can be more accurate than predictions made by a single model. This insight enriches our understanding and offers a solid reference point for our investigation into the predictive modeling of student performance [20].
Also, a study by Carlos and others analyzed the effectiveness of ensemble classification methods, such as bagging, boosting, stacking, and voting, in predicting student performance. The study used data from a university's learning management system in Pakistan. Various models, including Naive Bayes, J48 decision trees, Adaboost, logistics, and multilayer perceptron, were incorporated into the research. The study found that the boosted tree method was particularly effective in managing large datasets with significant standard deviations, while stacking showed promise for smaller datasets. Additionally, the study explored the impact of teacher employment status on student outcomes and provided valuable insights for educational stakeholders [21].
Our research combines traditional statistical models with advanced machine-learning techniques to extend the scope of EDM. We aim to synthesize these methods, incorporating a broader set of student-related factors and using conventional and cutting-edge predictive models. Our approach addresses the limitations identified in earlier studies while adapting to the evolving landscape of educational research.
To summarize, this section provides an overview of significant research in the field, integrating critical analysis of various studies and highlighting our research contributions. Our study aims to position itself at the forefront of EDM by offering a comprehensive and adaptable framework for predicting student performance.
Understanding and predicting student performance is vital to refining educational approaches. Aligning the computer science curriculum with globally recognized guidelines, such as the ACM 2013, is paramount to achieving this understanding. Here, we present our methodology, which encompasses data collection, KA mapping, weightage calculation, and prediction models.
3.1 Data collection and extraction
Course syllabi, representing a diverse set of academic institutions, serve as the primary data source for this study. Each syllabus offers a comprehensive overview of the topics and sub-topics covered within its course, making it a valuable reservoir of academic content. Each syllabus underwent a meticulous analysis to extract the primary topics and sub-topics it contained. This extraction process formed the foundation upon which the subsequent matching and mapping processes were built.
3.2 KA mapping
3.2.1 ACM 2013 KA
The ACM 2013 KA framework is a pivotal reference in computer science education. Its detailed categorization offers a structured means of understanding and organizing academic content. A systematic matching process was instituted to align the extracted topics from the syllabi with the standard KAs defined by ACM 2013. This step ensured that the course content and the ACM standards were congruent, cementing subsequent predictions' validity.
3.2.2 Weightage calculation
Understanding the weight or significance of each KA within a course is paramount to evaluating student performance. This weightage offers insights into the distribution and emphasis of content across various KAs. Weightage is calculated using the Eq. (1):
$W_{c, k}=\frac{\text { Hours of KA } k \text { in course c }}{\text { Total hours of course c }}$ (1)
To elucidate, if a KA within a course spanned 5 hours and the total duration of the course was 50 hours, then the weightage of that KA would be 10%. This quantification serves as an accurate representation of the importance each KA holds within a course's structure.
To find the percentage acquired by each student in a specific course KA, we need to find the sum of this KA credit hour covered during the entire computer science program using Eq. (2) to calculate the percentage.
$s p_{s, c, k}=\frac{M_{s, c, k} \times W_{c, k}}{100} \times \operatorname{sum}_k$ (2)
where:
3.3 Accumulation of knowledge
The accumulation of knowledge concept, represented by Eq. (3), is pivotal, as it encapsulates the student's cumulative knowledge spanning multiple semesters. As students’ progress through their academic journey, they traverse multiple KAs as defined by ACM 2013.
$T_{\text {previous }}=\sum_{s=1}^{S-1} \sum_{c=1}^{c_s} \sum_{k=1}^{K_c} s p_{s, c, k}$ (3)
where:
3.4 Regression predictions
3.4.1 Term-based sequential prediction
The term-based sequential prediction model provides a comprehensive analysis of a student's academic progress throughout their academic term. It captures the aggregate knowledge and performance from one term and uses this data to predict probable outcomes in the subsequent term. The knowledge is predicted according to Eq. (4):
$T_{\text {current }}=\beta_0+\beta_1 \times T_{\text {previous }}+\beta_2 \times W_{c, k}+\epsilon$ (4)
where:
Assuming a student achieved a knowledge score of 70 in the last term, and the weightage for a specific KA in an upcoming course is 0.15. If our regression model determines that $\beta_0=10$, $\beta=0.5$ and $\beta_2=20$ then:
$T_{\text {current }}=10+0.5(70)+20(0.15)$
$T_{\text {current }}=10+35+3=48$
The model predicts a knowledge score of 48 for the upcoming term based on the previous term's performance and the KA's weightage in the course.
3.4.2 Course-based sequential prediction:
The course-based sequential prediction model adopts a more granular approach, focusing specifically on individual courses. Instead of looking at an entire term's performance, it assesses a student's prior knowledge and achievements in previous courses to forecast their performance in upcoming courses. The knowledge will be predicted according to Eq. (5):
$K_c=\alpha_0+\alpha_1 \times T_{\text {previous }}+\alpha_2 \times W_{c, k}+\eta$ (5)
where:
Let's assume a student previously achieved a knowledge score of 80 in a relevant course, and the weightage for a specific KA in the next course is 0.10. If the regression model establishes $\alpha_0=5, \alpha_1=0.4$ and $\alpha_2=30$, then:
$K_c=5+0.4(80)+30(0.10) K_c=5+32+3=40$
Thus, the model predicts a knowledge score of 40 for the specific upcoming course based on prior course performance and KA weightage.
In this section, we embark on a comprehensive analysis of the data collected. The primary objective here is to scrutinize the dataset thoroughly before proceeding with any predictive modeling. This analysis is pivotal as it lays the groundwork for understanding the underlying patterns, trends, and potential anomalies in the data, which are essential for accurate and meaningful predictions.
Table 1. KAs covered per course
|
Course |
KA |
||
|
Logic Design |
AL:10 |
AR: 30 |
PL:2 |
|
Computer Organization |
AR: 30 |
NC: 2 |
OS: 10 |
|
Computer Network |
AR: 8 |
NC: 20 |
IM & OS:14 |
|
Programming (1) |
AL: 8 |
PL: 20 |
SE & AR:14 |
|
Programming (2) |
PL: 40 |
AL: 1 |
IM: 1 |
|
Data Structures |
AL: 6 |
DS: 35 |
SE: 1 |
|
Assembly Language |
AR: 20 |
PL: 20 |
SE: 2 |
|
Operating Systems |
OS: 24 |
PD: 10 |
CN: 8 |
|
Programming Languages Concepts |
PL: 28 |
SE: 8 |
CN: 6 |
|
Computer graphics |
AL: 6 |
GV: 36 |
… |
|
Algorithm Analysis and Design |
AL: 40 |
DS: 2 |
… |
|
Compiler Design |
PL: 30 |
AR: 11 |
SE: 1 |
|
Software Engineering |
SE: 30 |
PL: 10 |
SF: 2 |
|
Web Technology |
PL: 30 |
NC: 10 |
IM: 2 |
|
Database |
IM: 35 |
PL: 6 |
OS: 1 |
|
Introduction to Computer Security |
IAS: 39 |
SP: 2 |
NC: 1 |
|
Optimization Techniques |
AL: 24 |
PL: 14 |
NC: 4 |
|
Artificial Intelligence |
IS: 30 |
AL: 6 |
PL: 6 |
|
Systems Programming |
AR: 14 |
PL: 12 |
AL & OS: 14 |
|
Concept of Algorithm |
AL: 20 |
DS: 14 |
CN: 8 |
|
Graduation (1) |
PL: 10 |
SE: 20 |
IM: 12 |
|
Graduation (2) |
PL: 20 |
SE: 10 |
IM:12 |
Notes: The number beside each KA used as the weight of this KA in the course and represents the number of credit hours covered for the KA in this course.
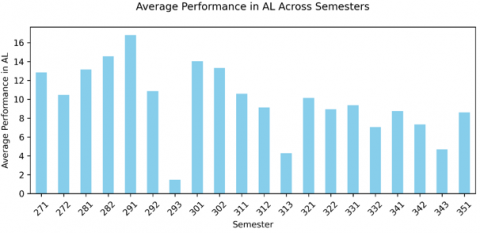
Figure 1. Average performance in AL across semesters
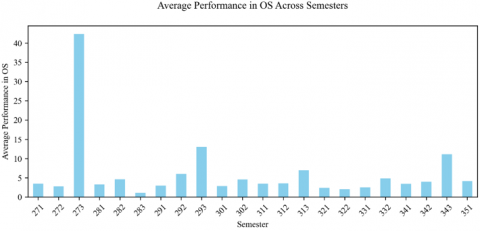
Figure 2. Average performance in OS across semesters
Figure 3. Average performance in IM across semesters
Figure 4. Average performance in DS across semesters
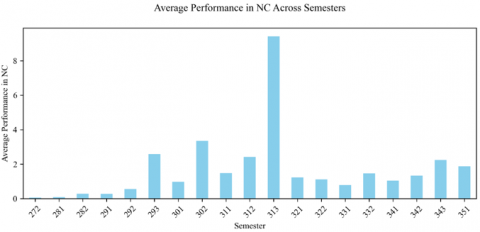
Figure 5. Average performance in NC across semesters
Figure 6. Average performance in DS across courses
Figure 7. Average performance in PL across courses
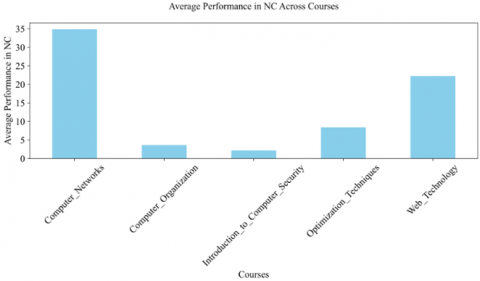
Figure 8. Average performance in NC across courses
Figure 9. Average performance in SE across courses
Figure 10. Performance of STD ID 2617 over semesters
Figure 11. Performance of STD ID 212 over semesters
Figure 12. Performance of STD ID 26 over courses
Figure 13. Performance of STD ID 931 over courses
Initially, data was collected for 2,756 students in a computer science program from 2006 to 2017. Each year has two semesters named from 271 to 351. It includes a group of study subjects with different credit hours, which covered a group of KA ranging from 2 to 4, depending on the topics and outcomes mentioned in the description of each course. Table 1 shows the KAs covered by each course in the Computer Science program.
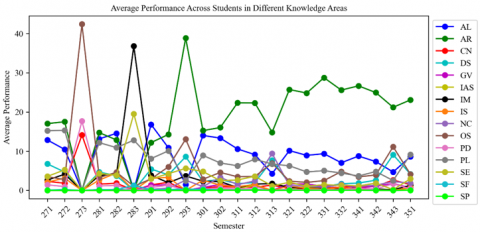
Figure 14. Averge of student's performnce across semesters in different KA
Figure 15. Averge ofstudent's performnce across courses in different KA
Figure 16. Averge of student's performnce in artificial intelligence across semesters
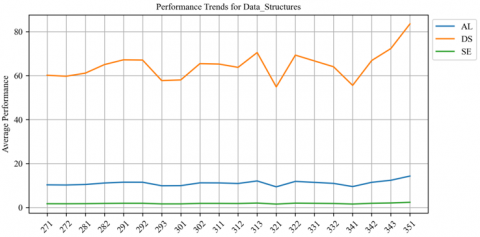
Figure 17. Averge of student's performnce in data structures across semesters
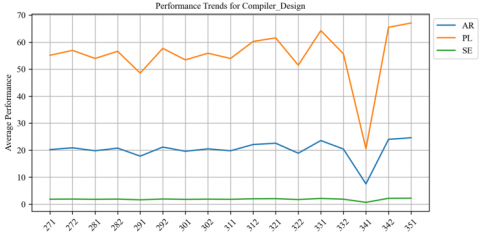
Figure 18. Averge of student's performnce in compiler design across semesters
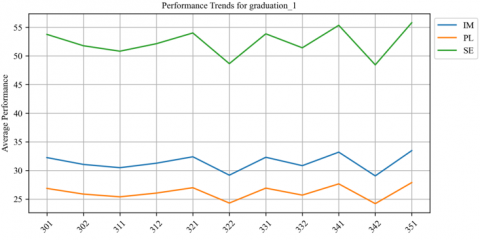
Figure 19. Averge of student's performnce in graduation 1 across semesters
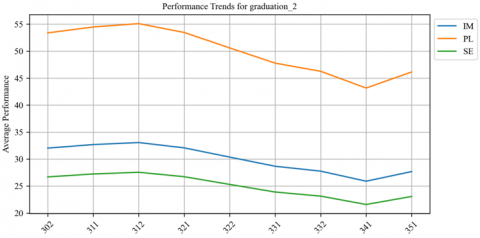
Figure 20. Averge of student’s performnce in graduation 2 across semesters
Figure 21. Performance of graduated student ID 1188 across semesters
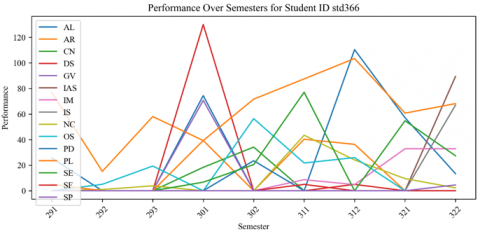
Figure 22. Performance of graduated student ID 366 across semesters
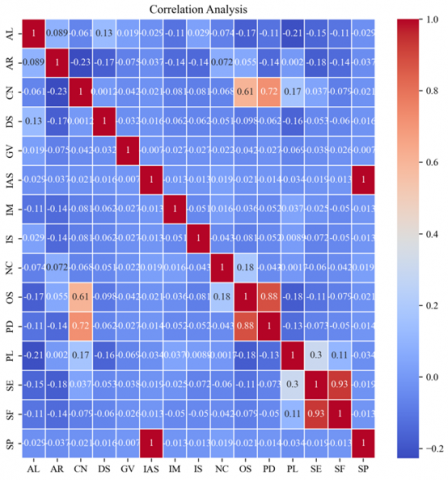
Figure 23. KA heatmap
Next, data is dived into different exploratory data analyses (EDA). EDA is a crucial step because it helps reveal the underlying structure of the data, highlight missing and outliers, and visualize relationships between variables. This stage uses graphical and quantitative methods to provide insight into the data set, which helps formulate appropriate hypotheses and predictive models later in the study.
We, then, analyzed students' average performance in the ACM curriculum's KAs over several semesters. Notable trends include peaks in the semester of "291" for AL, "273" for OS, "283" for IM, "293" for DS, and "313" for NC, indicating classes in which students performed exceptionally well. These peaks may indicate classroom-specific influences such as effective teaching methods, assessment formats, or curriculum design that positively impact student learning. Conversely, a general decline in some basic knowledge in subsequent semesters indicates increased difficulty or decreased student engagement and warrants closer examination, as shown in Figures 1-5.
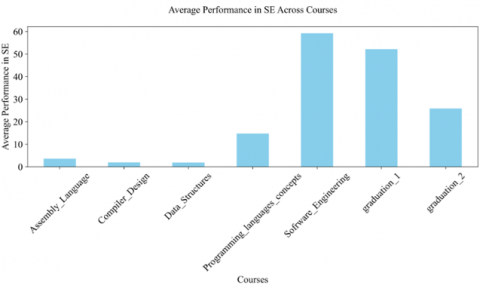
In Figures 6-9, the average performance of students across the different academic courses was found, with diverse mastery in KA like Algorithm and Complexity (AL), Architecture and Organization (AR), Computational Science (CN), Data Structures (DS), Information Management (IM), Network and Communication (NC), Operating Systems (OS), Programming Languages (PL), and Software Engineering (SE). Students excel in "Software Engineering" within SE, "Data Structures" within DS, "Web Technology" within PL, and "Computer Network" within NC. However, challenges are evident in "Algorithm Analysis and Design" for DS and "Data Structure" within SE. "Compiler Design" and "Programming Language Concept" rank highly in PL, whereas "Assembly Language" shows lower performance in SE. Interestingly, "graduation" courses present varied results, suggesting disparities in curriculum execution. This comprehensive performance data underscores the need for targeted educational strategies to enhance learning outcomes in lower-scoring areas.
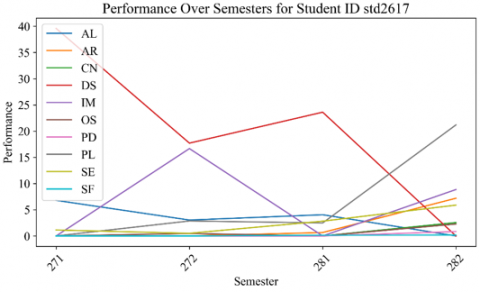
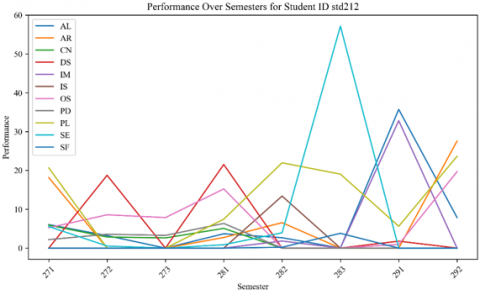
Figures 10 and 11 show the performance of random students across semesters in different KAs. The performance shows significant variability from one semester to the next. This suggests that the student's grasp of each KA could be more consistent. They may excel in some while struggling in others. A noticeable peak in one of the KAs in a particular semester indicates a high score, possibly due to the student's increased interest or aptitude for that KA or that it was less challenging or better taught than others. Conversely, there are subjects in which the performance is consistently low, possibly pointing to difficulty with the KA matter or less engagement with the course.
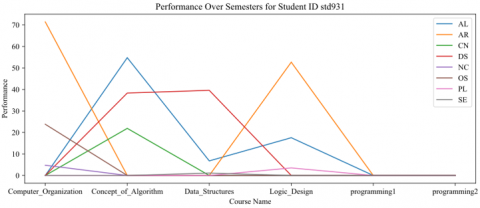
Figures 12 and 13 outline the performance of random students across various courses. There are spikes in performance in specific courses, which indicates a strong aptitude or preference for those KAs or an excellent performance in a particular term. On the contrary, some courses show lower performance, which might be due to factors such as the course's complexity, the student's interest or engagement in the topic, or external factors affecting the student's performance.
The previous random analyses expanded to include the average performance of all students in various academic KAs over multiple semesters. KAs such as AL, AR, CN, etc., show a wide range of average scores over time. The lines, each representing a distinct KA, show significant variation in performance, highlighting dynamic academic progress in each domain. Some areas of knowledge show occasional spikes, indicating semesters in which students excelled, perhaps due to various factors such as teaching methodologies or students' adaptation to course material. On the other hand, sharp declines in some classes indicate difficulties that may require academic support or curriculum modifications. The fluctuating nature of the graph emphasizes that there is no consistent trend in any major, reflecting the complex interplay between different elements that influence academic success. The data suggest a need for a careful understanding of the factors that contribute to these trends to enhance instructional strategies and student learning outcomes, as shown in Figure 14.
On the other hand, when measuring average student performance across different courses in different KAs in computer science, "Algorithms Analyses and Design" shows a high peak in AL, suggesting that students generally perform well, which might be attributed to a robust curriculum or interest in algorithmic thinking. Operating Systems and Computer Graphics These areas also have high peaks, indicating above-average performance, suggesting that practical, hands-on subjects are well-taught or resonate more with students. Compiler design and data structures show more variability, with some high and some low points, suggesting that while some cohorts understand these subjects well, others may struggle, possibly due to the abstract nature of these areas. Graduation Projects The final projects ('Graduation1' and 'Graduation2') show varying performance, but generally towards the higher end, indicating a culmination of knowledge and the application of skills acquired throughout the study, as shown in Figure 15.
Figures 16-20 depict students' average performance across various courses within the curriculum of the computer science program. Each chart represents a different course, with performance on the most important KAs. There is significant variation in performance between semesters, as evidenced by the peaks and valleys. Some courses, such as "Artificial Intelligence" and "Data Structures", have high peaks, indicating that students generally perform well in these areas. On the other hand, courses such as "Compiler Design" and "Graduation 1" show a much lower average performance, which may indicate that these subjects are more challenging for students. In addition, the "Graduation2" course offers consistently low performance, which may indicate a peak course that requires special effort.
For student std1188, there are significant fluctuations in performance across different semesters’ consistently high performance, peaking significantly in semester 322 for PL. AL and IAS also show peaks in performance but are not as pronounced as PL. There is a general trend where performance spikes and then drops, which could indicate a cycle of high achievement followed by a semester of lower scores. For student std366, the student's performance also fluctuates, but with less extreme variation than std1188. The highest peaks are observed in DS during semester 301 and AL during semester 312. Unlike std1188, no clear cyclical pattern suggests a less predictable performance across semesters, as shown in Figures 21-22.
In the correlation matrix in Figure 23, each cell in the table shows the relationship between two variables. The value lies in the range from -1 to 1. If two variables have a high correlation (close to 1 or -1), they have a strong relationship. If the correlation is close to 0, there is no relationship. To analyze this chart, you should look for cells with high absolute values (close to 1 or -1) indicating strong positive or negative correlations. For example, a significant positive relationship between CN and DS and GV and PD appears to be indicated by higher values (close to 1). On the other hand, negative values close to -1 indicate a strong negative correlation, but there are no such examples in this matrix.
5.1 Prediction of the student performance across courses
In this section, we will take a detailed look at the results of the predictive modeling that was conducted to evaluate the performance of computer science students in different courses and semesters. The main objective of this modeling was to use past academic data from previous courses as inputs and predict the performance of students in current and future courses. This approach was aimed at testing the hypothesis that past academic achievements can serve as indicators of future success.
The dataset consisted of performance data from 2756 students. This dataset was divided into two sets, a training set and a testing set, using an 80-20 split. The partitioning was carried out using a stratified sampling method to ensure that the training and testing sets were representative of the entire dataset. This method ensured that diversity across different courses and semesters was maintained.
Statistical analysis identified outliers. Adjustments were made for data entry errors and unusual performance patterns to mitigate their impact on the models and ensure overall predictive accuracy.
The first and foremost step is to clarify the KA covered by each course. These KAs function as our training and testing grounds, enabling us to assess the level of understanding of students in different courses. Next, we employ linear regression to forecast how well students will perform in their ongoing courses. We have a customized setup for each course, which allows our models to capture the unique mix of what students know and how it may reflect in each class.
To measure the accuracy of the predictive models, we used error metrics such as MAE, MSE, and RMSE. In this study, we considered an MAE and RMSE below 5, and an MSE below 50, as indicative of a robust model. These thresholds were selected based on standard error margins in educational data analysis.
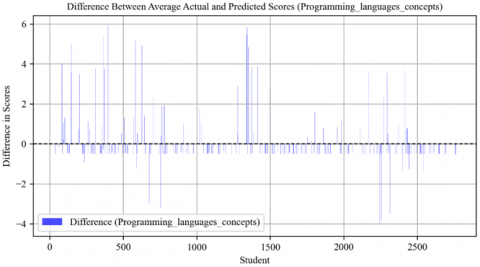
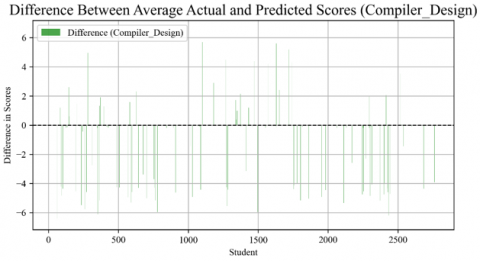
We use bar charts to compare what we predicted a student would record with what they actually recorded. This helps us identify if our predictions are too high or too low, which is crucial to improving our accuracy. Think of a graph where each dot represents a student's performance, and the vertical line shows how much we were off in our prediction. If the dot is above zero, the student did better than we expected; if it's below, they performed worse. Each dot is placed above a student's number and is associated with their specific grade difference.
Negative values indicate lower actual scores. The data is plotted as points aligned vertically above each student number, representing the score difference for one student.
The "Programming Language Concepts" chart indicates that most students' predictions were generally accurate, as most data points are closely distributed around the zero line. However, in many cases, the predicted scores deviated significantly from the actual scores, as seen from the length of the lines above or below the zero line. This suggests that some of the predictions could have been more accurate. The distribution of differences shows heterogeneity, with no clear pattern of systematic overestimation or underestimation across the board, as shown in Figure 24.
Figure 24. Difference between average actual and predicted scores in programming language concepts course
Figure 25. Difference between average actual and predicted scores in compiler design course
Figure 26. Difference between average actual and predicted scores in data structures course
Figure 27. Difference between average actual and predicted scores in systems programming course
Figure 28. Difference between average actual and predicted scores in graduation 1 course
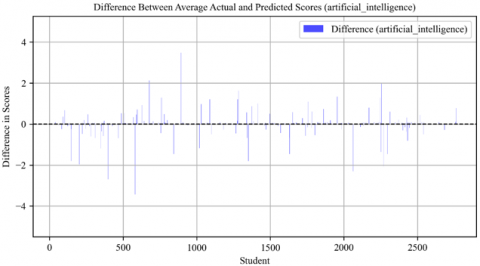
Figure 29. Difference between average actual and predicted scores in artificial intelligence course
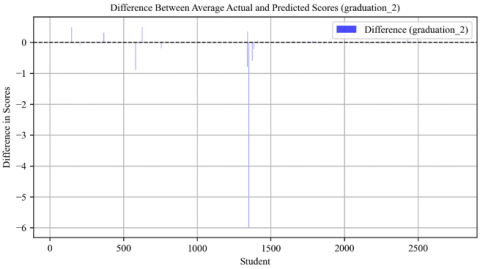
Figure 30. Difference between average actual and predicted scores in graduation 2 course
The "Compiler Design" chart shows a relatively balanced distribution of variances around the zero line, indicating that the prediction model was not consistently overestimating or underestimating student scores. However, there are notable positive and negative deviations, meaning that although many predictions are accurate, there are still several students whose predictions need to correspond better with their actual grades. The range of differences is relatively large, which may indicate various factors such as the unpredictability of students' performance in the compiler design, potential problems with the predictive model, or the challenging nature of the course content as shown in Figure 25.
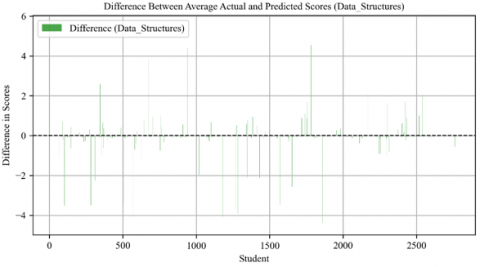
There are various reasons why the accuracy of predicting grades may differ for different courses. Some of these reasons include the level of complexity of the course content, the level of engagement from students, and the teaching methods used. For example, the "Data Structures" course showed less variability in grade predictions, indicating that students generally understood the course material similarly, as shown in Figure 26.
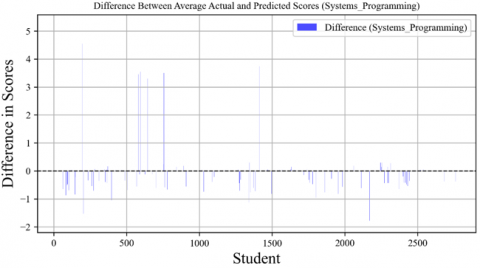
Figure 27 shows the comparison between the actual and predicted average scores for the "Systems Programming" course. The chart displays data points clustered mainly around the zero line, with fewer outliers than in previous charts. The differences observed ranged from -1 to above 3, indicating that for most students, the predicted scores were very close to their actual scores in systems programming. A concentration of points around zero suggests that this course's prediction model is reasonably accurate.
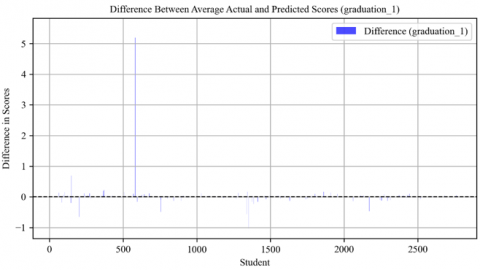
In "Graduation_1," most data points are clustered near the zero line, with few outliers. This suggests that the predictions were highly accurate compared to the actual scores, indicating a robust predictive model for this measure. Figure 28 visually demonstrates this minimal spread of data points near the zero line.
The overfitting in the "Artificial Intelligence" course was evident from the scattered and random distribution of prediction accuracy, as shown in Figure 29. This suggests that the model might have been too closely tailored to specific data patterns in the training set, reducing its effectiveness on new data.
The "Graduation_2" model exhibited a substantial negative variance, as seen in Figure 30. This could point to a systematic bias in the model, potentially due to oversights in considering certain academic factors or misalignments in the model's parameters.
Table 2. Accuracy function using leaner regression model
|
Course |
MAE |
MSE |
RMSE |
|
Logic Design |
0.00 |
0.00 |
0.00 |
|
Computer Organization |
1.43 |
30.67 |
5.54 |
|
Computer Network |
0.88 |
14.17 |
3.76 |
|
Programming (1) |
0.75 |
10.07 |
3.17 |
|
Programming (2) |
0.59 |
9.14 |
3.02 |
|
Data Structures |
1.59 |
55.26 |
7.43 |
|
Assembly Language |
1.53 |
10.98 |
3.31 |
|
Operating Systems |
0.35 |
4.04 |
2.01 |
|
Programming Languages Concepts |
1.16 |
73.52 |
8.57 |
|
Computer graphics |
0.22 |
4.87 |
2.21 |
|
Algorithm Analysis and Design |
0.06 |
0.43 |
0.65 |
|
Compiler Design |
0.31 |
3.44 |
1.86 |
|
Software Engineering |
0.23 |
1.78 |
1.34 |
|
Web Technology |
0.44 |
10.36 |
3.22 |
|
Database |
0.06 |
0.70 |
0.84 |
|
Introduction to Computer Security |
0.34 |
4.42 |
2.10 |
|
Optimization Techniques |
0.10 |
1.78 |
1.34 |
|
Artificial Intelligence |
0.03 |
0.36 |
0.60 |
|
Systems Programming |
0.00 |
0.00 |
0.00 |
|
Concept of Algorithm |
1.43 |
30.67 |
5.54 |
|
Graduation (1) |
0.88 |
14.17 |
3.76 |
|
Graduation (2) |
0.75 |
10.07 |
3.17 |
After analyzing the predictive accuracy of various courses, we noticed a significant difference in their performance. Logic Design and Systems Programming stand out with zero error metrics, which suggests that there is exceptional consistency in student performance or a need to scrutinize the prediction model for overfitting. However, programming language concepts present the most significant challenge regarding accurate predictions, as indicated by the highest MAE, MSE, and RMSE values. This hints at potential complexities within the course that may be affecting predictability.
Meanwhile, courses such as Operating Systems, Introduction to Computer Security, Algorithm Analysis and Design, and Databases demonstrate commendable predictive precision with minimal errors, indicating reliable models for these subjects. Compiler design also shows respectable predictive outcomes with relatively low error rates.
The graduation courses depict moderate predictive errors, which may reflect a balance between predictable trends and the individual variability inherent in capstone courses. Overall, the disparity in error metrics across courses suggests a nuanced landscape of predictive accuracy, where each subject may require tailored modeling approaches to enhance prediction quality, as shown in Table 2.
Future research should focus on exploring more comprehensive data sets and integrating behavioral and engagement metrics to improve predictive accuracy. Moreover, experimenting with advanced machine learning algorithms could be beneficial for gaining more nuanced insights into student performance patterns.
This study provides valuable insights into predicting student performance in computer science courses using historical academic data. Though the predictive models showed varying degrees of accuracy for different courses, they highlight the potential of data-driven approaches in understanding and enhancing academic outcomes. The findings emphasize the need for continual refinement of predictive models and suggest avenues for further research in this evolving field.
Tables 3-5 display the MAE, MSE, and RMSE for different semesters and KAs in a linear regression model. These tables provide important insights into the accuracy of student performance predictions. The MAE values represent the average deviation of predicted scores from actual scores, and lower values indicate higher accuracy. The MSE and RMSE give an idea of the variance of the prediction errors. It is worth noting that certain KAs such as 'GV,' 'IAS,' and 'SP' exhibit zero errors in some semesters, indicating high accuracy in predictions. However, other KAs like 'AL,' 'AR,' and 'SE' show higher errors, possibly resulting from complex patterns not fully captured by the linear model or difficulties in prediction accuracy.
Table 3. MAE accuracy function in each semester KAs using leaner regression model
|
Semester |
AL |
AR |
CN |
DS |
GV |
OS |
SE |
PL |
SF |
IAS |
IM |
IS |
NC |
PD |
SP |
|
272 |
12.07 |
17.04 |
3.81 |
11.51 |
0.00 |
6.53 |
6.24 |
13.45 |
0.36 |
0.00 |
7.20 |
5.51 |
0.08 |
2.56 |
0.00 |
|
281 |
16.47 |
15.88 |
3.26 |
10.37 |
0.27 |
6.61 |
7.61 |
14.15 |
0.46 |
0.00 |
8.52 |
6.03 |
0.16 |
2.37 |
0.00 |
|
282 |
16.90 |
13.07 |
3.02 |
8.32 |
0.33 |
8.08 |
6.35 |
12.48 |
0.38 |
0.00 |
7.67 |
6.93 |
0.35 |
2.61 |
0.00 |
|
283 |
8.30 |
2.71 |
3.10 |
8.67 |
0.00 |
3.11 |
23.88 |
12.22 |
1.60 |
0.00 |
38.18 |
10.84 |
0.00 |
1.01 |
0.00 |
|
291 |
27.16 |
2.42 |
1.35 |
5.89 |
0.00 |
3.27 |
22.40 |
12.44 |
1.43 |
0.00 |
42.98 |
5.78 |
0.00 |
0.92 |
0.00 |
|
292 |
16.03 |
12.64 |
2.80 |
9.54 |
3.22 |
8.77 |
5.65 |
9.90 |
0.33 |
0.00 |
5.29 |
5.67 |
0.78 |
2.24 |
0.00 |
|
293 |
6.26 |
33.85 |
0.72 |
9.65 |
0.00 |
14.57 |
7.92 |
9.92 |
0.49 |
0.00 |
6.01 |
4.42 |
2.76 |
0.30 |
0.00 |
|
301 |
10.24 |
35.63 |
1.08 |
15.88 |
2.16 |
11.85 |
7.13 |
9.73 |
0.42 |
0.00 |
4.70 |
4.94 |
3.81 |
0.19 |
0.00 |
|
302 |
17.56 |
11.45 |
1.59 |
5.22 |
2.86 |
6.81 |
5.49 |
8.91 |
0.32 |
0.51 |
4.38 |
4.50 |
4.57 |
1.22 |
0.03 |
|
311 |
15.32 |
11.49 |
1.54 |
4.91 |
3.62 |
7.51 |
5.12 |
8.21 |
0.22 |
0.72 |
1.58 |
2.30 |
3.33 |
1.14 |
0.04 |
|
312 |
12.87 |
15.31 |
1.91 |
4.56 |
3.88 |
6.81 |
6.56 |
7.88 |
0.30 |
2.52 |
1.62 |
2.69 |
3.71 |
1.40 |
0.13 |
|
313 |
10.43 |
16.71 |
2.44 |
8.40 |
4.70 |
8.53 |
6.87 |
10.95 |
0.38 |
0.00 |
1.84 |
0.15 |
9.69 |
0.75 |
0.00 |
|
321 |
11.81 |
13.36 |
2.15 |
12.52 |
6.17 |
7.61 |
5.27 |
12.12 |
0.19 |
0.00 |
2.01 |
2.34 |
9.50 |
1.32 |
0.00 |
|
322 |
10.77 |
15.17 |
0.99 |
3.32 |
3.87 |
5.81 |
3.40 |
6.15 |
0.11 |
2.25 |
0.99 |
1.31 |
2.77 |
0.68 |
0.12 |
|
331 |
9.85 |
17.13 |
1.52 |
3.32 |
3.25 |
6.18 |
3.07 |
6.45 |
0.11 |
1.67 |
0.68 |
0.94 |
1.99 |
0.48 |
0.09 |
|
332 |
11.91 |
15.08 |
1.19 |
2.57 |
3.06 |
7.80 |
1.78 |
5.75 |
0.05 |
1.49 |
0.47 |
1.19 |
1.99 |
0.51 |
0.08 |
|
341 |
9.53 |
16.18 |
1.93 |
4.37 |
3.63 |
8.41 |
2.04 |
6.77 |
0.10 |
1.60 |
0.59 |
0.57 |
2.39 |
1.18 |
0.08 |
|
342 |
11.66 |
17.40 |
2.18 |
5.48 |
2.75 |
7.83 |
2.67 |
5.50 |
0.14 |
0.73 |
0.48 |
0.29 |
2.02 |
1.20 |
0.04 |
|
351 |
12.29 |
19.49 |
2.69 |
8.82 |
0.96 |
8.21 |
5.94 |
9.06 |
0.26 |
0.81 |
1.46 |
1.45 |
3.67 |
1.27 |
0.04 |
Table 4. MSE accuracy function in each semester KAS using leaner regression model
|
Semester |
AL |
AR |
CN |
DS |
GV |
OS |
SE |
PL |
SF |
IAS |
IM |
IS |
NC |
PD |
SP |
|
272 |
560.40 |
641.69 |
32.4 |
345.66 |
0.00 |
112.70 |
87.55 |
333.78 |
0.46 |
0.00 |
184.36 |
118.49 |
32.39 |
19.29 |
0.00 |
|
281 |
861.88 |
587.23 |
26.50 |
309.31 |
7.17 |
123.66 |
134.05 |
356.94 |
0.65 |
0.00 |
229.74 |
131.18 |
26.50 |
20.26 |
0.00 |
|
282 |
923.97 |
396.17 |
29.22 |
271.33 |
8.28 |
206.90 |
118.09 |
333.36 |
0.56 |
0.00 |
231.33 |
177.05 |
29.22 |
33.11 |
0.00 |
|
283 |
204.23 |
18.30 |
20.14 |
267.10 |
0.00 |
35.01 |
1054.03 |
261.92 |
5.29 |
0.00 |
2654.36 |
246.65 |
20.14 |
6.45 |
0.00 |
|
291 |
1553.44 |
27.18 |
6.52 |
124.33 |
0.00 |
35.36 |
1108.58 |
210.81 |
4.92 |
0.00 |
2951.05 |
144.75 |
6.52 |
6.01 |
0.00 |
|
292 |
657.01 |
330.04 |
23.78 |
293.03 |
82.53 |
172.75 |
138.39 |
241.49 |
0.64 |
0.00 |
176.09 |
163.33 |
23.78 |
24.30 |
0.00 |
|
293 |
88.89 |
1448.38 |
6.68 |
586.35 |
0.00 |
256.89 |
366.27 |
220.70 |
1.70 |
0.00 |
270.71 |
139.36 |
6.68 |
2.89 |
0.00 |
|
301 |
223.09 |
1784.04 |
4.68 |
801.75 |
46.21 |
198.88 |
348.60 |
200.35 |
1.53 |
0.00 |
257.83 |
219.28 |
4.68 |
0.57 |
0.00 |
|
302 |
632.22 |
263.91 |
12.49 |
143.20 |
86.37 |
94.27 |
99.17 |
203.43 |
0.41 |
17.02 |
135.62 |
114.46 |
12.49 |
9.90 |
0.04 |
|
311 |
494.98 |
242.44 |
14.98 |
140.71 |
92.20 |
98.78 |
106.33 |
192.29 |
0.34 |
20.98 |
16.01 |
79.99 |
14.98 |
9.98 |
0.06 |
|
312 |
410.14 |
438.22 |
17.87 |
149.64 |
102.58 |
107.96 |
165.25 |
187.55 |
0.59 |
72.79 |
20.11 |
82.87 |
17.87 |
14.36 |
0.19 |
|
313 |
238.24 |
404.27 |
20.74 |
315.90 |
124.14 |
134.57 |
170.98 |
262.53 |
0.62 |
0.00 |
12.07 |
0.90 |
20.74 |
7.68 |
0.00 |
|
321 |
229.96 |
284.64 |
15.31 |
504.72 |
286.27 |
100.96 |
126.48 |
295.77 |
0.47 |
0.00 |
11.96 |
102.60 |
15.31 |
8.43 |
0.00 |
|
322 |
200.29 |
428.15 |
7.63 |
86.51 |
177.18 |
64.87 |
71.04 |
130.84 |
0.23 |
60.04 |
6.16 |
23.84 |
7.63 |
4.24 |
0.16 |
|
331 |
155.78 |
554.13 |
17.63 |
81.44 |
106.65 |
84.93 |
85.35 |
187.50 |
0.30 |
44.92 |
4.88 |
20.73 |
17.63 |
5.43 |
0.12 |
|
332 |
219.32 |
482.96 |
10.86 |
61.02 |
96.54 |
105.05 |
24.78 |
142.18 |
0.07 |
42.19 |
2.72 |
32.32 |
10.86 |
5.43 |
0.11 |
|
341 |
184.44 |
503.00 |
16.36 |
95.00 |
99.51 |
131.38 |
26.00 |
222.14 |
0.11 |
74.74 |
6.70 |
9.80 |
16.36 |
12.02 |
0.20 |
|
342 |
204.89 |
642.10 |
23.03 |
168.07 |
67.62 |
129.42 |
60.70 |
129.71 |
0.25 |
52.38 |
3.17 |
4.03 |
23.03 |
13.64 |
0.14 |
|
351 |
250.22 |
763.85 |
27.31 |
326.87 |
21.23 |
130.60 |
158.48 |
212.09 |
0.61 |
28.48 |
16.84 |
34.55 |
27.31 |
12.72 |
0.07 |
Table 5. RMSE accuracy function in each semester KAs using leaner regression model
|
Semester |
AL |
AR |
CN |
DS |
GV |
OS |
SE |
PL |
SF |
IAS |
IM |
IS |
NC |
PD |
SP |
|
272 |
23.67 |
25.33 |
5.69 |
18.59 |
0.00 |
10.62 |
9.36 |
18.27 |
0.68 |
0.00 |
13.58 |
10.89 |
0.39 |
4.39 |
0.00 |
|
281 |
29.36 |
24.23 |
5.15 |
17.59 |
2.68 |
11.12 |
11.58 |
18.89 |
0.81 |
0.00 |
15.16 |
11.45 |
0.57 |
4.50 |
0.00 |
|
282 |
30.40 |
19.90 |
5.41 |
16.47 |
2.88 |
14.38 |
10.87 |
18.26 |
0.75 |
0.00 |
15.21 |
13.31 |
0.87 |
5.75 |
0.00 |
|
283 |
14.29 |
4.28 |
4.49 |
16.34 |
0.00 |
5.92 |
32.47 |
16.18 |
2.30 |
0.00 |
51.52 |
15.71 |
0.00 |
2.54 |
0.00 |
|
291 |
39.41 |
5.21 |
2.55 |
11.15 |
0.00 |
5.95 |
33.30 |
14.52 |
2.22 |
0.00 |
54.32 |
12.03 |
0.00 |
2.45 |
0.00 |
|
292 |
25.63 |
18.17 |
4.88 |
17.12 |
9.08 |
13.14 |
11.76 |
15.54 |
0.80 |
0.00 |
13.27 |
12.78 |
1.81 |
4.93 |
0.00 |
|
293 |
9.43 |
38.06 |
2.59 |
24.21 |
0.00 |
16.03 |
19.14 |
14.86 |
1.31 |
0.00 |
16.45 |
11.81 |
3.13 |
1.70 |
0.00 |
|
301 |
14.94 |
42.24 |
2.16 |
28.32 |
6.80 |
14.10 |
18.67 |
14.15 |
1.24 |
0.00 |
16.06 |
14.81 |
6.81 |
0.76 |
0.00 |
|
302 |
25.14 |
16.25 |
3.53 |
11.97 |
9.29 |
9.71 |
9.96 |
14.26 |
0.64 |
4.13 |
11.65 |
10.70 |
9.93 |
3.15 |
0.21 |
|
311 |
22.25 |
15.57 |
3.87 |
11.86 |
9.60 |
9.94 |
10.31 |
13.87 |
0.58 |
4.58 |
4.00 |
8.94 |
6.69 |
3.16 |
0.23 |
|
312 |
20.25 |
20.93 |
4.23 |
12.23 |
10.13 |
10.39 |
12.85 |
13.69 |
0.77 |
8.53 |
4.48 |
9.10 |
7.68 |
3.79 |
0.44 |
|
313 |
15.44 |
20.11 |
4.55 |
17.77 |
11.14 |
11.60 |
13.08 |
16.20 |
0.79 |
0.00 |
3.47 |
0.95 |
17.28 |
2.77 |
0.00 |
|
321 |
15.16 |
16.87 |
3.91 |
22.47 |
16.92 |
10.05 |
11.25 |
17.20 |
0.69 |
0.00 |
3.46 |
10.13 |
16.65 |
2.90 |
0.00 |
|
322 |
14.15 |
20.69 |
2.76 |
9.30 |
13.31 |
8.05 |
8.43 |
11.44 |
0.48 |
7.75 |
2.48 |
4.88 |
4.90 |
2.06 |
0.40 |
|
331 |
12.48 |
23.54 |
4.20 |
9.02 |
10.33 |
9.22 |
9.24 |
13.69 |
0.54 |
6.70 |
2.21 |
4.55 |
3.61 |
2.33 |
0.34 |
|
332 |
14.81 |
21.98 |
3.29 |
7.81 |
9.83 |
10.25 |
4.98 |
11.92 |
0.26 |
6.50 |
1.65 |
5.69 |
3.58 |
2.33 |
0.33 |
|
341 |
13.58 |
22.43 |
4.05 |
9.75 |
9.98 |
11.46 |
5.10 |
14.90 |
0.33 |
8.65 |
2.59 |
3.13 |
4.53 |
3.47 |
0.44 |
|
342 |
14.31 |
25.34 |
4.80 |
12.96 |
8.22 |
11.38 |
7.79 |
11.39 |
0.50 |
7.24 |
1.78 |
2.01 |
4.00 |
3.69 |
0.37 |
|
351 |
15.82 |
27.64 |
5.23 |
18.08 |
4.61 |
11.43 |
12.59 |
14.56 |
0.78 |
5.34 |
4.10 |
5.88 |
7.22 |
3.57 |
0.27 |
5.2 Predict student performance across semester
This study presents a framework for predicting students' academic performance in upcoming semesters. The framework uses individual linear regression models for each subject, utilizing historical academic data to forecast future performance. This tailored approach guarantees accurate predictions by considering each student's unique educational journey.
Figure 31. Heatmap of correlation between actual and predictve student grades in semester 272
To evaluate the accuracy of predictions, the study uses MAE, MSE, and RMSE metrics. The performance of each KA is evaluated, providing a comprehensive and detailed assessment of the model's effectiveness. A lower MAE value indicates closer alignment with actual scores, while RMSE offers insight into the variance of predictions.
Figure 32. Heatmap of correlation between actual and predictve student grades in semester 293
To provide a more in-depth analysis, the study uses heat maps to visualize correlation analyses in selected classrooms. These heat maps illustrate the relationship between various academic attributes and their impact on predictions, offering a dynamic view of the academic landscape. Each semester's data is represented, showing the linear relationship between predicted and actual scores across different KAs. The color-coded matrix in these heat maps ranges from blue (negative correlation) to red (positive correlation), making the direction and strength of these relationships clear.
The results of predicting student performance during semester 272 showed that some KAs such as "GV," "IAS," and "SP" had no errors, indicating perfect prediction, which is very unusual and may require further investigation for possible data leakage or overprocessing. On the other hand, knowledge domains such as "AL," "IS," and "SE" show relatively higher errors, indicating more variability in the predictions or perhaps a more complex underlying pattern that the linear model fails to capture, as shown in Figure 31.
The semester 293 matrix gives a color scale ranging from -0.09 to 0.68. In this matrix, several categories, such as "CN" and "IM," show a relatively strong positive correlation, while a few other categories, such as "DS" and "NC," show a slight negative correlation. "AR" has an exceptionally high MAE and RMSE, indicating lower predictive accuracy for this category. In contrast, "GV," "IAS," "SP," and "SP" all have errors equal to zero, indicating that the predictions for these categories were either perfect or no forecasts, as shown in Figure 32.
In the correlation matrix for semester 322, the coefficients range from -0.09 to 0.16. The IM shows the strongest positive correlation (0.16), while the PL shows a significantly strong negative correlation (-0.09), indicating an inverse relationship. IAS and SP show shallow error measures, indicating high consistency or predictability of scores for these courses, as shown in Figure 33.
Figure 33. Heatmap of correlation between actual and predictve student grades in semester 322
Correlation Matrix 351 Coefficients range from -0.13 to 0.02. PL showed the highest positive correlations, and KAs such as OS and AL showed negative, although weak, correlations. However, IAS and SP had shallow error measures, indicating high consistency or predictability in grades for this semester, as shown in Figure 34.
Figure 34. Heatmap of correlation between actual and predictve student grades in 351
This detailed analysis highlights the differences in accuracy when predicting academic performance across various semesters and KAs. The results indicate that some KAs have a high level of predictability, while others show more significant variability, which reflects the complex nature of academic performance. These insights are essential for improving educational techniques and providing better support to computer science students.
This study has made significant progress in predicting the performance of computer science students using EDM and the BoK associated with ACM 2013. By analyzing data from 2756 students and using linear regression models, we examined performance patterns across 18 KAs and a variety of courses.
Our research indicates that the accuracy of our predictions varied significantly depending on the course and semester. Specifically, our models achieved high accuracy in courses such as Software Engineering, Operating Systems, and Artificial Intelligence, suggesting that these areas align well with the BoK framework and students' abilities. However, we found significant variances in other areas, which could indicate potential gaps in the curriculum or students' understanding.
According to the evaluation metrics, such as MSE, MAE, and RMSE, some courses can be predicted with high accuracy. For instance, in the case of "Systems Programming," the MAE value was significantly low, which indicates a close match between the predicted and actual performance. However, for courses such as "Compiler Design," the RMSE values were higher, which implies less reliable predictions.
The information obtained from these insights is precious for educational institutions. It helps to point out the areas that require improvement in the curriculum and the teaching methods that need to be targeted. By identifying these gaps between predicted and actual performance, educators can customize their teaching approaches to enhance students' learning outcomes.
Upon reflection of our methodology, we acknowledge that linear regression provided a strong foundation for our predictive models. However, its limitations in handling non-linear relationships and potential overfitting highlight the need for more advanced methods in future research studies.
Future research should consider adding more variables, like student engagement metrics or nuanced aspects of teaching quality, to the existing models to enhance the accuracy and depth of insights into student performance patterns. Advanced statistical techniques, such as machine learning algorithms, can improve prediction accuracy and offer a more detailed analysis.
This study concludes that EDM has the potential to predict student performance in computer science programs within the framework of ACM's BoK. The study emphasizes the complex connection between educational backgrounds, resources, teaching methods, and student success. The findings of this study not only add to the existing academic literature but also provide practical guidance for educators and institutions that aim to improve the quality and effectiveness of computer science education.
The researchers would like to thank the Deanship of Scientific Research, Qassim University for continuous support.
[1] Saa, A.A. (2016). Educational data mining & students ’ performance prediction, International Journal of Advanced Computer Science and Applications, 7(5): 212–220. https://doi.org/10.14569/ijacsa.2016.070531
[2] Mi, C. (2019). Student performance early warning based on data mining. International Journal of Performability Engineering, 15(3): 822-833. https://doi.org/10.23940/ijpe.19.03.p11.822833
[3] Roach, S., Sahami, M. (2015). CS2013: Computer science curricula 2013. Curriculum Guidelines for Undergraduate Degree Programs in Computer Science, 48(3): 114-116. https://doi.org/10.1109/MC.2015.68
[4] Hellas, A., Ihantola, P., Petersen, A., Ajanovski, V.V., Gutica, M., Hynninen, T., Knutas, A., Leinonen, J., Messom, C. Liao, S.N. (2018). Predicting academic performance: A systematic literature review. In Proceedings Companion of the 23rd Annual ACM Conference On Innovation and Technology in Computer Science Education, pp. 175-199. https://doi.org/10.1145/3293881.3295783
[5] Namoun, A., Alshanqiti, A. (2020). Predicting student performance using data mining and learning analytics techniques: A systematic literature review. Applied Sciences, 11(1): 237. https://doi.org/10.3390/app11010237
[6] Ahmed, S.A., Billah, M.A., Khan, S.I. (2020). A machine learning approach to performance and dropout prediction in computer science: Bangladesh perspective. In 2020 11th International Conference on Computing, Communication and Networking Technologies (ICCCNT), Kharagpur, India, pp. 1-6. https://doi.org/10.1109/ICCCNT49239.2020.9225603
[7] Nosseir, A., Fathy, Y. (2020). A mobile application for early prediction of student performance using fuzzy logic and artificial neural networks. International Journal of Interactive Mobile Technologies (iJIM), 14(2): 4-18. https://doi.org/10.3991/ijim.v14i02.10940
[8] Jain, A., Solanki, S. (2019). An efficient approach for multiclass student performance prediction based upon machine learning. In 2019 International Conference on Communication and Electronics Systems (ICCES), Coimbatore, India, pp. 1457-1462. https://doi.org/10.1109/ICCES45898.2019.9002038
[9] Kuehn, M., Estad, J., Straub, J., Stokke, T., Kerlin, S. (2017). An expert system for the prediction of student performance in an initial computer science course. In 2017 IEEE International Conference on Electro Information Technology (EIT), Lincoln, NE, USA, pp. 1-6. https://doi.org/10.1109/EIT.2017.8053321
[10] Bravo-Agapito, J., Romero, S. J., Pamplona, S. (2021). Early prediction of undergraduate Student's academic performance in completely online learning: A five-year study. Computers in Human Behavior, 115: 106595. https://doi.org/10.1016/j.chb.2020.106595
[11] Gull, H., Saqib, M., Iqbal, S.Z., Saeed, S. (2020). Improving learning experience of students by early prediction of student performance using machine learning. In 2020 IEEE International Conference for Innovation in Technology (INOCON), Bangluru, India, pp. 1-4. https://doi.org/10.1109/INOCON50539.2020.9298266
[12] Nuankaew, W., Thongkam, J. (2020). Improving student academic performance prediction models using feature selection. In 2020 17th International Conference on Electrical Engineering/Electronics, Computer, Telecommunications and Information Technology (ECTI-CON), Phuket, Thailand, pp. 392-395. https://doi.org/10.1109/ecti-con49241.2020.9158286
[13] Chui, K.T., Fung, D.C.L., Lytras, M.D., Lam, T.M. (2020). Predicting at-risk university students in a virtual learning environment via a machine learning algorithm. Computers in Human behavior, 107: 105584. https://doi.org/10.1016/j.chb.2018.06.032
[14] Kumar, A.N. (2018). Predicting student success in computer science-A reproducibility study. In 2018 IEEE Frontiers in Education Conference (FIE), San Jose, CA, USA, pp. 1-6. https://doi.org/10.1109/FIE.2018.8658429
[15] Lee, C.A., Tzeng, J.W., Huang, N.F., Su, Y.S. (2021). Prediction of student performance in massive open online courses using deep learning system based on learning behaviors. Educational Technology & Society, 24(3): 130-146.
[16] Xu, Z., Yuan, H., Liu, Q. (2020). Student performance prediction based on blended learning. IEEE Transactions on Education, 64(1): 66-73. https://doi.org/10.1109/TE.2020.3008751
[17] Yan, K. (2021). Student performance prediction using XGBoost method from a macro perspective. In 2021 2nd International Conference on Computing and Data Science (CDS), Stanford, CA, USA, pp. 453-459. https://doi.org/10.1109/CDS52072.2021.00084
[18] MD, S., Krishnamoorthy, S. (2022). Student performance prediction, risk analysis, and feedback based on context-bound cognitive skill scores. Education and Information Technologies, 27(3): 3981-4005. https://doi.org/10.1007/s10639-021-10738-2
[19] Subahi, A.F. (2018). Data collection for career path prediction based on analysing bok of computer science degrees. Journal of Software, 13(10): 533-546. https://doi.org/10.17706/jsw.13.10.533-546
[20] Butt, N.A., Mahmood, Z., Shakeel, K., Alfarhood, S., Safran, M., Ashraf, I. (2023). Performance prediction of students in higher education using multi-model ensemble approach. IEEE Access, 11: 136091-136108. https://doi.org/10.1109/ACCESS.2023.3336987
[21] Suarez, C.G.H., Llanos, J., Bucheli, V.A. (2023). Predicting the final grade using a machine learning regression model: Insights from fifty percent of total course grades in CS1 courses. PeerJ Computer Science, 9 (2023): e1689. https://doi.org/10.7717/peerj-cs.1689