Aeshah Tareq Abdulateef*![]() | Saad A. Makki
| Saad A. Makki![]()
© 2023 IIETA. This article is published by IIETA and is licensed under the CC BY 4.0 license (http://creativecommons.org/licenses/by/4.0/).
OPEN ACCESS
The prominence of Indoor Navigation Systems (INS) has been on an upward trajectory in recent years. While the Global Positioning System (GPS) commonly utilizes radio waves from artificial satellites for positioning information, its precision is compromised indoors due to potential radio wave obstruction by buildings. In contrast, pedometers, a critical component of INS, can provide invaluable insights into health, exercise, and user itineraries by detecting the number of steps and pinpointing optimal indoor positions. This paper proposes the development of a high-accuracy pedometer system. The proposed tracking system capitalizes on data harvested from accelerometers, sensors integrated into mobile devices, to furnish indoor tracking predicated on a straightforward pedometer approach. Online measurements and tests were conducted in residential settings, and the recorded tests were subsequently simulated offline via MATLAB. The performance of the system was evaluated in a real-world indoor residential scenario using an iPhone6 mobile device, with the discussion encompassing potential usability aspects of the approach. The devised system mitigated the drift of sensor readings by amalgamating the data from the gyroscope and accelerometer. The experimental results revealed a percentage error of 4.33% for the proposed method, translating to an error of 0.65 meters from an average walking distance of approximately 3 meters, out of 15 meters. Future research endeavors will concentrate on enhancing the accuracy of the approach by implementing data filtering and interference reduction techniques.
Indoor Navigation Systems (INS), pedometer accelerometer orientation, Direction Cosine Matrix, step detection, Pedestrian Dead Reckoning (PDR), Root Mean Square Error, smartphone sensors, indoor positioning
Position stabilization and bridging brief positioning gaps represent prominent applications of Indoor Navigation Systems (INS), with tracking and localization of moving entities in indoor environments emerging as a significant area of research. This field boasts a plethora of applications, including location-aware computing, locating and rescuing first responders, mixed or augmented reality, 3D audio on mobile devices, and navigation assistance [1].
In the context of the increasing ubiquity of smartphones, pedestrian navigation systems have seen a rise in prevalence. While the Global Positioning System (GPS) traditionally leverages artificial satellite radio waves for positioning data, its precision is compromised indoors due to potential obstruction of these waves by buildings. An effective alternative in indoor environments is the Pedestrian Dead Reckoning (PDR) method, which utilizes acceleration and angular velocity sensors to estimate walking distance and direction, thereby calculating user positions [2, 3]. PDR approaches are often more cost-effective than Wi-Fi access points and Bluetooth beacons as they do not necessarily rely on external infrastructures [4-6].
PDR has attracted significant attention due to its wide range of applications, including monitoring public safety personnel and individuals with special needs [7, 8]. The availability of compact, affordable MEMS inertial sensors [9] has undoubtedly influenced this surge in interest, with the accuracy and cost-effectiveness of these sensors having improved significantly over the past decade. PDR typically operates as a self-contained navigation system [10], solely relying on inertial sensors. However, this self-reliance can lead to drift over time due to the incorporation of the uncompensated time-varying bias of consumer-grade MEMS inertial sensors. To mitigate this, an absolute positioning system is often required for prolonged use. For outdoor navigation, cellular networks and GNSS are typically used to assist PDR, whereas indoor navigation often employs Bluetooth [11], Wi-Fi [12, 13], ultrasonic ranging, or ultra-wideband (UWB) [14, 15]. When building map information is available, map-matching may also be used [16, 17].
Smartphones have been widely utilized in this field [18-20]. For instance, Correa et al. [21] developed a PDR approach using a smart watch and smart glass, integrating geomagnetic and acceleration sensors from the watch to estimate direction. This technique demonstrated step detection error of less than 0.4% and distance calculation error of less than 2.4% in 800m walks and runs. Correra et al. proposed a PDR approach using a smart watch and smartphone [22], leveraging both smartphone sensors and Wi-Fi signal strength. This model achieved an accuracy of up to 1.4mm over 6000 m2 of terrain.
An et al. [23] constructed a PDR-based INS using map matching and a smartphone's inertial measurement unit, resulting in a user-friendly INS that requires only a smartphone. An et al. experimented with a vision-based INS that used image data from a smartphone camera [24]. Despite the cost-effectiveness of using a smartphone to capture indoor environments compared to employing a robot, the effort required to develop and research indoor location estimation systems could be more efficiently utilized. To compensate for these limitations, images captured with a smartphone were used, achieving an average position error_rate of 4.3% and maximum position error_rate of 10%.
This study presents the development of a smartphone-based pedometer predicated on acceleration, utilizing an iPhone6 to gather accelerometer data. This data underwent synchronization, moving average filtering, and normalization. The processed data entered the pedometer unit and underwent a series of mathematical operations to derive a set of values representing the signal extremes from the readings. These values were subsequently used for direction estimation.
The methodology of this research is elaborated upon in Section 2. Section 3 presents the mathematical model of the system. Section 4 provides the results of the method, and Section 5 concludes the paper.
2.1 System architecture
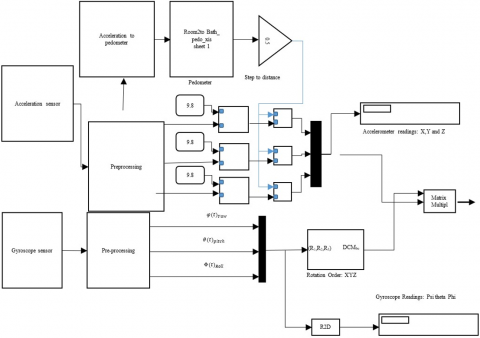
Our method relies on a straightforward step counter model that tracks the motion of the user's hips to count each step the user takes. It can keep track of the user's distance traveled in meters and steps (distance=number of steps x step length). Our pedometer model counts steps and enables indoor tracking for users of mobile devices using inertial sensors (accelerometer) and software. Figure 1 shows the block diagram of system architectural design.
The system uses a smartphone(A), iPhone 6 device, that assists the user in locating themselves using the proposed method. The device is loaded with a software module responsible for calculating the path of user location relative to known features in the data, (B) MATLAB drive: the android OIS smartphone connects to the MATLAB work cloud through MATLAB mobile to create and edit files display results, and obtain data from sensors, (C) acceleration to pedometer, a program that converts accelerometer readings into step counters, (D) steps to distance Converting steps into distances on the ground is done by multiplying the number of steps by 0.5, (E) indoor navigation system, it is an aid to navigation that uses a computer, motion sensors (accelerometer), and rotation sensors (gyroscope) to estimate a moving object's position, direction, and speed and (F) a virtual map, created in a centralized smartphone device, allows users to see the transition from one place to another for defined features on the ground.
2.2 System mathematical model
The mathematical model of the proposed system includes a set of stages that will be explained in detail in the subsection below. Figure 2 illustrates the proposed system design.
2.3 Data initialization
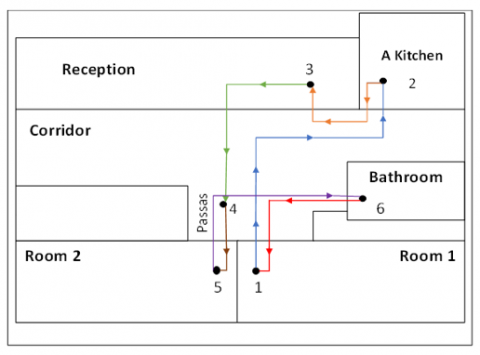
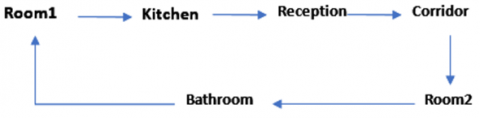
In the proposed system, it is planned to locate a user inside a one-story building consisting of several different places, where the user moves between those places, the Figure 3, shows the map and the user's travel paths (1→2→3→4→5→6→1).
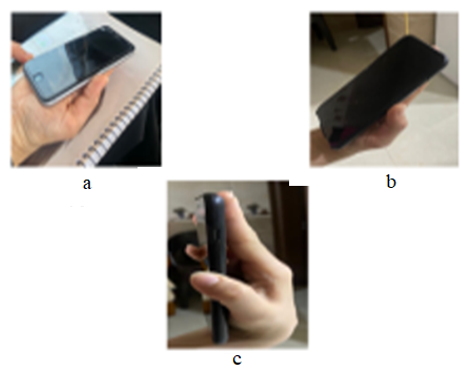
The data were generated using the MATLAB PHONE Program, a smartphone device the user holds while moving along the mapped paths. Where the accelerometer and orientation sensor are selected and triggered, the obtained data is sent to storage in MATLAB drive to deal with it in the next stage. Several experiments were conducted to obtain the data required to test the validity of the mathematical model of the proposed system. The phone angle is taken into account when the data is gathered. The data is recorded in three modes based on phone angle (0, 45, 90), as illustrated in the Figure 4.
Figure 1. Architectural design of the system
Figure 2. The proposed system block diagram
Figure 3. User transmission map
Figure 4. The mobile device modes, a) angle 0, b) angle 45, c) angle 90
The preprocessing process used for the data in our work consists of three following stages:
(1) Synchronization
The readings of the acceleration and orientation sensors are synchronized, and the sample time for each sensor is unified so that it is uniform. Synchronize orientation and acceleration samples by matching sample rates with a tolerance of 10e-10.
(2) Moving average filter
Works to remove the high frequencies of the signal through the rate of each time using the equation [1, 2].
$F=\frac{1}{N} \sum_{n=i}^{n=N+i} S(n)$ (1)
where, S(n) is for accelerometer and orientation signals.
(3) Normalization
Through it’s the process of converting data into another format and restricting it between 0 and 1 [3, 4].
2.4 Pedometer
After preprocessing the accelerometer readings, the pedometer steps signal must be calculated to initialize the data as input to the indoor navigation system stage. These signals contain peaks of the steps of the moving body, which is in an unstable position up and down, and therefore we will use the standard deviation as a variable threshold. This is done through mathematical operations performed on the acceleration data, which are explained in detail in Algorithm 1, with the equations used.
|
Input: Output: Process Step 1: Step 2: Step 3:
Step 4: Step 5: Step 6: |
Algorithm (1): Pedometer Accelerometer data after preprocessing. Pedometer readings.
Accelerometer reading. Calculate Fa by using Eq. (1). Calculate magnitude of acceleration. $F_{m a g}=\sqrt{\sum\left(F_X^2+F_Y^2+F_Z^2\right)}$ (2) where, $F_X, F_Y$ and $F_Z$ are the XYZ coordinates of the acceleration. Normalize the magnitude by subtracting the mean. $F_{\text {norm }}=F_{\text {mag }}-\overline{F_{\text {mag }}}$ (3) Calculate the standard deviation $\sigma_F$ for $F_{\text {norm }}$ by using Eq. (4). Standard Deviation=$\sqrt{\frac{\sum_{j=1}^m\left(y_j-\acute{y}\right)^2}{m-1}}$ (4) Find local maxima using the following steps:
|
2.5 System mathematics
Let i represents the number of paths that user moves on the map, according to the map Figure 3 approved in this thesis i=1,2,3…,6.
Let j the number of recorded readings from the acceleration and orientation sensors.
Let: Ax: acceleration over x, Ay: acceleration over y, Az: acceleration over z.
The acceleration:
$A_{\text {axis }}=\left(A_x, A_y, A_z\right)^T=\left(x_{i j}, y_{i j}, z_{i j}\right)^T$ (5)
Reading recorded from the acceleration. Sensor after preprocessing, where Xij,Yij and Zij represent acceleration the axis for the track (i). Let's symbolize the measurement of rotation around the axis that is measured by gyroscopes:
$O_{\text {axis }}=\left(O_x, O_y, O_z\right)=\left(\emptyset_{i j}, \Phi_{i j}, \varphi_{i j}\right)$ (6)
where,
$O_{\text {axis }}$ =orientation
$\Phi_i$=pitch (around X)
$\emptyset_{\mathrm{I}}$=Roll (around Y)
$\varphi_{\mathrm{i}}$=yaw (around Z)
When the device is not rotation the sensor values will be zeroes. let ui represent the extremes ends of the signal resulting from the reading. It also represents the number of steps and the output of the pedometer. DCM input are the yaw, pitch, and roll φ, $\emptyset$, Φ respectively.
$D C M=\left[\begin{array}{ccc}\cos \Theta \cos \Psi & \cos \Theta \sin \Psi & -\sin \Theta \\ \sin \Phi \cos \Psi-\cos \Phi \sin \Psi & \sin \Phi \sin \Psi \sin \Theta+\cos \Phi \cos \Psi & \sin \Phi \cos \theta \\ \cos \Phi \sin \Theta \cos \Psi+\sin \Phi \sin \Psi & \cos \Phi \sin \Psi \sin \Theta-\sin \Phi \cos \Psi & \cos \Phi \cos \theta\end{array}\right]$ (7)
Let Vxb, Vyb and Vzb velocity over axes and Dxb, Dyb, and Dzb distance over axes. After recording the readings and preprocessing, a set of operations in performed to reach the main goal, as shown in the general outline of the system and as indicated in the following steps.
The readings recorded in the pedometer, which represent the steps of the users movement in the track (i), are converted into distances as follows:
Distance $=$ step $*(0.5)=u_i *(0.5)$ (8)
The readings recorded in the accelerometer sensor after preprocessing are divided by:
$\mathrm{A}=\frac{\text { Aaxes }}{9.8}=\left(\frac{X i j}{9.8}, \frac{Y i j}{9.8}, \frac{Z i j}{9.8}\right)$ (9)
The results of the two Eqs. (8) and (9) are summed:
$\mathrm{B}=\mathrm{A}+$ Distance (10)
The readings recorded in the orientation sensor after preprocessing are entered into the DCM as illusterated in Figure 5.
Figure 5. The DCM Process
Multiply the transpose of the matrix B with the matrix DCM obtained from the fourth step, we get the acceleration prediction (AP):
$\mathrm{AP}=B^T \cdot D C M_{3 * 3}=\left(A_{x h}, A_{y h}, A_{z h}\right)$ (11)
where, Axb, Ayb and Azb represent the acceleration prediction over X, Y and Z respectively.
The final stage in the proposed system is to perform numerical integrals with respect to time. We integrate the expected acceleration to get the expected velocity:
$\begin{aligned} & V_{x b}=\int A_{x b} d t ; V_{x b}(0)=0 \\ & V_{y b}=\int A_{y b} d t ; V_{y b}(0)=0 \\ & V_{z b}=\int A_{z b} d t ; V_{z b}(0)=0\end{aligned}$ (12)
We integrate the expected velocity defined in Eq. (9), to get the expected distance:
$\begin{aligned} & D_{x b}=\int V_{x b} d t ; D_{x b}(0)=0 \\ & D_{y b}=\int V_{y b} d t ; D_{y b}(0)=0 \\ & D_{z b}=\int V_{z b} d t ; D_{z b}(0)=0\end{aligned}$ (13)
3.1 Experimental results
The environment under which the system is implemented is Android Platform. MATLAB Version R2021a Update 5(9.10.0.1739362). 64bit (win64). The results that we review and discuss include the results of one experiment of the user's movements inside the building, the paths of which are identified in Figure 6.
Figure 6. The path map
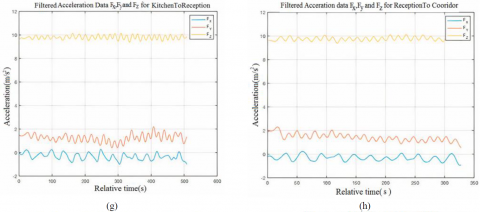
The relationship between acceleration and time relative to coordinate values x, y, and z. While the same relationship data refined using the filter is illustrated in Figure 7 (a)-(j).
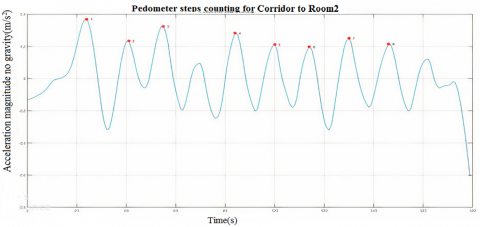
Figure 8 shows the final readings obtained from the pedometer unit, which will deal with other entities in the model to implement the proposed system. The values that represent the peaks are indicated in red. Which was obtained by comparing it with the standard deviation, which represents the variable threshold.
Table 1 shows how the RMS error of the positioning approach in conjunction with the map information has a particular correcting impact on the error buildup. The RMSE is calculated using Eq. (14) [5].
$R M S E=\sqrt{\left(\frac{1}{n} \sum_{j=1}^n\left(P_j-\hat{P}_j\right)^2\right)}$ (14)
For two random variable vectors A which is the actual point, and B for the predicted point, the covariance is defined as:
$\operatorname{cov}(A, B)=\frac{1}{N-1} \sum_{i=1}^N(A i-\mu A) *(B i-\mu B)$ (15)
where, μA is the mean of A, μB is the mean of B, and * denotes the complex conjugate. The covariance matrix of the two random variables is the matrix of pairwise covariance calculations between each variable,
$C=\left(\begin{array}{ll}\operatorname{cov}(A, A) & \operatorname{cov}(A, B) \\ \operatorname{cov}(B, A) & \operatorname{cov}(B, B)\end{array}\right)$ (16)
Table 1. Average Root Mean Square Error of the system in pixels
|
Experiment |
CovX |
CovY |
Max Error X |
Max Error Y |
|
Room1 to Kitchin |
156554.1 |
425798.063 |
37.90234 |
117.8528 |
|
Reception to Corridor |
1484.314 |
3835.63603 |
35.38911 |
35.69868 |
|
Corridor to Room2 |
1329.445 |
2024.142 |
90.14825 |
72.73383 |
|
Kithchin to Reception |
145083.9 |
39037749.4 |
66.89605 |
17.63339 |
|
Room2 to Bath |
2928.516 |
13103.8416 |
5.07348 |
62.05778 |
|
Average |
61476.0573 |
7896502.21 |
47.0818444 |
61.1953028 |
The maximum average error was at 54.14 pixels. To convert it to meter the drawing Scale will be used. For each 500 pixels the scale is 83.333 to equal 6 meter. Then applying the scale on the highest average obtained from Table 1 as follows.
Meter $=$ Pixel $/$ scale
$54.14 / 83.3333=0.65$ meter error from around 3 meters of average walking from total$(15$ meter of walking $)$ (17)
The percentage error is computed using Eq. (15).
$\begin{gathered}\text { Percentage Error }=100 * \text { Error in Meter } / \text { total walking } \\ \text { experiments } \\ \text { Percentage Error }=100 * 0.65 / 15=4.33 \%\end{gathered}$ (18)
According to the conventional method, the current estimate of travel direction is based on the previous estimate. Consequently, if an estimation error of a large magnitude occurs once, it may continue to occur, and its frequency may increase. Sequential estimation of the traveling direction can be performed with the proposed method regardless of previous information about the traveling direction. As a result, even if a large estimation error occurs momentarily, the direction can be corrected the next time.
One of the drawbacks of the PDR system is the drift of sensor readings. The proposed system reduced it by integrating the gyroscope and accelerometer readings. In addition, the preprocessing step reduced the effect of signal distortion on system results. The proposed method is low-cost and applicable since it doesn`t need an external device, only the smartphone, and does not depend on a physical map.
Figure 7. Acceleration data x, y and z for (a) Room1 to Kitchen, (b) Kitchen to Reception, (c) Reception to Corridor, (d) Corridor to Room2, (e) Room2 to Bath. Filtered acceleration data Fx, Fy and Fz for (f) Room1 to Kitchen, (g) Kitchen to Reception, (h) Reception to Corridor, (i) Corridor to Room2, (j) Room2 to Bath
(a) Room1 to Kitchen (Mean=9.8875±0.18013)
(b) Kitchen to Reception (Mean=9.8744±0.16286)
(c) Kitchen to Reception (Mean= 9.8792±0.16013)
(d) Corridor to Room2 (Mean= 9.8935±0.17109)
(e) Room2 to Bath (Mean= 9.8799±0.20145)
Figure 8. Pedometer steps counting
roscope in a smartphone and map matching was proposed. The suggested system does not need other infrastructure and operates with a pedestrian walking with a smartphone. The trajectory of a pedestrian is initially estimated using a pedometer, and the approximate trajectory is then corrected using knowledge of the indoor environment obtained by map matching. From the experiment, the proposed method percentage error is 4.33%, which is 0.65 meter error from around 3 meters of average walking from total (15 meters of walking). The system shows good bath localization accuracy. The error is produced due to sensor reading and the scale operation, which is used to match the map size. The results of the experiments demonstrate that map matching may effectively assist pedometers, and the proposed scheme offers precise bath localization.
One of the drawbacks of the PDR system is the drift of sensor readings. The proposed system reduced it by integrating the gyroscope and accelerometer readings. In the future, we will focus on improving the accuracy of our approach by using data filtering and interference reduction techniques.
[1] Lakshmi, D.S., Divya, A., Sreedevi, E., Kolagani, R., Gottumukkala, P., Muddana, A. (2023). A study and analysis on pedestrian detection and tracking through rear-view images. Ingénierie des Systèmes d’Information, 28(1): 23-30. https://doi.org/10.18280/isi.280103
[2] Kunhoth, J., Karkar, A., Al Maadeed, S., Al Ali, A. (2020). Indoor positioning and wayfinding systems: A survey. Human-centric Computing and Information Sciences, 10(1): 18. https://doi.org/10.1186/s13673-020-00222-0
[3] Al-Hashemy, R.H.H., Saadoon, I.M. (2021). An intelligent algorithm to reduce and eliminate coverage holes in the mobile network. Journal of Intelligent Systems, 30: 920-930. https://doi.org/10.1515/jisys-2021-0046
[4] Wakaizumi, T., Togawa, N. (2021). An indoor positioning method using smartphone and smartwatch independent of carrying modes. In 2021 IEEE International Conference on Consumer Electronics (ICCE), Vegas, NV, USA, pp. 1-6. https://doi.org/10.1109/ICCE50685.2021.9427738
[5] Yu, B., Zhang, M., Chen, B. (2021). Pedestrian navigation method based on PDR/INS KF fusion and height update for three-dimensional positioning. Journal of Physics: Conference Series, 1903(1): 012064. https://doi.org/10.1088/1742-6596/1903/1/012064
[6] Makki, D.S.A., Ghafoor, M.F.A. (2021). An epilepsy detection system based on smartphone acceleration sensors. Design & Engineering, 6: 3747-3757
[7] Beauregard, S. (2006). A helmet-mounted pedestrian dead reckoning system. In 3rd International Forum on Applied Wearable Computing 2006, Bremen, Germany, pp. 1-11.
[8] Khalaf, R., Mohammed, A., Ali, H., Essa, E. (2019). Controlling smart home activities using IoT. In 2019 International Conference on Computing and Information Science and Technology and Their Applications (ICCISTA), Kirkuk, Iraq, pp. 1-6. https://doi.org/10.1109/ICCISTA.2019.8830664
[9] Fang, L., Antsaklis, P.J., Montestruque, L.A., McMickell, M.B., Lemmon, M., Sun, Y., Fang, H., Koutroulis, I., Haenggi, M., Xie, M., Xie, X.J. (2005). Design of a wireless assisted pedestrian dead reckoning system-the NavMote experience. IEEE Transactions on Instrumentation and Measurement, 54(6): 2342-2358. https://doi.org/10.1109/TIM.2005.858557
[10] Mezentsev, O., Lachapelle, G., Collin, J. (2005). Pedestrian dead reckoning: A solution to navigation in GPS signal degraded areas? Geomatica, 59(2): 175-182. https://doi.org/10.5623/geomat-2005-0023
[11] Dinh, T.M.T., Duong, N.S., Sandrasegaran, K. (2020). Smartphone-based indoor positioning using BLE iBeacon and reliable lightweight. IEEE Sensors Journal, 20(17): 10283-10294. https://doi.org/10.1109/JSEN.2020.2989411
[12] Zhuang, Y., El-Sheimy, N. (2015). Tightly-coupled integration of WiFi and MEMS sensors on handheld devices for indoor pedestrian navigation. IEEE Sensors Journal, 16(1): 224–234. https://doi.org/10.1109/JSEN.2015.2477444
[13] Abbas, S.H., Khanjar, I.M. (2019). Managing data transmission to improve lifetime of wireless sensor network. In 2019 First International Conference of Computer and Applied Sciences (CAS), 2 Baghdad, Iraq, pp. 28-33. https://doi.org/10.1109/CAS47993.2019.9075466
[14] Zihajehzadeh, S., Yoon, P.K., Kang, B.S., Park, E.J. (2015). UWB-aided inertial motion capture for lower body 3-D dynamic activity and trajectory tracking. IEEE Transactions on Instrumentation and Measurement, 64(12): 3577–3587. https://doi.org/10.1109/TIM.2015.2459532
[15] Yang, H., Kuang, Y., Wang, M., Bao, X., Yang, Y. (2020). Indoor mobile localization based on a tightly coupled UWB / INS integration. 2020 16th International Conference on Control, Automation, Robotics and Vision (ICARCV), Shenzhen, China, 1354-1359. https://doi.org/10.1109/ICARCV50220.2020.9305307
[16] Saeed, N.A., Al-Ta’i, Z.T.M. (2020). Heart disease prediction system using optimization techniques. In New Trends in Information and Communications Technology Applications, 167-177. https://doi.org/10.1007/978-3-030-55340-1_12.
[17] Chyad, H.S., Mustafa, R. A., Haleot, R.A. (2018). An effective protocol and algorithmic approach for disaster management using wireless sensor networks. Journal of Advanced Research in Dynamic and Control Systems, 10(S13): 2405-2410.
[18] Alabbasi, H., Gradinaru, A., Moldoveanu, F., Moldoveanu, A. (2015). Human motion tracking & evaluation using kinect V2 sensor. In The 5th IEEE International Conference on E-Health and Bioengineering (EHB), Iasi, Romania, pp. 1-4. https://doi.org/10.1109/EHB.2015.7391465
[19] Atya, B.A., Ali, O.T. (2019). Predict the relationship between autism and the use of smart devices by children in the coming years using neural networks. In 2019 First International Conference of Computer and Applied Sciences (CAS), Baghdad, Iraq, pp. 79–83. https://doi.org/10.1109/CAS47993.2019.9075775
[20] Loh, D., Zihajehzadeh, S., Hoskinson, R., Abdollahi, H., Park, E.J. (2016). Pedestrian dead reckoning with smartglasses and smartwatch. IEEE Sensors Journal, 16(22): 8132-8141. https://doi.org/10.1109/JSEN.2016.2606539
[21] Correa, A., Munoz Diaz, E., Bousdar Ahmed, D., Morell, A., Lopez Vicario, J. (2016). Advanced pedestrian positioning system to smartphones and smartwatches. Sensors, 16(11): 1903. https://doi.org/10.3390/s16111903
[22] Kang, T., Shin, Y. (2021). Indoor navigation algorithm based on a smartphone inertial measurement unit and map matching. In 2021 International Conference on Information and Communication Technology Convergence (ICTC), Jeju Island, Korea, pp. 1421-1424. https://doi.org/10.1109/ICTC52510.2021.9621096
[23] An, J., Lee, D.H., Cho, H.H., Jeong, O.H. (2021). Indoor positioning system using smartphone and 360° camera. In 2021 IEEE International Conference on Smart Internet of Things (SmartIoT), Jeju, Korea, pp. 342-343. https://doi.org/10.1109/SmartIoT52359.2021.00062
[24] Bao, H., Wong, W.C. (2014). A novel map-based dead-reckoning algorithm for indoor localization. Journal of Sensor and Actuator Networks, 3(1): 44-63. https://doi.org/10.3390/jsan3010044