Irfan Ahmad Asqolani![]() | Erwin Budi Setiawan*
| Erwin Budi Setiawan*![]()
© 2023 IIETA. This article is published by IIETA and is licensed under the CC BY 4.0 license (http://creativecommons.org/licenses/by/4.0/).
OPEN ACCESS
Twitter, a social media platform that enables users to generate, post, update, and peruse brief messages known as tweets, unfortunately, is frequently misused for circulating negative content encompassing cyberbullying. The detrimental effects of cyberbullying on the mental well-being of victims are profound, with extreme cases culminating in suicide due to severe stress. Consequently, preventive measures, inclusive of the development of a cyberbullying detection system for Twitter, are imperative. This study introduces a hybrid deep learning approach, incorporating feature expansion with Word2Vec and feature extraction with TF-IDF, for constructing a cyberbullying detection system tailored to the Indonesian language on Twitter. A sequence of test scenarios was executed on a system developed using a dataset of 29,085 Indonesian tweets. The outcomes of this study demonstrate that the highest accuracy was achieved by the CNN-LSTM hybrid model with an accuracy of 79.26%, and the LSTM-CNN hybrid model with an accuracy of 79.48%. These findings substantiate that the amalgamation of hybrid models, Word2Vec for feature augmentation, and TF-IDF for feature extraction, yields superior accuracy compared to other deep learning models. Consequently, this study has succeeded in identifying cyberbullying on Twitter, contributing to the development of a healthier social media environment for users.
cyberbullying detection, hybrid deep learning, feature expansion, Word2Vec
Social media has revolutionized the way individuals engage with their social circles, with Twitter emerging as a leading platform enabling the creation, sharing, updating, and consumption of succinct messages known as tweets [1]. With more than 500 million messages exchanged daily among an estimated 1.3 billion users, Twitter has transformed into a global communication hub [2]. The We Are Social report projects that the number of Twitter users in Indonesia will reach 18.45 million by 2022, ranking Indonesia as the fifth-largest nation in terms of Twitter users worldwide [3]. Despite its popularity, Twitter is frequently misused by a subset of its users who disseminate negative, often bullying, content.
Cyberbullying, defined as the use of the internet to harm or intimidate others through hostile messages [4], has a devastating impact on its victims. A survey by UNICEF U-Report involving 2,777 Indonesian adolescents aged between 14-24 years reveals that 45% have experienced cyberbullying [5]. In extreme cases, the resultant psychological distress can lead to suicide [6]. Therefore, the implementation of preventive measures, such as the development of cyberbullying detection systems on social media platforms, is critical.
Several studies have investigated cyberbullying detection, with some leveraging a hybrid approach that combines Convolutional Neural Network (CNN) models with Long-Short Term Memory (LSTM) techniques [7, 8]. This approach has achieved an accuracy of 84%. In Indonesia, research on cyberbullying detection in the Indonesian language has primarily employed the Support Vector Machine (SVM) model, yielding an accuracy of 76% [6, 9, 10]. Other studies have utilized deep learning approaches, including CNN, LSTM, and BiLSTM models, with accuracy levels of 65%, 76%, and 81% respectively [11-13].
This study proposes a hybrid deep learning approach combined with feature expansion using Word2Vec for constructing a cyberbullying detection system for Indonesian tweets. The incorporation of Word2Vec for feature expansion is anticipated to mitigate vocabulary discrepancies in tweets that utilize varied word forms or are abbreviated by Twitter users [14]. The motivation behind this study lies in the consistent achievement of high accuracy levels in the existing literature on cyberbullying detection systems that employ hybrid deep learning on tweet datasets in various languages. Conversely, research on cyberbullying detection with Indonesian language datasets has largely focused on supervised learning and deep learning concepts. This limitation presents an opportunity to successfully apply a hybrid deep learning approach to detect cyberbullying in Indonesian language datasets.
The remainder of this paper is organized as follows: Section 2 reviews relevant literature. Section 3 outlines the proposed methodology for the cyberbullying detection system. Section 4 presents an analysis of the experimental results. Section 5 concludes the study and suggests future work.
The realm of cyberbullying detection has witnessed a plethora of research efforts, many of which have harnessed the power of hybrid deep learning. Rosa et al. [7] employed a tripartite strategy of classification methods-CNN, hybrid CNN-LSTM, and mixed CNN-LSTM-DNN. The data for this study, encompassing 13,160 labeled texts, was derived from the social media platform Formspring. The dataset was trained using three word embeddings: Formspring Word Embeddings, Twitter Word Embeddings, and Google News Word Embeddings. Interestingly, the dataset trained with Twitter Word Embeddings, when then subjected to the CNN-LSTM hybrid method, yielded the highest accuracy value of 84%, outperforming all other methods. The superior performance of Twitter Word Embeddings was attributed to it being trained with a larger sample size than Formspring Word Embeddings and a deeper context than Google Word Embeddings.
Another study by Mohaouchane et al. [8] applied a similar hybrid approach, combining Convolutional Neural Network (CNN) classification models with Long-Short Term Memory (LSTM) techniques. The study worked with a dataset of 15,050 comments sourced from Arabic Youtube comments and utilized word embeddings, AraVec and Word2Vec, to represent words in the dataset as vectors. The CNN-LSTM combination was found to effectively study global features and long-term dependencies, resulting in high accuracy and F1-Scores of 87% and 83%, respectively.
In the Indonesian context, cyberbullying detection has been approached primarily through the lens of supervised learning. Nurrahmi and Nurjanah [9] proposed a supervised learning concept using a dataset of 700 tweets to detect cyberbullying on Twitter. Support Vector Machine (SVM) served as the classification method, and the study achieved an F1-Score of 67%. Similarly, Purnamasari et al. [6] employed the SVM classification method with a feature selection technique using information gain. The dataset, consisting of 300 tweets collected from Twitter, yielded an F1-Score value of 78% and an accuracy of 76%. However, the relatively small size of these datasets [6, 9] poses limitations to the generalizability of their findings to the larger real-world context.
Putri et al. [10] extended the research by using a larger dataset of 10,000 tweets sourced from Twitter. The study implemented several kernels SVM as a classification method and employed N-gram and TF-IDF as feature extraction techniques. The best results were achieved from a combination of SVM RBF kernel and N-gram with n=1, generating an F1-Score of 75% and an accuracy of 76%. These results suggest that the performance of the model improves with a decrease in the number in N-grams.
Deep learning concepts have also been applied to the development of cyberbullying detection systems for Indonesian language datasets. Laxmi et al. [11] implemented Doc2Vec for feature extraction and Convolutional Neural Network (CNN) for classification. The study used a dataset of 1425 tweets and achieved an F1-Score of 65%. However, the model encountered cases of misclassification of data containing slang words and implicit cyberbullying data.
Research by Slamet et al. [12] used a dataset of 1359 tweets sourced from Twitter and employed Long Short-Term Memory (LSTM) for classification and Word2Vec for feature extraction. The study yielded an accuracy score of 79%, indicating the successful use of Word2Vec in measuring the distance between vectors in words, thereby increasing the accuracy score. In a larger study, Anindyati et al. [13] used a dataset of 9854 tweets and experimented with three classification methods-Long Short-Term Memory (LSTM), Bidirectional Long Short-Term Memory (Bi-LSTM), and Convolutional Neural Network (CNN). The authors added feature selection comprising hashtags, masked links, emoticons, and exclamation marks. The F1-Score value of the three classification methods hovered around 75-76%. Despite these promising results, the study's dataset was imbalanced, and the lack of oversampling likely contributed to overfitting.
In light of the above-reviewed literature, the proposed study will employ the CNN and LSTM methods in building hybrid deep learning models. This method has consistently demonstrated high accuracy values for datasets in various languages. It is therefore hypothesized that this approach will also produce high accuracy in detecting cyberbullying within Indonesian language datasets.
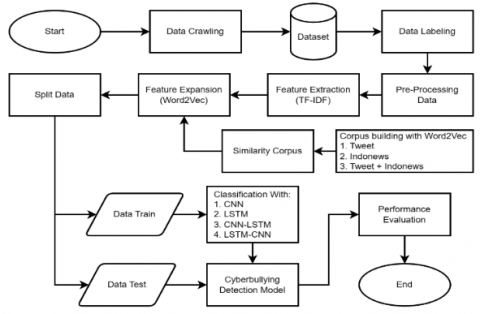
Figure 1 shows the proposed method for creating a cyberbullying detection system on Indonesian-language Twitter using the hybrid model and the Word2Vec feature expansion. The cyberbullying detection system that is being proposed encompasses various stages, including data crawling, data labeling, preprocessing the data, extracting features through TF-IDF, expanding features using Word2Vec, dividing the data into training and test sets, then using four models for data classification, namely CNN, LSTM, CNN-LSTM, and LSTM-CNN. Lastly, the performance of the system will be evaluated.
Figure 1. Cyberbullying detection system
3.1 Data crawling
Data crawling is a systematic approach utilized to gather or extract data from many sources, encompassing blogs, social media platforms, and various websites. In this study, crawling data will originate from Indonesian-language Twitter tweets. Twitter has provided an API that can make data crawling easier, crawling data based on tweets with the possibility of containing one type of cyberbullying, namely flaming or harassment. Flaming refers to sending text messages with strong and blunt language, and harassment refers to disturbing messages via email, text, or social media. The list of keywords used in the data crawling process is shown in Table 1.
Table 1. List of keywords
|
Keyword |
Total |
|
Tolol |
7,125 |
|
Banci |
3,007 |
|
Goblok |
4,844 |
|
Lonte |
4,078 |
|
Gendut |
2,039 |
|
Bodoh |
2,508 |
|
Jelek |
3,756 |
|
Kontol |
1,078 |
|
Bangsat |
650 |
|
Total |
29,085 |
Before entering the classification stage, the data that has been collected will be labeled first. The purpose of labeling is so that data is easy to classify. Labeling is done by giving a label in the form of CB indicating cyberbullying and NCB indicating non-cyberbullying. Table 2 shows an example of the results of data labeling.
Table 3 shows the distribution of the number of cyberbullying and non-cyberbullying classes in the dataset used. The table reveals a balanced distribution of the data utilized in this study, with 14,401 instances classified as cyberbullying and 14,684 classified as non-cyberbullying.
Table 2. Example of labeling
|
Tweet |
Label |
|
@Askrlfess Cewe tolol. Sedih dibikin sendiri. Bege. |
CB |
|
@Hemara_w air dingin bikin tambah gendut, mitos atau fakta? |
NCB |
|
Yang mulia lihat bodoh sekali tuh si dandy. Sering makan kotoran jadi kelakuan kayak gitu. |
CB |
Table 3. Amount of class distribution
|
Keyword |
CB |
NCB |
|
Tolol |
6,280 |
845 |
|
Banci |
2,230 |
777 |
|
Goblok |
481 |
2,027 |
|
Lonte |
232 |
1,807 |
|
Gendut |
2,126 |
2,718 |
|
Bodoh |
530 |
3,226 |
|
Jelek |
1,608 |
2,470 |
|
Kontol |
573 |
505 |
|
Bangsat |
341 |
309 |
|
Total |
14,401 |
14,684 |
The data obtained from the crawling stage is still unstructured raw data and has much noise. Therefore, a series of data pre-processing stages is needed so the data is more structured and ready to be processed at the classification stage. Pre-processing in this study will be carried out through several stages, namely Data Cleaning, Case Folding, Tokenization, Data Normalization, Stopwords Removal, and Stemming. Data Cleaning is cleaning the text data from noise, including symbols, numbers, URLs, and emoticons. Case Folding is changing sentences containing capital letters into lowercase letters to ensure that the same words are not detected as different just because of differences in capital letters. Tokenization is a procedure of separating sentences in text into pieces of tokens or words. Data Normalization is a procedure that standardizes diverse forms of uncommon words into formal words. Stopwords removal refers to eliminating commonly used words that do not carry significant meaning or impact the classification process. Stemming is a procedure of changing the words in each sentence to their basic form, the change is done by removing the affixes for each word in the sentence. Table 4 shows an example of implementing the pre-processing data stages.
Table 4. Example of pre-processing data
|
Pre-processing |
Tweet |
Result |
|
Data Cleaning |
@Askrlfess Cewe tolol. Sedih dibikin sendiri. Bege. |
Cewe tolol Sedih dibikin sendiri Bege |
|
Case Folding |
Cewe tolol Sedih dibikin sendiri Bege |
cewe tolol sedih dibikin sendiri bege |
|
Tokenization |
Cewe tolol Sedih dibikin sendiri Bege |
[cewe, tolol, sedih, dibikin, sendiri, bege] |
|
Data Normalization |
[cewe, tolol, sedih, dibikin, sendiri, bege] |
[cewek, tolol, sedih, dibikin, sendiri, bego] |
|
Stopwords Removal |
[cewek, tolol, sedih, dibikin, sendiri, bego] |
[cewek, tolol, sedih, dibikin, sendiri, bego] |
|
Stemming |
[cewek, tolol, sedih, dibikin, sendiri, bego] |
[cewek, tolol, sedih, bikin, sendiri, bego] |
Feature extraction is the computation of word weights within a text and then converting these words into a digital vector representation. In this study, feature extraction uses the TF-IDF method. Term Frequency-Inverse Document Frequency (TF-IDF) is a procedure to assess the connection between a word (term) and a document by assigning weights [15]. TF-IDF is a merging of two fundamental principles: Term Frequency (TF) and Inverse Document Frequency (IDF). Term Frequency quantifies the frequency of a specific word appearing in a document, whereas Inverse Document Frequency calculates the logarithmic inverse probability of documents that contain that word [16]. The formula for calculating the weight in the TF-IDF method can be formulated as follows:
$W_{m n}=t f_{m n} \times i d f_n$ (1)
$i d f_n=\log \frac{D}{d f_n}$ (2)
$W_{m n}=t f_{m n} \times \log \frac{D}{d f_n}$ (3)
The weight assigned to the m-document for the n-word is denoted by Wmn, while the count of word occurrences within a specific document is denoted by tfmn. idfn is the inverse document frequency. D represents the total count of documents, while df represents the number of documents that contain the specific word (tn). In addition, the TF-IDF can add N-gram parameters, N-gram is a statistical language modeling technique used to examine a text that comprises sequences of items, where "N" indicates the sequence's length [17]. This study uses five types of n-grams: Unigram, Bigram, Trigram, Uni-Bigram, and Uni-Trigram. Unigram represents the one-word token, Bigram represents the two-word token, and Trigram represents the three-word token. Uni-Bigram refers to token representations consisting of one or two words, whereas Uni-Trigram refers to token representations consisting of one to three words. The use of different n-gram variations is designed to enhance the models' grasp of word meanings and connections, eventually leading to the generation of information with higher accuracy. Table 5 shows an example of using the N-gram parameter in TF-IDF for extracting the word "cewek tolol sedih".
Table 5. Example of N-Gram
|
N-Gram |
Tweet |
|
Unigram |
[cewek]. [tolol], [sedih] |
|
Bigram |
[cewek tolol]. [tolol sedih] |
|
Trigram |
[cewek tolol sedih] |
|
Uni-Bigram |
[cewek]. [tolol], [sedih], [cewek tolol], [tolol sedih] |
|
Uni-Trigram |
[cewek]. [tolol], [sedih], [cewek tolol], [tolol sedih], [cewek tolol sedih] |
Feature expansion involves the process of reformulating a word by incorporating additional words that have been previously stored using specific techniques [18]. In this study, the feature expansion technique employed is word embedding, where each word in a text is represented as a dense vector with typically hundreds of dimensions. This representation allows words with similar meanings to be positioned closely together in vector space, while words with different meanings are positioned farther apart [8]. One of the word embedding methods that is currently popular is Word2Vec which was developed by Mikolov et al. [19]. Word2vec represents words into vectors that can carry the word's semantic meaning [20]. In addition, Word2Vec has the advantage of being able to calculate the cosine distance between each word. Therefore, Word2Vec can be used to group vectors of similar words together in a vector space [14]. The choice of Word2Vec in this study was based on these advantages. In the study of Setiawan et al. [14], it was proven that the use of Word2Vec with these advantages succeeded in increasing the accuracy score. Two methods in Word2Vec can be used to represent words, namely Skip-gram and Continuous Bag-Of Word (CBOW). Both of these methods have reverse processes in representing words, the Skip-gram method predicts words that can appear around the selected word by calculating the most similar keywords and the CBOW approach takes the contextual information of each word as input and aims to predict the word that best corresponds to the given context. The procedure carried out in the feature expansion process refers to research [14], namely replacing words that have a weight vector value of 0 at the feature extraction stage with words that have a similar meaning or are semantically related to the word list or the corpus that has been created by Word2Vec. The corpus is created by utilizing data from various sources, including tweets, news articles, and a fusion of tweets and news. Table 6 shows the amount of data used to create a corpus from each source. Table 7 shows the top 10 words that are similar to the word "Bodoh" from corpus similarity which was built using Word2Vec. Words that have vector 0 can be replaced by using words from the rank list in the table.
Table 6. Amount of Word2Vec corpus
|
Keyword |
Total |
|
Tweet |
29,085 |
|
Indonews |
142,523 |
|
Tweet+Indonews |
171,608 |
Table 7. Top 10 similarity of the words “Bodoh”
|
Rank |
Simillar Word |
Value |
|
1. |
Konyol |
0.6676 |
|
2. |
Cuek |
0.6366 |
|
3. |
Cela |
0.6275 |
|
4. |
Takut |
0.6144 |
|
5. |
Kejam |
0.6024 |
|
6. |
Marah |
0.5935 |
|
7. |
Egois |
0.5926 |
|
8. |
Bohong |
0.5881 |
|
9. |
Bully |
0.5881 |
|
10. |
Remeh |
0.5878 |
Data that has previously gone through pre-processing stages and is represented in vector form will be classified using several classification algorithms, including Convolutional Neural Network (CNN), Long Short-Term Memory (LSTM), and Hybrid models. The selection of this classification model is based on research [7, 8] shows that the model's performance excels in testing and achieves a high accuracy score. Convolutional Neural Network (CNN) is a special type of neural network that can work well in processing spatial data [21]. CNN is a deep learning approach that leverages a convolutional layer as a fundamental building block within the constructed neural network [22]. In addition, the convolutional layer is also used to extract local feature vectors [23]. The CNN architecture consists of several layers, including the input, convolutional layer, pooling layer, flattening, fully connected layer, and output.
Long Short-Term Memory (LSTM) is a type of Recurrent Neural Network (RNN) that stands out because of its ability to remember information previously read within a certain period [24]. LSTM effectively stores historical information in long sequences by adding memory cells and three control gates, the addition of both of which can overcome the loss of information history and the loss of gradients caused by RNN training with redundant layers [25].
The LSTM architecture consists of three gates: Forget Gate, Input Gate, and Output Gate. The Forget Gate is responsible for deciding which information will be deleted from memory, and the Input Gate determines which information will be added to memory. The cell state can be updated once these two points are defined. Lastly, Output Gate determines the final output of the network.
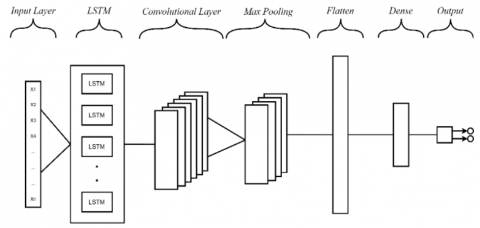
The concept of hybrid deep learning is implemented by merging CNN and LSTM classification models. The system is developed by capitalizing on the unique strengths offered by each model, CNN is good for extracting local features from input and LSTM is good for processing sequential input and studying long-term dependencies [8]. Figure 2 and Figure 3 shows the hybrid model architecture used to detect cyberbullying on Twitter.
Figure 2. Hybrid CNN-LSTM architecture
Figure 3. Hybrid LSTM-CNN architecture
3.7 Performance evaluation
Performance evaluation in this study uses a confusion matrix. A confusion matrix is a statistical tool useful for evaluating a classification model and estimating how well the model can classify different classes [26]. The confusion matrix presents data regarding the classification system's predictions and the actual classification of classes [27]. The classification performance measurement results are described by 4 (four) terms in the confusion matrix, namely True Positive (TP) represents the quantity of positive data that is accurately classified, False Positive (FP) denotes the quantity of positive data that is incorrectly classified, True Negative (TN) represents the number of negative data points that are correctly classified, and False Negative (FN) denotes the quantity of negative data that is erroneously classified [28]. Values are obtained that can measure the performance of the classification model performance namely Accuracy. Accuracy is the ratio of correct data predictions (True Positive and True Negative) to all data and can be calculated by using this formula:
Accuracy $=\frac{(T P+T N)}{(T P+F P+F N+T N)}$ (4)
In this research, a series of test scenarios will be carried out on the four classification models, including CNN, LSTM, Hybrid CNN-LSTM, and Hybrid LSTM-CNN. The parameters used in the CNN baseline model are filter size 32, batch size 64, dropout 0.2, and epochs 5 and in the LSTM baseline model are filter size 64, batch size 64, dropout 0.2, and epochs 5. The reason for using the 5 epochs in the baseline model is because the 5 epochs can provide better performance as shown in Table 8.
Table 8. Result of epoch determination test
|
Epochs |
Accuracy (%) |
|
|
CNN |
LSTM |
|
|
5 |
78.42 |
79.10 |
|
10 |
78.16 |
78.53 |
|
15 |
78.10 |
78.28 |
The first scenario was carried out to determine the best CNN and LSTM baseline models. The second scenario was conducted to determine the combination of N-Gram with TF-IDF that gave the best results on the baseline model. The third scenario tests the CNN and LSTM baseline models combined with the Word2Vec feature expansion. The fourth scenario tests the CNN-LSTM and LSTM-CNN hybrid models combined with the feature expansion Word2Vec.
4.1 Experiment
The first scenario is an experiment to determine the best baseline model using the TF-IDF Unigram feature extraction technique by adding the max-min parameter and the training and test data splitting ratio. The test scenario was carried out by comparing the splitting ratio of training data and testing data and the use of the max-min parameter to the CNN and LSTM models using the TF-IDF Unigram feature extraction. The data splitting ratios used in this study were 90:10, 80:20, and 70:30. This 90:10 data splitting ratio means 90% for training data and 10% for testing data. Table 9 shows the results of the first scenario testing of each model using the max-min parameter and without using the max-min parameter. The best accuracy is achieved with a model that uses the max-min parameter and a data splitting ratio of 90:10, 78.42% for the CNN model and 79.1% for the LSTM model. With these results, the baseline for each model will use TF-IDF Unigram with the max-min parameter and a data splitting ratio of 90:10 which will be applied to the next test scenario.
The second scenario is an experiment using several N-Gram parameters in TF-IDF feature extraction to find the N-Gram value that gave the best results on the baseline model. In this scenario, an experiment was carried out by comparing the accuracy resulting from the use of several N-gram combinations with the baseline model. Some of the N-gram combinations used were Unigram, Bigram, Trigram, Uni-Bigram, and Uni-Trigram. Table 10 shows that the combination of the TF-IDF and Unigram in the baseline model produces the best accuracy value of 78.42% for the CNN model and 79.1% for the LSTM model. With these results testing for the next scenario will use the TF-IDF Unigram for each model.
The third scenario is an experiment by implementing feature expansion on the best baseline model of the previous scenario with a word similarity corpus built using Word2Vec. Tests were carried out using Word2Vec as a feature expansion in determining word similarity in each of the top ranks in the word similarity corpus. We also use some of the top 'N' rankings of the most similar words in the corpus to find optimal similarity measurement results so as to provide the best accuracy value. The corpus used in this test includes the tweet, indonews, and tweet+indonews. While the top ranks used in this test includes Top 1, Top 5, and Top 10, Table 11 shows that for the CNN model best accuracy is achieved by using the indonews corpus rank top 5, and for the LSTM model best accuracy is achieved by using the indonews corpus rank top 5.
The fourth scenario is an experiment by implementing feature expansion on a hybrid model with a corpus of word similarity built using Word2Vec. The hybrid model was built by combining the baseline models, namely CNN and LSTM. The parameters used in the hybrid model are the same as those used in the previous baseline model. Tests were carried out using Word2Vec as a feature expansion in determining word similarity in each of the top ranks in the word similarity corpus. We also use some of the top 'N' rankings of the most similar words in the corpus to find optimal similarity measurement results so as to provide the best accuracy value. The corpus used in this test includes tweet, indonews, and tweet+indonews. While the top ranks used in this test includes Top 1, Top 5, and Top 10. Table 12 shows that for the CNN-LSTM model best accuracy is achieved by using the indonews corpus rank top 5, while for the LSTM-CNN model best accuracy is achieved by using the indonews corpus rank top 1. In addition, a comparison of the accuracy of the baseline model against the hybrid model that has implemented the Word2Vec feature expansion is shown in Table 13.
Table 9. Result of the first scenario test
|
Data Splitting Ratio |
Accuracy (%) |
|||
|
With max-min |
Without max-min |
|||
|
CNN |
LSTM |
CNN |
LSTM |
|
|
90:10 |
78.42 |
79.10 |
78.00 |
78.97 |
|
80:20 |
78.25 |
78.86 |
78.09 |
78.83 |
|
70:30 |
77.71 |
78.82 |
77.60 |
78.69 |
Table 10. Result of comparison N-Gram
|
N-Gram |
Accuracy (%) |
|
|
CNN |
LSTM |
|
|
Unigram (Baseline) |
78.42 |
79.10 |
|
Bigram |
68.27 |
68.88 |
|
Trigram |
55.95 |
56.10 |
|
Uni-Bigram |
77.92 |
78.77 |
|
Uni-Trigram |
78.02 |
78.68 |
Table 11. Result of testing CNN and LSTM using Word2Vec
|
Model |
Rank |
Accuracy (%) |
|||
|
Baseline |
Corpus Tweet |
Corpus Indonews |
Corpus Tweet+Indonews |
||
|
CNN |
Top 1 |
78.42 |
77.13 (-1.64) |
78.77 (+0.45) |
77.89 (-0.68) |
|
Top 5 |
72.44 (-7.63) |
79.00 (+0.74) |
75.29 (-3.99) |
||
|
Top 10 |
68.92 (-12.11) |
78.61 (+0.24) |
76.49 (-2.46) |
||
|
LSTM |
Top 1 |
79.10 |
77.29 (-2.29) |
79.14 (+0.05) |
77.88 (-1.54) |
|
Top 5 |
72.57 (-8.26) |
79.18 (+0.10) |
75.18 (-4.96) |
||
|
Top 10 |
69.40 (-12.26) |
78.72 (-0.48) |
76.76 (-2.96) |
||
Table 12. Result of testing hybrid model using Word2Vec
|
Model |
Rank |
Accuracy (%) |
||
|
Corpus Tweet |
Corpus Indonews |
Corpus Tweet+ Indonews |
||
|
CNN-LSTM |
Top 1 |
77.35 |
79.23 |
78.30 |
|
Top 5 |
72.18 |
79.26 |
75.14 |
|
|
Top 10 |
69.01 |
79.02 |
76.38 |
|
|
LSTM-CNN |
Top 1 |
77.48 |
79.48 |
78.48 |
|
Top 5 |
72.92 |
79.30 |
75.55 |
|
|
Top 10 |
70.32 |
78.92 |
76.89 |
|
Table 13. Comparison of accuracy of hybrid model using Word2Vec with baseline model
|
Model |
Accuracy (%) |
||
|
Baseline |
CNN-LSTM |
LSTM-CNN |
|
|
CNN |
78.42 |
79.26 (+1.07) |
79.48 (+1.35) |
|
LSTM |
79.10 |
79.26 (+0.20) |
79.48 (+0.48) |
4.2 Discussion
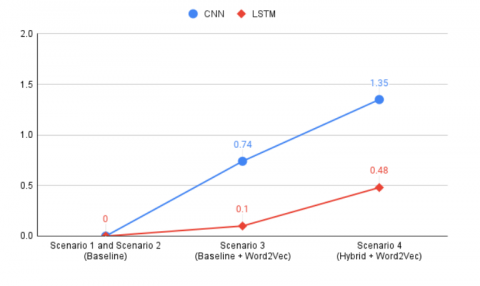
In this research, a series of testing scenarios have been carried out to determine the best baseline model, the optimal combination of N-gram values with TF-IDF in the baseline model, and the best corpus and top rank in implementing feature expansion using Word2Vec. Based on the results of the tests that have been carried out, the best baseline model is obtained in the first scenario by using the TF-IDF Unigram with a splitting data ratio of 90:10 and the addition of the Max-Min parameter with an accuracy value of 78.42% for the CNN model and 79.1% for the LSTM. Then in the second scenario, the N-gram combination that gives the best result accuracy value on the baseline model is TF-IDF with Unigram. In the third scenario, testing is done by applying the Word2Vec feature expansion. On the CNN model, the best accuracy of 79% is obtained by combining the CNN baseline model with the Indonews corpus rank Top 5, and this shows an increase in accuracy of 0.74% from the baseline CNN model and in the LSTM model obtained through a combination of the LSTM baseline model and Indonews corpus ranks Top 5 with an accuracy of 79.18%, this shows an increase in accuracy of 0.10% from the baseline LSTM model. Then in the fourth scenario, we implement the Word2Vec feature expansion on the hybrid model. On the CNN-LSTM hybrid model, the best accuracy of 79.26 was obtained through a combination with the Indonews corpus rank Top 5, this shows an increase in accuracy of 1.07% and 0.20% from the baseline model. Whereas in the LSTM-CNN hybrid model, the best accuracy of 79.48% was obtained through a combination with the Indonews corpus rank Top 1, this shows an accuracy of 1.35% and 0.48% of the baseline models. Figure 4 shows the graph of the increase in accuracy for each scenario for the CNN-LSTM hybrid model and hybrid LSTM-CNN model.
In addition, we also use statistical significance to validate the increase in accuracy between the results of the test scenarios. The concept of P-Value and Z-Value is used to assess the statistical significance of the increase in accuracy between the results of the test scenarios. The accuracy increase between the test scenarios results is significant if the P-Value <0.05 and Z-Value >1.96. As shown in Table 14, the increase in accuracy between the results of testing scenario 1 (baseline model/S1) and scenario 4 (Hybrid model/S4) can be said to be statistically significant.
Table 14. Significant test result between all test scenarios
|
Model |
Parameter |
S1→S2 |
S2→S3 |
S3→S4 |
S1→S4 |
|
CNN |
P-Value |
0.500 |
0.043 |
0.222 |
0.007 |
|
Z-Value |
0 |
1.711 |
0.765 |
2.477 |
|
|
Significant? |
False |
True |
False |
True |
|
|
LSTM |
P-Value |
0.500 |
0.407 |
0.186 |
0.009 |
|
Z-Value |
0 |
0.235 |
0.891 |
3.132 |
|
|
Significant? |
False |
False |
False |
True |
The outcomes of this research show that the use of hybrid deep learning and Word2Vec feature expansion gave the highest accuracy score in this study. These results proves that the use of Word2Vec in reducing vocabulary discrepancies in tweets that use word variations or shortened tweets by Twitter users has been successfully applied. Moreover, these results also prove that combining the advantages of each deep learning model into hybrid deep learning can provide a higher accuracy score compared to the baseline model. However, it comes with certain limitations, precisely its heightened complexity due to the necessity of integrating two deep learning models. The best accuracy obtained from each model after going through the stages of the test scenario can be seen in Table 15.
(a) The CNN-LSTM Hybrid model
(b) The LSTM-CNN Hybrid model
Figure 4. Graph of the increase in accuracy
Table 15. The best accuracy of each model
|
Model |
Accuracy (%) |
|
CNN |
79 |
|
LSTM |
79.18 |
|
CNN-LSTM |
79.26 |
|
LSTM-CNN |
79.48 |
The cyberbullying detection system on Indonesian-language Twitter is presented in this paper. The system was developed using four classification models: CNN, LSTM, hybrid CNN-LSTM, and hybrid LSTM-CNN. The development of this system is used TF-IDF as feature extraction and word embedding Word2Vec is used in making corpus similarity and feature expansion processes. The best accuracy was obtained at 79.26% in the CNN-LSTM hybrid model and 79.48% in the LSTM-CNN hybrid model. These results show that the implementation of hybrid deep learning and the Word2Vec feature expansion have succeeded in solving the challenge of detecting cyberbullying in Indonesian-language datasets. Moreover, these results also show that combining the parameters max-min, TF-IDF Unigram, and using Word2Vec in creating corpus similarities to reduce vocabulary discrepancies in tweets and as feature expansion increases the accuracy value for each model. This is important because we hope that future research related to the detection of cyberbullying in Indonesia can apply the parameters used in this study because it has been proven successful in increasing the accuracy score for each model. Thus, this research has succeeded in creating a hybrid deep learning model that can detect cyberbullying on Twitter so it can be used to cultivate a healthier Twitter social media environment for its users' communities. For further research, we suggest developing a cyberbullying detection system by adding different feature extraction, such as BERT embedding or RoBERTa embedding, and using a metaheuristic algorithm to further optimize the classification model performance.
[1] Saleena, N. (2018). An ensemble classification system for twitter sentiment analysis. Procedia Computer Science, 132: 937-946. https://doi.org/10.1016/j.procs.2018.05.109
[2] AlBadani, B., Shi, R., Dong, J. (2022). A novel machine learning approach for sentiment analysis on Twitter incorporating the universal language model fine-tuning and SVM. Applied System Innovation, 5(1): 13. https://doi.org/10.3390/asi5010013
[3] Rizaty, M.A. (2022). Pengguna twitter di Indonesia Capai 18, 45 Juta pada 2022. Data Indonesia.
[4] Hani, J., Mohamed, N., Ahmed, M., Emad, Z., Amer, E., Ammar, M. (2019). Social media cyberbullying detection using machine learning. International Journal of Advanced Computer Science and Applications, 10(5). https://doi.org/10.14569/IJACSA.2019.0100587
[5] Utami, N.R. (2022). Menko PMK sebut 45 persen anak di RI jadi korban cyber bullying. Detiknews Website, 45: 13-17. https://news. detik. com/berita/d-6039817/menko-pmk-sebut-45-persen-anak-di-ri-jadi-korban-cyber-bullying#:~: text=% 22Diketahui bahwa
[6] Purnamasari, N.M.G.D., Fauzi, M.A., Indriati, L.S.D., Dewi, L.S. (2020). Cyberbullying identification in twitter using support vector machine and information gain based feature selection. Indonesian Journal of Electrical Engineering and Computer Science, 18(3): 1494-1500. https://doi.org/10.11591/ijeecs.v18.i3.pp1494-1500
[7] Rosa, H., Matos, D., Ribeiro, R., Coheur, L., Carvalho, J.P. (2018). A “deeper” look at detecting cyberbullying in social networks. In 2018 International Joint Conference On Neural Networks (IJCNN). IEEE, pp. 1-8. https://doi.org/10.1109/IJCNN.2018.8489211
[8] Mohaouchane, H., Mourhir, A., Nikolov, N.S. (2019). Detecting offensive language on arabic social media using deep learning. In 2019 Sixth International Conference On Social Networks Analysis, Management And Security (SNAMS). IEEE, pp. 466-471. https://doi.org/10.1109/SNAMS.2019.8931839
[9] Nurrahmi, H., Nurjanah, D. (2018). Indonesian twitter cyberbullying detection using text classification and user credibility. In 2018 International Conference on Information and Communications Technology (ICOIACT). IEEE, pp. 543-548. https://doi.org/10.1109/ICOIACT.2018.8350758
[10] Putri, N.L.P.M.S., Nurjanah, D., Nurrahmi, H. (2022). Cyberbullying detection on twitter using support vector machine classification method. Building of Informatics, Technology and Science (BITS), 3(4): 661-666. https://doi.org/10.47065/bits.v3i4.1435
[11] Laxmi, S.T., Rismala, R., Nurrahmi, H. (2021). Cyberbullying detection on Indonesian twitter using doc2vec and convolutional neural network. In 2021 9th International Conference on Information and Communication Technology (ICoICT). IEEE, pp. 82-86. https://doi.org/10.1109/ICoICT52021.2021.9527420
[12] Slamet, C., Krismunandar, A., Maylawati, D.S.A., Amin, A.S., Ramdhani, M.A. (2020). Deep learning approach for bullying classification on twitter social media with indonesian language. In 2020 6th International Conference on Wireless and Telematics (ICWT). IEEE, pp. 1-5. https://doi.org/10.1109/ICWT50448.2020.9243653
[13] Anindyati, L., Purwarianti, A., Nursanti, A. (2019). Optimizing deep learning for detection cyberbullying text in indonesian language. In 2019 International Conference of Advanced Informatics: Concepts, Theory and Applications (ICAICTA). IEEE, pp. 1-5. https://doi.org/10.1109/ICAICTA.2019.8904108
[14] Setiawan, E.B., Widyantoro, D.H., Surendro, K. (2016). Feature expansion using word embedding for tweet topic classification. In 2016 10th International Conference on Telecommunication Systems Services and Applications (TSSA). IEEE, pp. 1-5. https://doi.org/10.1109/TSSA.2016.7871085
[15] Nurjannah, M., Hamdani, H., Astuti, I.F. (2016). Penerapan algoritma term frequency-inverse document frequency (tf-idf) untuk text mining. Informatika Mulawarman: Jurnal Ilmiah Ilmu Komputer, 8(3): 110-113. https://doi.org/10.30872/JIM.V8I3.113
[16] Hakim, A.A., Erwin, A., Eng, K.I., Galinium, M., Muliady, W. (2014). Automated document classification for news article in Bahasa Indonesia based on term frequency inverse document frequency (TF-IDF) approach. In 2014 6th International Conference on Information Technology and Electrical Engineering (ICITEE). IEEE, pp. 1-4. https://doi.org/10.1109/ICITEED.2014.7007894
[17] Unsvåg, E.F., Gambäck, B. (2018). The effects of user features on Twitter hate speech detection. In Proceedings of the 2nd Workshop on Abusive Language Online (ALW2), pp. 75-85. http://dx.doi.org/10.18653/v1/W18-5110
[18] Royyan, A.R., Setiawan, E.B. (2022). Feature expansion word2vec for sentiment analysis of public policy in Twitter. Jurnal RESTI (Rekayasa Sistem dan Teknologi Informasi), 6(1): 78-84. https://doi.org/10.29207/resti.v6i1.3525
[19] Mikolov, T., Chen, K., Corrado, G., Dean, J. (2013). Efficient estimation of word representations in vector space. arXiv Preprint arXiv: 1301.3781. https://doi.org/10.48550/arXiv.1301.3781
[20] Nurdin, A., Aji, B.A.S., Bustamin, A., Abidin, Z. (2020). Perbandingan kinerja word embedding word2vec, glove, dan fasttext pada klasifikasi teks. Jurnal Tekno Kompak, 14(2): 74-79. https://doi.org/10.33365/jtk.v14i2.732
[21] Yenter, A., Verma, A. (2017). Deep CNN-LSTM with combined kernels from multiple branches for IMDb review sentiment analysis. In 2017 IEEE 8th Annual Ubiquitous Computing, Electronics and Mobile Communication Conference (UEMCON). IEEE, pp. 540-546. https://doi.org/10.1109/UEMCON.2017.8249013
[22] Widhiyasana, Y., Semiawan, T., Mudzakir, I.G.A., Noor, M.R. (2021). Penerapan convolutional long short-term memory untuk klasifikasi teks berita bahasa Indonesia. Jurnal Nasional Teknik Elektro dan Teknologi Informasi, 10(4).
[23] Yue, W., Li, L. (2020). Sentiment analysis using Word2vec-CNN-BiLSTM classification. In 2020 Seventh International Conference on Social Networks Analysis, Management and Security (SNAMS). IEEE, pp. 1-5. https://doi.org/10.1109/SNAMS52053.2020.9336549
[24] Luan, Y., Lin, S. (2019). Research on text classification based on CNN and LSTM. In 2019 IEEE International Conference on Artificial Intelligence and Computer Applications (ICAICA). IEEE, pp. 352-355. https://doi.org/10.1109/ICAICA.2019.8873454
[25] Zhang, J., Li, Y., Tian, J., Li, T. (2018). LSTM-CNN hybrid model for text classification. In 2018 IEEE 3rd Advanced Information Technology, Electronic and Automation Control Conference (IAEAC), pp. 1675-1680. https://doi.org/10.1109/IAEAC.2018.8577620
[26] Saputri, S.D., Ermatita, E. (2019). Credit scoring kelayakan debitur menggunakan metode hybrid ANN backpropagation dan TOPSIS. Jurnal RESTI (Rekayasa Sistem Dan Teknologi Informasi), 3(1): 73-78. https://doi.org/10.29207/resti.v3i1.847
[27] Deng, X., Liu, Q., Deng, Y., Mahadevan, S. (2016). An improved method to construct basic probability assignment based on the confusion matrix for classification problem. Information Sciences, 340: 250-261. https://doi.org/10.1016/j.ins.2016.01.033
[28] Rahmad, F., Suryanto, Y., Ramli, K. (2020). Performance comparison of anti-spam technology using confusion matrix classification. In IOP Conference Series: Materials Science and Engineering, 879(1): 012076. https://doi.org/10.1088/1757-899X/879/1/012076