Chayma Farchi*![]() | Fadwa Farchi
| Fadwa Farchi![]() | Badr Touzi | Ahmed Mousrij
| Badr Touzi | Ahmed Mousrij![]()
© 2023 IIETA. This article is published by IIETA and is licensed under the CC BY 4.0 license (http://creativecommons.org/licenses/by/4.0/).
OPEN ACCESS
The objective of this paper is to present a new multidimensional performance measurement model calculating the overall sustainable performance value applied to the road freight transport sector. The measurement system presented considers five main dimensions including economic, social, environmental, operational and stakeholder. This paper justifies the choice of these dimensions and details the calculation approach through the presentation of the different minimum conditions algorithms leading to the final global performance value. The model is then generalized here by means of the artificial neural network (ANN) which is found to be the most relevant modeling technique used in a variety of scientific domains. In this study, ANN is used to predict the value of the global multidimensional performance in road freight transport estimated following the machine learning of the program on a labeled database. The data on which the program trained emerged from our multidimensional performance measurement model. A model mainly designed for the sole purpose of quantifying the sustainable performance of a supply chain. To this end, we have identified five main dimensions recurrently cited in the literature, namely: economic, environmental, social, operational, and stakeholders. The dimensions' respective performances are obtained by employing a minimum condition algorithm, which returns the global multidimensional performance. The suggested model is general and may be applied to different disciplines.
ANN, machine learning, sustainable performance, performance assessment
The increasing importance of sustainability has been driven by economic, environmental, and social issues exacerbated by the global economic crisis, pursuit of a better quality of life, effects of global warming, and constraints of natural resources [1, 2]. As a result, sustainability has become a crucial consideration in all aspects of industrial and corporate activities, including manufacturing, maintenance, marketing, purchasing, sales, and logistics. The focus on sustainability in logistics has been accelerated by the impact of large-scale product movements worldwide [3, 4].
Transport activities play a significant role in sustainable development by providing access to resources and markets and improving people's quality of life through employment, health, education, leisure, and other activities. However, these activities have negative impacts, such as rising product costs, air and water pollution, consumption of limited resources, and traffic accidents [5].
To enhance the sustainability of transport systems, particularly in road freight, it is crucial to use indicators to evaluate sustainable performance from economic, environmental, and social standpoints [6, 7]. Sustainable transport is defined as a transportation capacity that facilitates the mobility of people and goods in a manner that fosters the social and economic development of current and future generations while reducing negative environmental impacts [8].
This article proposes a new model for evaluating sustainable performance in road freight transport, building upon the work presented in IRASET’22 [9]. The model utilizes an artificial neural network (ANN), a modeling technique commonly used in various scientific fields. The model encompasses five key dimensions, including environmental, economic, social, operational, and stakeholders.
This article is organized as follows: Section 2 presents the identification of dimensions and fields that make up the sustainable performance assessment model. Section 3 outlines the algorithm used to quantify sustainability with minimal conditions. Section 4 explains the methodology used to generalize the model through the ANN. Finally, the paper concludes with a discussion of the implications and limitations of the proposed model. Cited references are included throughout the article.
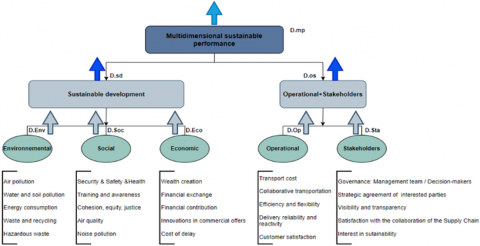
Before creating our sustainable performance measurement model, we conducted a thorough review of existing literature. As stated in our original paper [9], we categorized the models that evaluate sustainable performance in the field of transport. These models take into account different dimensions in their assessment. Out of the 17 models we analyzed [9], we compared them based on their applicability in other contexts to identify the most robust model [10]. We chose this model as a starting point since it considers the four most significant dimensions related to sustainability in its evaluation [10]. We further enhanced the model by expanding it from 4 dimensions (economic, social, environmental, operational) and 16 fields to 5 dimensions and 25 fields, as depicted in Figure 1. The Table 1 and Table 2 below summarize the main findings and highlight the dimensions that each model considers.
Figure 1. Multidimensional sustainability performance measurement model
Table 1. Sustainable performance assessment models comparison
|
Articles |
Dimensions |
|
[11] |
Economic and environmental factors, efficiency factors, use of advanced technologies, safety factors, and social factors |
|
[12] |
Legislation & Citizenship, Financial, Stakeholders, Processes, Innovation & Growth |
|
[13] |
Policy making (TBL)+Service Quality+satisfaction+corporate reputation+pollution levels+Budget+Airport social responsibility |
|
[14] |
TBL |
|
[15] |
TBL+Efficiency of transportation systems |
|
[16] |
TBL |
|
[17] |
Economic sustainability, social sustainability, environmental sustainability, and efficiency of the transport system |
|
[18] |
TBL |
|
[19] |
Network performance, road safety, environmental impact, and physical activity |
|
[20] |
TBL |
|
[21] |
Efficiency |
|
[22] |
TBL |
|
[23] |
Financial, social, environmental perspectives, internal business perspective, learning, and development perspective |
|
[24] |
TBL |
|
[25] |
TBL |
|
[26] |
TBL |
|
[10] |
TBL+Operational |
It is crucial to acknowledge and integrate the needs and concerns of stakeholders who have a direct interest in a company's development strategies and plans [27]. This is because such stakeholders are directly impacted by the efforts made towards sustainable development. Hence, we recognized it as important to include them as an integral dimension in the model we are developing. We have identified five dimensions that are essential in our model, namely economic (ECO), environmental (ENV), social (SOC), operational (OP), and stakeholders (STA).
Table 2. Dimensions and fields identification
|
Level 1 |
Level 2 |
Level 3 |
|
|
Global Sustainable Performance |
Dimension |
Codes |
Fields |
|
Environmental |
ENV1 |
Air pollution |
|
|
ENV2 |
Water and soil pollution |
||
|
ENV3 |
Energy consumption |
||
|
ENV4 |
Waste and recycling |
||
|
ENV5 |
Hazardous waste |
||
|
Social |
SOC1 |
Security & Safety &Health |
|
|
SOC2 |
Training and awareness, regional involvement, and territorial |
||
|
SOC3 |
Cohesion, equity, justice |
||
|
SOC4 |
Air quality |
||
|
SOC5 |
Noise pollution |
||
|
Economic |
ECO1 |
Wealth creation |
|
|
ECO2 |
Financial exchange with external stakeholders |
||
|
ECO3 |
Financial contribution in its environment |
||
|
ECO4 |
Innovations in commercial offers |
||
|
ECO5 |
Cost of delay |
||
|
Operational |
OP1 |
Transport cost |
|
|
OP2 |
Collaborative transportation |
||
|
OP3 |
Efficiency and flexibility |
||
|
OP4 |
Delivery reliability and reactivity |
||
|
OP5 |
Customer satisfaction |
||
|
Stakeholders |
STA1 |
Governance: Management team / Decision-makers |
|
|
STA2 |
Visibility and transparency of the Supply Chain |
||
|
STA3 |
Strategic agreement of stakeholders and interested parties |
||
|
STA4 |
Satisfaction with the collaboration of the Supply Chain |
||
|
STA5 |
Interest in sustainability |
||
Typically, stakeholders can be divided into two groups: "Contractual" stakeholders, who are directly involved with the company through contracts (e.g., customers, suppliers, employees, shareholders), and "diffuse" stakeholders, who are indirectly affected by the actions of the company (e.g., local authorities, public bodies, non-governmental organizations) [28]. Both groups of stakeholders are important to consider when evaluating a company's sustainability performance, as including all stakeholders can increase transparency and collaboration. It is essential to satisfy all stakeholders in order to measure a company's performance effectively [29-31]. Different stakeholders have different views on sustainability, with some arguing that it involves meeting the needs of all stakeholders both now and in the future (Leader of the Area of Social Corporate Responsibility-CHEM) while others believe that it involves being responsible and working together as a collective (Engineer of the Management Systems Directorate-ENG).
In order to measure and evaluate the relative sustainability of internal and external stakeholders, we propose, through this article, 4 fields of evaluation covering different points of common interest of the stakeholders. An added dimension to the model they have chosen as the basis for the development of a new evaluation model, namely the "Multidimensional Sustainability Performance Measurement Model for Road Freight Transport". In addition to this and to further improve the application of this framework, some fields have been eliminated while others have been added to develop a new more efficient model. The fields have been defined on the basis of a large number of documentary resources and judgments of industrial experts.
We considered the Air factor as a dual influence affecting both the environmental aspect through Air Pollution and the social aspect through Air Quality.
In view of the extent of its direct consequences for humans, we consider that the area of ‘noise pollution’, defined as untimely or excessive sound that can have harmful and deleterious effects on humans and human health, fully deserves its place in the social dimension.
The cost of delay has also been included as a field in the economic dimension. It is a means of communicating the impact of time on expected outcomes and is of great importance because it combines urgency and value and generates both indirect and direct impacts.
In what follows the following abbreviations will be used:
•D.mp: Multidimensional performance;
•D.sd: Sustainable development performance;
•D.os: Operational & Stakeholders' performance;
•D.env: Environmental performance;
•D.soc: Social performance;
•D.eco: Economic performance;
•D.op: Operational performance;
•D.sta: Performance relative to stakeholders.
The scheme explained in Figure 1 serves to structure the sustainable performance measurement model. The evaluation is only possible if the values of the different fields are implemented. Once these fields are filled in, the performances (D.sd, D.os), and the multidimensional sustainable performance D.mp, are calculated. Performance evaluation goes upwards starting from fields to multidimensional sustainable performance. The measurements are made through the algorithms explained below.
The model is comprised of five fields per dimension in its lower level, and the performance of each dimension is determined by the values of these fields and their respective calculation algorithms. The dimensions are then divided into two main categories: sustainable performance related to sustainable development (D.sd), which includes the environmental, social, and economic dimensions, and a second category (D.os) which combines the operational and stakeholder dimensions.
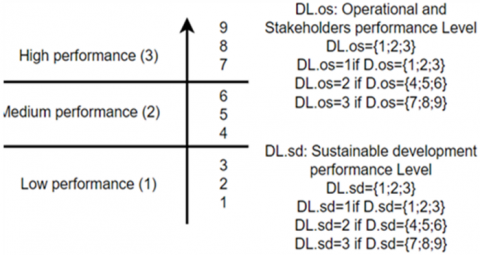
Figure 2. Multidimensional performance measurement scale
The scale used to rate dimensions’ ranges from 1 to 9, as illustrated in Figure 2. The overall performance score is determined by the lowest performing dimension, even if all other dimensions have excellent performance. Note that the values of the fields considered within each dimension range from 1 to 5. This scale was chosen based on the three-level classification of sustainable performance applied to road freight transport [10]: Low performance, medium performance, and high performance. Each performance level is further broken down into three sub-levels to allow for a comprehensive assessment of sustainable performance.
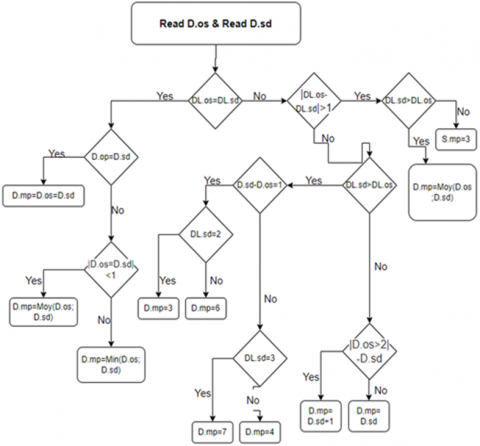
3.1 Multidimensional performance algorithm
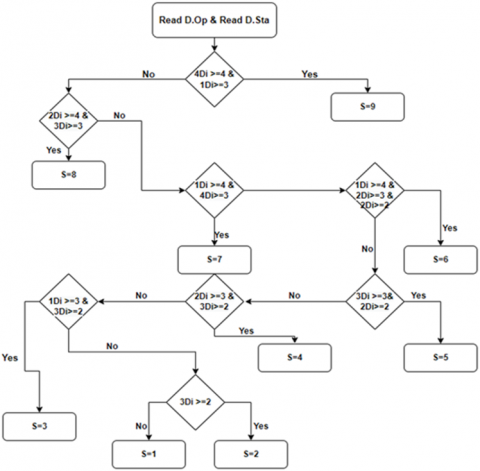
The multidimensional performance determination algorithm is based on the idea of a minimum condition necessary for assigning a performance level. The overall performance level is then reduced to the level of the lower value attributed to the adjacent components as shown in Figure 3. In other words, obtaining a low level of D.Os performance in addition to a high level of D.sd performance will not allow high multidimensional performance D.mp, the opposite being true as well.
With D.mp={1,2,…9}; D.Op={1,2,…9}; D.sd={1,2,…9}
Figure 3. Multidimensional performance algorithm
3.2 Dimensional performance algorithm
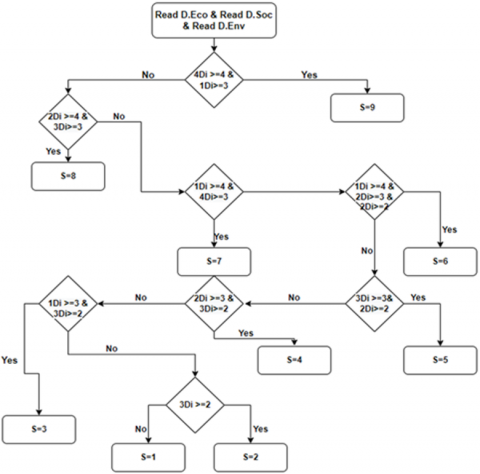
3.2.1 Sustainable development performance
The performance of sustainable development is obtained through the economic, social, and environmental dimensions of the Triple Bottom Line (Figure 4), retaining the lowest values among the others present.
D.sd=min(D.Eco,D.Soc,D.Env)
With D.Eco={1,2,…9};D.Soc={1,2,…9};D.Env={1,2,…9}
Figure 4. Sustainable development performance
3.2.2 Operational and stakeholders’ performance
We obtain the D.os performance by applying the same multidimensional performance determination algorithm (Figure 5). Access to a given performance level assumes that all the values of the dimension fields (D.Op, D.Sta) belong to it.
D.op=min(D.Op,D.Sta)
With D.Op={1,2,…9};D.Sta={1,2,…9}
Figure 5. Operational and stakeholders’ performance algorithm
3.3 Model validation
The ultimate purpose of this paragraph is to validate the reliability of the model. The approach begins by determining a number of scenarios representing different fictitious cases. In our case, we have drawn up Table 1 expanding the study set to seven scenarios, randomly generated and modified by the working group for the sole purpose of having representation of multiple situations. The results are recorded in Table 2.
The generation was done in a random way by proposing a set of fictitious scenarios: first, scores were arbitrarily assigned to the different fields. Then the algorithms were applied to calculate the performance of the different levels and to arrive at the multidimensional sustainable performance value.
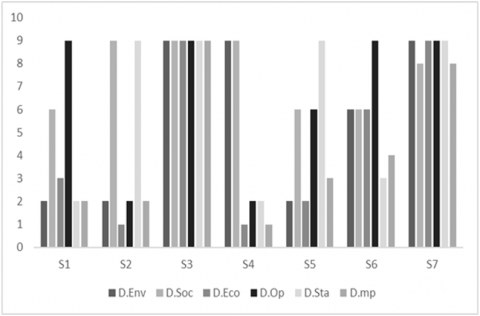
The represented scenarios detailed in Table 3 and Table 4 and illustrated in Figure 6, demonstrate that a high level of multidimensional sustainable performance is attainable only when all dimensions are of a high level of performance. Access to a given performance level assumes that the performance of all dimensions belongs at least to that level.
Although the organization has a high level of performance in one or two dimensions, it has to make more effort to improve the performance of the other dimensions.
Table 3. Set of scenarios
|
Dimensions |
Code |
Scenarios |
||||||
|
S1 |
S2 |
S3 |
S4 |
S5 |
S6 |
S7 |
||
|
Environmental |
1 |
1 |
2 |
5 |
4 |
1 |
2 |
4 |
|
2 |
3 |
1 |
5 |
4 |
2 |
3 |
4 |
|
|
3 |
1 |
3 |
5 |
5 |
3 |
2 |
5 |
|
|
4 |
5 |
1 |
3 |
4 |
1 |
3 |
5 |
|
|
5 |
2 |
3 |
5 |
5 |
2 |
4 |
5 |
|
|
Social |
6 |
4 |
4 |
4 |
5 |
4 |
5 |
3 |
|
7 |
3 |
4 |
4 |
4 |
3 |
2 |
4 |
|
|
8 |
2 |
5 |
5 |
4 |
4 |
5 |
4 |
|
|
9 |
3 |
4 |
4 |
5 |
2 |
3 |
4 |
|
|
10 |
2 |
5 |
5 |
5 |
5 |
4 |
2 |
|
|
Economic |
11 |
2 |
2 |
5 |
2 |
2 |
2 |
5 |
|
12 |
1 |
1 |
5 |
1 |
1 |
4 |
5 |
|
|
13 |
2 |
2 |
4 |
2 |
2 |
5 |
5 |
|
|
14 |
3 |
1 |
5 |
1 |
3 |
4 |
3 |
|
|
15 |
4 |
1 |
5 |
1 |
2 |
4 |
5 |
|
|
Operational |
16 |
5 |
1 |
5 |
1 |
4 |
5 |
5 |
|
17 |
4 |
2 |
4 |
2 |
3 |
4 |
5 |
|
|
18 |
4 |
3 |
4 |
3 |
2 |
4 |
4 |
|
|
19 |
5 |
1 |
5 |
1 |
5 |
5 |
5 |
|
|
20 |
5 |
2 |
5 |
2 |
3 |
5 |
4 |
|
|
Stakeholders |
21 |
2 |
5 |
4 |
2 |
5 |
2 |
4 |
|
22 |
1 |
4 |
5 |
1 |
5 |
1 |
5 |
|
|
23 |
2 |
4 |
5 |
3 |
5 |
3 |
5 |
|
|
24 |
1 |
5 |
4 |
1 |
3 |
1 |
5 |
|
|
25 |
1 |
5 |
5 |
3 |
4 |
3 |
4 |
|
Table 4. Results
|
|
S1 |
S2 |
S3 |
S4 |
S5 |
S6 |
S7 |
|
D.Env |
2 |
2 |
9 |
9 |
2 |
6 |
9 |
|
D.Soc |
6 |
9 |
9 |
9 |
6 |
6 |
8 |
|
D.Eco |
3 |
1 |
9 |
1 |
2 |
6 |
9 |
|
D.sd |
2 |
2 |
9 |
1 |
2 |
6 |
9 |
|
D.Op |
9 |
2 |
9 |
2 |
6 |
9 |
9 |
|
D.Sta |
2 |
9 |
9 |
2 |
9 |
3 |
9 |
|
D.os |
2 |
2 |
9 |
2 |
6 |
3 |
9 |
|
D.mp |
2 |
2 |
9 |
1 |
3 |
4 |
8 |
Figure 6. Graphical representation of scenarios
The purpose of using a neural network is to generalize the model and evaluate its performance and accuracy of calculation. In the future, a scientific paper will be published to elaborate on the supervised machine learning model and its implementation with real-time data. The current article briefly presents the design and identifies the next phase of research. To test the consistency of our performance measurement system and enhance its capabilities, we generated 200 different scenarios using a new machine learning model based on a multilayer perceptron with backpropagation. Artificial Neural Network (ANN) modeling was chosen as it can handle data with high volatility more accurately. ANN is an innovative and beneficial model for problem-solving and machine learning, functioning similarly to the nervous system of the human brain, and overcoming the limitations of classic forecasting methods. Setting up a multilayer Perceptron to solve a problem requires determining the optimal weights applied to each inter-neuronal connection, which is done using a feed-forward propagation algorithm.
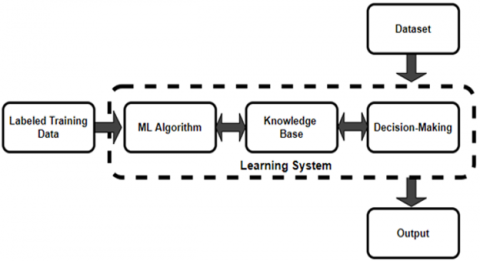
Figure 7. General layout of ML system
Figure 7 above demonstrates a general layout of the ML system. As input to the ML system, labeled or unlabeled training data is obtained from many sources. The learning system's knowledge base determines the usage of an appropriate ML method, taking into account the decisions to be made by the ML predictions produced from the present datasets for quality output, hence increasing the organization's decision-making performance [32].
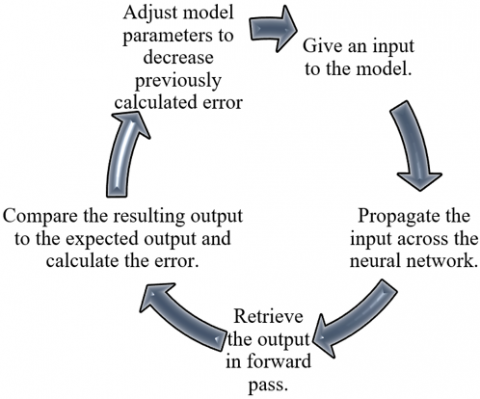
The general approach of this ML is structured as shown in Figure 8.
Figure 8. Followed approach during learning
Note that the model parameters are adjusted by gradient descent during backward propagation. In what follows, we will detail the algorithms used during this machine learning.
Training a multilayer perceptron is a process of determining the values for the various weights in order to properly resolve the connection that the network is modeling [33]. At this stage, we will look at a basic multilayer perceptron with only five weights. The network error for a particular pattern may be determined for any weight combination. The goal of training is to determine the weighting combination that produces the minimum error.
To locate the maximum or minimum point of a given function, one technique is to use gradient descent or steepest descent method, which utilizes the steepest gradients. The optimum point obtained may either be local or global [34]. The backpropagation training algorithm employs this method to look for the global minimum of the error surface. Among the different methods used for training multilayer perceptrons, backpropagation is the easiest to compute.
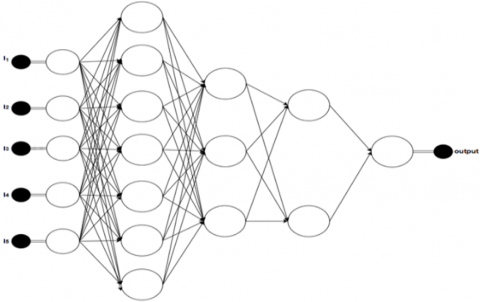
Multilayer perceptron is a widely used model for prediction, function approximation, and model classification tasks [33]. This study focuses on prediction, specifically forecasting future trends based on learning values. The neural network used in this study has five inputs in the input layer, three hidden layers, and a single output layer, as illustrated in Figure 9.
Figure 9. Structure of the neural network
The network's weights are first set to modest random values. This is equivalent to picking a random location on the error surface. The backpropagation method then computes the error surface's local gradient and adjusts the weights in the direction of the steepest local gradient. Given a fairly smooth error surface, it is hoped that the weights would converge to the error surface's global minimum.
The aim of finding a minimal error reinforces the accuracy of the model: The smaller the error, the better the performance of the model. When the performance of the model is high, the prediction is made in the best condition and the difference between the actual value and the predicted value obtained is minimal (or even zero).
The following Table 5 shows the prediction performance. The results are promising and show a very high accuracy validating the generalization of the multidimensional performance measurement system model presented in this paper.
Table 5. Prediction performances
|
Settings |
Values Test 1 |
Values Test 2 |
Values Test 3 |
Values Test 4 |
|
n-fold |
3 |
5 |
6 |
5 |
|
Mean Accuracy |
61.79% |
78.43% |
85.46% |
94.17% |
To effectively manage a supply chain, analyzing data is crucial for monitoring and reporting on its performance. As transportation is a vital process in logistics, it is important to quantify its components and track progress towards objectives. Field assessments can provide insights into current conditions and help measure performance over time. However, relying on a single metric is not enough to provide an accurate assessment.
Therefore, this study proposes a model that maps various fields onto five dimensions to better evaluate sustainable performance. The model includes both a sustainable performance assessment and prediction component that can be applied to various fields of study. It should be noted that the scenarios used to validate the model were created based on fictitious situations and are not exhaustive. Future research should involve implementing the model in practice to confirm its theoretical consistency. The dimensions and indicators used in the model can be modified to fit specific applications and accommodate as many indicators as necessary.
[1] Dey, A., LaGuardia, P., Srinivasan, M. (2011). Building sustainability in logistics operations: A research agenda. Management Research Review, 34(11): 1237-1259. https://doi.org/10.1108/01409171111178774
[2] Pålsson, H., Johansson, O. (2016). Reducing transportation emissions: company intentions, barriers and discriminating factors. Benchmarking: An International, 23(3): 674-703. https://doi.org/10.1108/BIJ-03-2014-0025
[3] Bretzke, W.R. (2011). Sustainable logistics: in search of solutions for a challenging new problem. Logistics Research, 3(4): 179-189. https://doi.org/10.1007/s12159-011-0059-4
[4] Dekker, R., Bloemhof, J., Mallidis, I. (2012). Operations research for green logistics-an overview of aspects, issues, contributions and challenges. European Journal of Operational Research, 219(3): 671-679. https://doi.org/10.1016/j.ejor.2011.11.010
[5] Litman, T., Burwell, D. (2006). Issues in sustainable transportation. International Journal of Global Environmental Issues, 6(4): 331-347. https://doi.org/10.1504/IJGENVI.2006.010889
[6] Dobranskyte-Niskota, A., Perujo, A., Jesinghaus, J., Jensen, P. (2007). Indicators to assess sustainability of transport activities. European Commission, Joint Research Centre, 1-88. https://doi.org/10.2788/46618
[7] Cottrill, C.D., Derrible, S. (2015). Leveraging big data for the development of transport sustainability indicators. Journal of Urban Technology, 22(1): 45-64. https://doi.org/10.1080/10630732.2014.942094
[8] Ki-Moon, B. (2016). Mobilizing Sustainable Transport for Development. United Nation Official Publication: New York, NY, USA.
[9] Chayma, F., Badr, T., Fadwa, F., Ahmed, M. (2022). Development of a conceptual model of multidimensional measurement of sustainable performance for road freight transport. In 2022 2nd International Conference on Innovative Research in Applied Science, Engineering and Technology (IRASET), IEEE, 1-8. https://doi.org/10.1109/IRASET52964.2022.9738425
[10] Touzi, B., Mabrouki, C., Farchi, A. (2015). Development of a multidimensional sustainability performance measurement model for road freight transport. International Journal of Current Research, 7(12): 24526-24534.
[11] Pathak, D.K., Shankar, R., Choudhary, A. (2021). Performance assessment framework based on competitive priorities for sustainable freight transportation systems. Transportation Research Part D: Transport and Environment, 90: 102663. https://doi.org/10.1016/j.trd.2020.102663
[12] Butzer, S., Schötz, S., Petroschke, M., Steinhilper, R. (2017). Development of a performance measurement system for international reverse supply chains. Procedia Cirp, 61: 251-256. https://doi.org/10.1016/j.procir.2016.11.264
[13] Olfat, L., Amiri, M., Soufi, J.B., Pishdar, M. (2016). A dynamic network efficiency measurement of airports performance considering sustainable development concept: A fuzzy dynamic network-DEA approach. Journal of Air Transport Management, 57: 272-290. https://doi.org/10.1016/j.jairtraman.2016.08.007
[14] Awasthi, A., Chauhan, S.S., Omrani, H. (2011). Application of fuzzy TOPSIS in evaluating sustainable transportation systems. Expert Systems with Applications, 38(10): 12270-12280. https://doi.org/10.1016/j.eswa.2011.04.005
[15] Zhao, Y., Triantis, K., Murray-Tuite, P., Edara, P. (2011). Performance measurement of a transportation network with a downtown space reservation system: A network-DEA approach. Transportation Research Part E: Logistics and Transportation Review, 47(6): 1140-1159. https://doi.org/10.1016/j.tre.2011.02.008
[16] To, W.M., Lee, P.K.C., Billy, T.W. (2020). Sustainability assessment of an urban rail system-The case of Hong Kong. Journal of Cleaner Production, 253: 119961. https://doi.org/10.1016/j.jclepro.2020.119961
[17] Rajak, S., Parthiban, P., Dhanalakshmi, R. (2016). Sustainable transportation systems performance evaluation using fuzzy logic. Ecological Indicators, 71: 503-513. https://doi.org/10.1016/j.ecolind.2016.07.031
[18] Zope, R., Vasudevan, N., Arkatkar, S.S., Joshi, G. (2019). Benchmarking: a tool for evaluation and monitoring sustainability of urban transport system in metropolitan cities of India. Sustainable Cities and Society, 45: 48-58. https://doi.org/10.1016/j.scs.2018.11.011
[19] Feizi, A., Joo, S., Kwigizile, V., Oh, J.S. (2020). A pervasive framework toward sustainability and smart-growth: assessing multifaceted transportation performance measures for smart cities. Journal of Transport & Health, 19: 100956. https://doi.org/10.1016/j.jth.2020.100956
[20] Kumar, A., Anbanandam, R. (2022). Assessment of environmental and social sustainability performance of the freight transportation industry: An index-based approach. Transport Policy, 124: 43-60. https://doi.org/10.1016/j.tranpol.2020.01.006
[21] Wang, Z.W., Song, W.K. (2020). Sustainable airport development with performance evaluation forecasts: A case study of 12 Asian airports. Journal of Air Transport Management, 89: 101925. https://doi.org/10.1016/j.jairtraman.2020.101925
[22] Rao, S.H. (2021). Transportation synthetic sustainability indices: A case of Taiwan intercity railway transport. Ecological Indicators, 127: 107753. https://doi.org/10.1016/j.ecolind.2021.107753
[23] Lu, M.T., Hsu, C.C., Liou, J.J.H., Lo, H.W. (2018). A hybrid MCDM and sustainability-balanced scorecard model to establish sustainable performance evaluation for international airports. Journal of Air Transport Management, 71: 9-19. https://doi.org/10.1016/j.jairtraman.2018.05.008
[24] Ignaccolo, M., Inturri, G., Giuffrida, N., Torrisi, V., Cocuzza, E. (2020). Sustainability of freight transport through an integrated approach: The case of the eastern Sicily port system. Transportation Research Procedia, 45: 177-184. https://doi.org/10.1016/j.trpro.2020.03.005
[25] Djordjević, B., Mane, A.S., Krmac, E. (2021). Analysis of dependency and importance of key indicators for railway sustainability monitoring: A new integrated approach with DEA and Pearson correlation. Research in Transportation Business & Management, 41: 100650. https://doi.org/10.1016/j.rtbm.2021.100650
[26] Karjalainen, L.E., Juhola, S. (2019). Framework for assessing public transportation sustainability in planning and policy-making. Sustainability, 11(4): 1028. https://doi.org/10.3390/su11041028
[27] Morioka, S.N., Carvalho, M.M. (2016). Measuring sustainability in practice: Exploring the inclusion of sustainability into corporate performance systems in Brazilian case studies. Journal of Cleaner Production, 136: 123-133. https://doi.org/10.1016/j.jclepro.2016.01.103
[28] Pesqueux, Y. (2002). Organisations: modèles et représentations. Presses Universitaires de France, collection Gestion, Paris, 397.
[29] da Silveira Guimarães, J.L., Salomon, V.A.P. (2015). ANP applied to the evaluation of performance indicators of reverse logistics in footwear industry. Procedia Computer Science, 55: 139-148. https://doi.org/10.1016/j.procs.2015.07.021
[30] Lambert, S., Riopel, D., Abdul-Kader, W. (2011). A reverse logistics decisions conceptual framework. Computers & Industrial Engineering, 61(3): 561-581. https://doi.org/10.1016/j.cie.2011.04.012
[31] Yang, J. (2010). On the construction and implementation methods for performance measurement of reverse supply chain. In 2010 Seventh International Conference on Fuzzy Systems and Knowledge Discovery, IEEE, 2: 899-903. https://doi.org/10.1109/fskd.2010.5569111
[32] Du, C.J., Sun, D.W. (2006). Learning techniques used in computer vision for food quality evaluation: A review. Journal of Food Engineering, 72(1): 39-55. https://doi.org/10.1016/j.jfoodeng.2004.11.017
[33] Gardner, M.W., Dorling, S.R. (1998). Artificial neural networks (the multilayer perceptron)-a review of applications in the atmospheric sciences. Atmospheric Environment, 32(14-15): 2627-2636. https://doi.org/10.1016/S1352-2310(97)00447-0
[34] Christensen, J., Bastien, C. (2015). Nonlinear optimization of vehicle safety structures: Modeling of structures subjected to large deformations. Butterworth-Heinemann.