Arunkumar Subramaniam![]() | Nurru Anida Ibrahim
| Nurru Anida Ibrahim![]() | Siti Norbakyah Jabar
| Siti Norbakyah Jabar![]() | Salisa Abdul Rahman*
| Salisa Abdul Rahman*![]()
© 2024 The authors. This article is published by IIETA and is licensed under the CC BY 4.0 license (http://creativecommons.org/licenses/by/4.0/).
OPEN ACCESS
This paper is the result of the electric vehicle (EV) powertrain and fuel powered vehicle analysis conducted by using the Ipoh driving cycle (IDC) in Simulink. This thorough analysis is on studying the effectiveness of fuel-powered vehicle and EV on the IDC which involves a several main components of an EV which includes motor and controller subsystem, battery system, driver system and the parameter calculations. The model also involves a dashboard in which all parameters are viewed in it. Several parameters were chosen for this analysis, which is time, distance travelled, average speed, average running speed, average acceleration, average deceleration, acceleration percentage, deceleration percentage, idling percentage, cruising percentage, kWh and fuel costing, battery voltage, current, state-of-charge (SOC) and power. This paper involves two major methods which are EV modelling and EV analysis. Several parameters are considered during the modelling process; aerodynamic drag force, rolling resistance force, gravitational force and cumulative tractive force which impacts the efficiency of the EV. EV is proven to be more efficient in which the cost of travelling with an EV on IDC is 60% lower compared to a fuel powered vehicle.
driving cycle, road profile, DC-TRAD, electric vehicle powertrain, Simulink model
The dramatic rise in the number of vehicles is the major contributor to global warming and environmental deterioration, leading to growing concerns worldwide regarding the emission of hazardous gases and substances. Investigations into vehicle emission rates reveal that, while heavy-load vehicles generally exhibit satisfactory internal combustion efficiency, their overall efficiency diminishes due to operating at lower speeds [1]. The research on electric vehicles (EVs) play a vital role in addressing issues on dangerous emissions and engine efficiency. The adoption of EVs has the potential to significantly reduce pollutants. Studies on air pollution and health impacts in Malaysia highlight that motor vehicle emissions account for 70%–75% of pollution, with land transportation, industrial emissions, and open burning being major contributors [2]. The detrimental effects of excessive carbon emissions on human health emphasize the significance of recent developments, such as the importance of driving cycles [3]. Malaysia is currently in the early stages of driving cycle development [4-6]. The cons of the existing driving cycles can be seen mainly due to several factors such as improper development techniques [7]. Several models and studies had been conducted in the past to study the emission and consumptions [8] however it does not give a great success due to modelling complexities. Besides, the advancement on driving cycle is relatively important to aid in the reduction of dangerous gases into the atmosphere. Therefore, as an alternative to the fuel powered vehicle, electric vehicle (EV) is gradually emerging into the industries for a greener energy management. EVs function either partially or entirely on electricity, presenting a viable alternative to conventional gasoline and fuel-powered vehicles. The surge in demand for EVs is attributed to their simplicity, featuring fewer moving parts that result in substantially reduced maintenance costs. Moreover, EVs contribute to environmental sustainability by either minimizing or eliminating the consumption of fuels and gasoline. Modern EVs frequently utilize lithium-ion batteries due to their superior reliability and impressive energy retention, characterized by a minimal monthly self-discharge rate of approximately 5%. The appeal of EVs is further underscored by the fact that battery-powered and electric vehicles boast a remarkable reduction of 99% in moving parts, leading to significantly diminished maintenance requirements [9]. Acknowledged as an effective solution for curbing greenhouse gas emissions and averting environmental disasters, the adoption of EVs continues to gain momentum [10]. Considering that nearly 98% of the transportation and energy sectors heavily rely on fuels and gasoline, the crucial role of EVs becomes evident. The United States Environmental Protection Agency (EPA) emphasizes the dominant role of human activities in greenhouse gas emissions, serving as the main cause of the changes in climate [11]. To address this environmental challenge, EVs emerge as a pivotal component, potentially resulting in a 30%-50% reduction in greenhouse gas emissions when replacing traditional fuel-powered vehicles. Emphasizing the paramount importance of data validation, it stands as a critical tool to ensure the reliability and accuracy of research findings. This reliability is pivotal for proactive application across various contexts [12]. Taking a progressive step, the conceptual model of an EV undergoes thorough validation and verification using the established IDC [7].
This is clear; however, the advancement of EV is another globally discussed topic in which it must be very precise in component selection and sizing according to the environment of the EV being used. This paper is an initiative taken to model an EV in the Simulink environment with general component sizing and selection and the Ipoh driving cycle (IDC) were simulated and analyzed in the model. To validate the results obtained, a driving cycle tracking device (DC-TRAD) was used to collect data on the Ipoh driving cycle (IDC) and simulated in the EV model as a comparison.
The parameters such as the aerodynamic drag force, rolling resistance force, gravitational force, and cumulative tractive force gives a huge impact on the efficiency of the EV. The equations stated below are the default values and parameters set in the EV toolbox of Simulink model and therefore only needs to be adjusted if needed according to the environment of the EV to be used. A general parameter set is sufficient for IDC.
2.1 Parameter calculation
Identifying the vehicle dynamics is the first step towards modelling an electric vehicle [7]. This crucial phase plays a pivotal role in optimizing the energy performance of the electric vehicle to meet its primary objective of enhancing energy efficiency. The factors involved in this optimization include aerodynamic forces, gravitational force, acceleration forces, rolling resistance forces, tractive effect, motor power, and battery efficiency. Like other vehicles, EV also experience aerodynamic drag but this can be more critical to the shape of the EV which is more boxy to accomodate batteries. Higher drag forces requires more energy to overcome which reduces the efficiency of the EV. Thus, reducing the drag coefficient through aerodynamic design and by minimizing the frontal area can help increasing the efficiency. Eq. (1) represents the general aerodynamic drag force equation, providing a mathematical depiction of this influential aspect.
$F_{a d}=\frac{1}{2} \rho A_f C_d V(S)^2$ (1)
where,
Rolling resistance, within the framework of a vehicle's tire, is the energy dissipated per unit distance travelled. It is also referred to as the friction of the vehicle's tires, where motion is constrained due to non-elastic effects and the inherent properties of the tires. In Evs, the rolling resistance comes from the friction between the tyre and the road and therefore this friction must be optimized with a lower rolling resistance and an optimized tyre pressure to increase the efficiency. The general equation for rolling resistance force, as depicted in Eq. (2), provides a mathematical representation of this force.
$F_{r r}=\mu_{r r} m g$ (2)
where,
The gravitational force, alternatively termed as the acceleration of gravity, is characterized by the gravitational force of an atomic unit, commonly referred to as the "Gravitational Force Quantum." This force is equal to the impact of one atomic unit of Earth's mass on a kilogram of mass situated on the Earth's surface. This force affects the energy required to move the EV especially uphill. During an upgill drive, the EV start to consume higher energy to overcome the gravitational force and in accordance reduce the efficiency. In the technology of EV, regenerative braking is an important element to overcome this loss and to recover some energy during descent. Eq. (3) is a representation of the general gravitational force equation, offering a mathematical expression for this fundamental force.
$F_g=m g \sin \alpha$ (3)
where,
Two distinct types of acceleration forces are identified: linear acceleration and angular acceleration. Linear and angular acceleration play an important role in modelling EV as they are the key parameters for understanding the vehicle dynamics, performances and efficiency. Linear acceleration which is mainly on the forward motion of the vehicle and the angular acceleration which is mainly on the rotational motion of the wheels are the fundamental for eV modelling. This is important to predict the vehicle speed, position and trajectory under different driving conditions. Linear and angular acceleration also helps in modelling the powertrain system including the gearbox and electric motor to analyze the behaviour of torque and the power requirements better. Also, since acceleration directly impacts the energy consumption, this information is importannt to estimate the sizing of the battery, driving range and overall efficiency in different driving scenarios.The representation for angular acceleration is expressed by Eq. (4).
$F_{w a}=\frac{I G^2}{n_g r^2} a $ (4)
where,
The cumulative tractive force is the result of adding up all the forces exerted on the vehicle, as outlined in Eq. (5). Reducing the cumulative forces is the aim of the EV developers and manufacturers including the aerodynamic drag forces, gravitational forces, rolling coefficient, regenerative braking, efficient drivetrains, and lightweight materials.
$F_{t e}=F_{a d}+F_{r r}+F_g+F_{w a}$ (5)
Concerning the motor, its role involves converting electrical power into mechanical power. In an electric vehicle, the motor undergoes two distinct phases: during acceleration and during deceleration. When the electric vehicle is accelerating, the electric power delivered to the motor surpasses the mechanical power output, while during deceleration, the power released to the motor is lower than its mechanical power output. As such, Eqs. (6)-(9) are assigned to represent the motor power output and the power supplied to the motor during both acceleration and deceleration.
Motor power output during acceleration,
$P_{\text {motorout }}=\frac{P_{t e}}{n_g}$ (6)
Motor power output during deceleration,
$P_{\text {motorout }}=P_{t e} n_g$ (7)
Power into Motor during acceleration,
$P_{\text {motorin }}=\frac{P_{\text {motorout }}}{n_m}$ (8)
Power into Motor during deceleration,
$P_{\text {motorin }}=P_{\text {motorout }} n_m$ (9)
where,
2.2 EV modelling
The automotive industry has undergone a transformation with the introduction of electric vehicles (EVs). Utilizing EVs offers an alternative for the automotive sector to facilitate transportation without causing environmental degradation [11]. The modelling of electric vehicles involves various interconnected models to ensure the effective functioning of the entire system. During the initial construction phase, specific parameters need to be initialized to establish the vehicle and driving interface. These parameters include tire specifications, body parameters, the motor types, and the integration of the battery subsystem.
Electric vehicles can be modelled using different types of motors, each with its own set of characteristics. In the market, most electric vehicles are equipped with an induction motor coupled with an automotive differential pair set due to its simple arrangements and couplings. The function of the automotive differential is to drive a pair of wheels at different speeds. Induction motors are known for their efficiency and require a minimal cooling system due to their low excitation current count.
Lithium-ion batteries are commonly used in EVs as their energy storage systems. Unlike mobile phones and laptops, electric vehicles employ a stack of thousands of lithium-ion cells operating in series and parallel. This configuration enables the conversion of electrical energy to chemical energy during charging, and the reverse conversion during driving, supplying ample power to the vehicle's motor for torque and rotational speed production.
2.3 EV analysis
The analysis of the EV model was done by using the established IDC in which the dataset comparison was done between the EV model and DC-TRAD. To evaluate, several parameters were chosen with respective to the battery capacity and sizing: voltage, current, power and state-of-charge (SOC). Besides, the kilowatt-hours (kWh) and the fuel costs were also analysed in Ringgit Malaysia (RM).
3.1 Developed EV model
The development of electric vehicle conceptual model in Simulink includes the usage of simscape, and vehicle dynamics blocksets. All basic blocks are integrated together into separate subsystems which consists of driver input, motor & controller, battery, and the vehicle body and tires subsystem. For easier troubleshooting and analysis, separate subsystems were created for each systems including a dashboard with all information of the study analysis. In this model, the driver input subsystem plays a vital role as it enables the user to select the predefined routes in the model.
The subsystem for the motor and controller has the brushed direct current (DC) motor with a permanent magnet pole as the primary electric engine for the EV. Permanent magnets are often used in EV production as it can be strategically placed in the EV rotor, responding to the applied current in the stator and inducing rotor rotation [13]. However, both brush and brushless DC motor has its own advantages and disadvantages. Brushed DC motors are often used in EV due to its simplicity. Brushed DC motor has a simpler design compared to a brushless DC motor in which the maintenance and repair of a defective brush DC motor is easier and cost effective. Another major reason for the selection of brushed DC motor is for its high starting torque. On the other hand, brushless DC motor is often not the choice of the EV manufacturers due to its complex design and the need of a standalone electronic speed controllers (ESC) for operation. This adds complexity to the control system and requires higher maintenance. In this study, a square sinusoidal PWM configuration is implemented to generate a pulse modulation of zero and one, synchronized with the reference velocity command. Specifically, a value of one corresponds to acceleration, while zero signifies deceleration [14]. To further enhance the simulation process, a solver configuration block, utilizing the ode23t solver, is integrated into the model. This block ensures the precise specification of solver parameters, critical for the accurate execution of the model. Its function is to minimize instances of zero crossing and hitting, thereby preventing errors during the simulation process. Figure 1 shows the driver input subsystem.
Pulse width modulation (PWM) is of paramount significance in the realm of electric vehicle simulation models. It serves as the linchpin for regulating the electric motor, controlling speed, and ensuring efficient energy conversion. This control mechanism enables precise management of torque, facilitating smooth acceleration and deceleration. PWM also plays a pivotal role in regenerative braking, governing the energy flow during braking and aiding in efficient battery charging. Additionally, it mitigates harmonic distortion, enhancing the electrical system's stability and reliability. In simulation models, PWM fosters realism by mirroring actual vehicle control strategies, ensuring thorough performance validation. Furthermore, its capacity to reduce electromagnetic interference is instrumental in maintaining the integrity of electronic components within the vehicle. Ultimately, PWM is an essential tool for integration with control algorithms, optimizing electric vehicle performance across diverse driving conditions. Figure 2 shows the configuration of the PWM block.
Besides, the H-bridge is indispensable in electric vehicle simulations, serving a diverse range of functions pivotal for precise control and an authentic representation of vehicle dynamics. Its core role lies in directing motor movement and controlling speed by modulating voltage, ensuring efficient acceleration and deceleration. Its involvement in regenerative braking is key for conserving energy and extending the electric vehicle's driving range. Beyond adding realism to simulations, the H-bridge seamlessly integrates with advanced control algorithms, adapting dynamically to different driving conditions and optimizing overall vehicle performance. Its contribution to fault analysis enhances system robustness testing, while the implementation of soft-start and soft-stop functions minimizes mechanical stress on the motor, promoting longevity and reliability. In essence, the H-bridge stands as a vital component in electric vehicle simulations, impacting control precision, efficiency, and system resilience in diverse operational scenarios. Figure 3 shows the configuration for the H-bridge block.
Figure 1. Driver input subsystem
Figure 2. PWM configuration
Figure 3. H-bridge configuration
The computation of total kilowatt-hours (kWh) consumed involves integrating power. In Malaysia, the cost per kilowatt-hour of electricity is RM0.408 [15]. Thus, the total cost of kWh during the journey for each route can be calculated using Eq. (10). Considering the current price of RON95 petrol at RM2.05 [16], the cost of fuel consumption can be determined using Eq. (11).
$k W h ~ Price =k W h * 0.408$ (10)
$Fuel Price =\frac{\text { Total Distance }}{1 / 6} * 2.05$ (11)
3.2 EV analysis
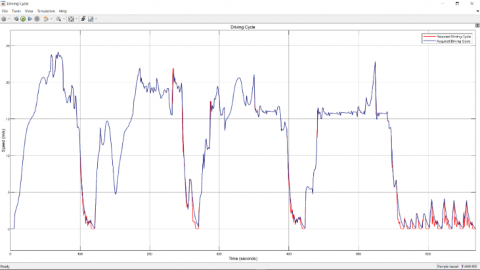
The predefined IDC points serve as the required data, while the simulated data generated in Simulink takes precedence as the acquired data. The entirety of the gathered data points is systematically organized and presented in Table 1 and Figure 4.
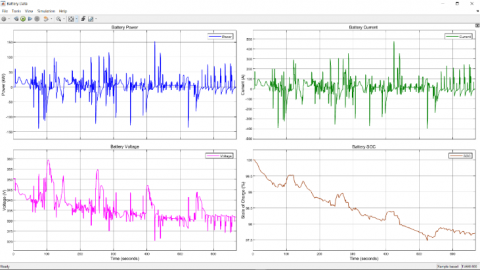
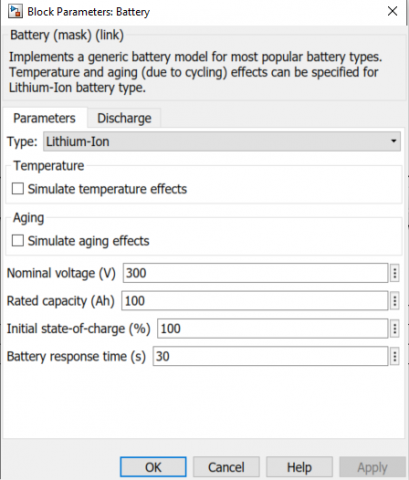
As per the analysis, the outliers between required and acquired driving cycle is relatively small and can be neglected as it is measured in a relatively small unit which is mm/s. a vast difference can be seen during the deceleration phase in which the required data has a steeper zero m/s speed hit compared to the acquired data. This phenomenon is due the tendency of the vehicle to remain in travel or remain in stop or commonly known as inertia. In the developed EV model, the inertia is configured at 0.1 g.cm2. Additionally, with the incorporation of a generic battery model into the system, it becomes possible to retrieve critical data points such as battery voltage, current, power, and State of Charge (SOC). The dimensions of the battery, discharge rate, and SOC are pivotal considerations in the performance of a standard vehicle. In the outlined model, a battery size of 300VDC paired with a rate of discharge of 100Ah is chosen, reflecting a common configuration observed in the batteries of many electric vehicles available in the market. Figure 5 shows the battery system analysis.
Table 1. Battery specification analysis
|
Item |
Unit |
IDC |
|
Peak Power |
kW |
95.37 |
|
Peak Current |
A |
282.40 |
|
Peak Voltage |
V |
359.4 |
|
Battery SOC |
% |
97.72 |
|
kWh Charge |
RM |
1.57 |
|
Fuel Charge |
RM |
3.99 |
Figure 6. Battery configuration
Figure 7. Costing subsystem
The battery's upper charging limit is set to 350V, accompanied by a 0.03 Ω resistance to maintain optimal performance during standard operations. This prescribed float voltage, slightly surpassing the nominal voltage, is strategically set to ensure the battery undergoes periodic charging beyond its nominal levels. This proactive charging strategy serves dual purposes: securing backup power during idle periods and compensating for the inherent self-discharge of the battery. It's important to note that the float voltage is notably influenced by the surrounding temperature. Consequently, a float voltage of 60V is integrated into the generic battery model, introducing an overall 10 percent tolerance. Furthermore, the motor power exhibits sporadic momentary spikes, indicative of intermittent motor overloading. Figure 6 shows the configuration settings of the battery used.
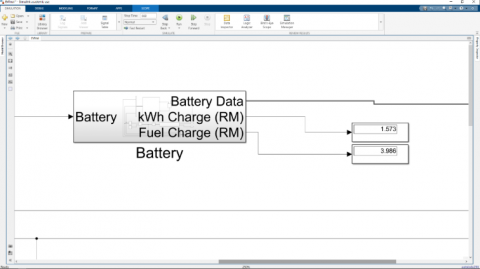
Considering the battery SOC, the remaining battery capacity is at 97.72% in which can be concluded as a satisfactory outcome of an EV for the travel of 27.5km distance with 40 minutes travelling time. Also, regenerative braking operates within the battery State of Charge (SOC) spectrum, encompassing various battery recharging states resulting from braking actions. The energy generated during braking, known as kinetic energy, is redirected back into the vehicle's battery. This reclaimed energy can then be utilized for subsequent acceleration, deceleration, and powering other vehicle components. The amount of battery charge restored during braking is relatively modest, falling within the range of 0.2V to 0.7V. Apart from that, it is also proven that the cost of travelling on the Ipoh route with EV is relatively cheaper compared to a fuel-powered vehicle in which the cost of travelling on a fuel-powered vehicle is nearly three times the cost of travelling on an EV. Figure 7 shows the costing subsystem in the EV model.
In conclusion, from the research, it can be clearly seen that the travel with EV is relatively cheaper by 60% compared to a fuel powered vehicle on the IDC. The cost of travelling on the IDC by using the EV is RM1.57 and with a fuel powered vehicle is RM3.99. EV has zero emission as it does not burn any fuel and does not release any dangerous gases to the environment, however the charging of the batteries plays a vital role in energy management as electricity is also a source of energy and will be consumed in a large amount during the transition of the fuel powered vehicles to EVs.
With this, a few energy saving techniques could be considered to eliminate the wastage of excessive electricity in the form of energy. Firstly, smart charging system could be implemented on the charging stations in which the charging can be optimized to its best state. The EV users could also consider charging their vehicles during the off-peak period for a lower electricity rate. Besides, the vehicle-to-grid (V2G) technology also has an advantage over the usage of EV in which it enables the bidirectional energy flow between the grid and the EV, allowing the battery to serve as energy storage devices. Also, charging infrastructure efficiency could be realized in which Level 2 charges with high power conversion efficiency could be an option to minimize energy losses during charging of the EV. Most importantly, the maintenance of the charging stations and equipment is also relatively important to reduce unnecessary energy wastage. Onboard energy management systems and battery management systems are also one of the key features that should be adapted in the EV for energy optimization.
There are some rooms for improvements of the EV technology especially on the battery technology. Increasing the energy density and reducing the weight of the battery packs would be the best solution to optimize the energy consumption of an EV and in accordance extend the driving range. Also, the batteries can be recycled to reduce raw material costs and environmental impacts. On the other hand, the powertrain calibration option is another important feature that can be included in the technology of EV to ensure proper functioning of the control system. Scheduled calibration of the powertrain system can also optimize the motors and gearbox ratios or transmission settings for better power delivery and acceleration performance.
The authors would like to be obliged to Universiti Malaysia Terengganu for providing financial assistance under FRGS 2020-1 (FRGS/1/2020/TK0/UMT/02/2) and Faculty of Ocean Engineering and Technology, UMT for all their technical and research support for this work to be successfully completed.
[1] Heywood, A. (2013). Political Ideologies: An Introduction. Palgrave Macmillan, pp. 27-55.
[2] Afroz, R., Hassan, M.N., Ibrahim, N.A. (2003). Review of air pollution and health impacts in Malaysia. Environmental Research, 92(2): 71-77. https://doi.org/10.1016/S0013-9351(02)00059-2
[3] Achour, H., Olabi, A.G. (2016). Driving cycle developments and their impacts on energy consumption of transportation. Journal of Cleaner Production, 112(Part 2): 1778-1788. https://doi.org/10.1016/j.jclepro.2015.08.007
[4] F&L Asia. Malaysia developing draft for fuel economy driving cycle. https://www.fuelsandlubes.com/malaysia-developing-draft-for-fuel-economy-driving-cycle.
[5] The different driving cycles – Learn automotive engineering from auto engineers. (2020). https://www.car-engineer.com/the-different-driving-cycles.
[6] Abas, M.A., Rajoo, S., Zainal Abidin, S.F. (2018). Development of Malaysian urban drive cycle using vehicle and engine parameters. Transportation Research Part D: Transport and Environment, 63: 388-403. https://doi.org/10.1016/j.trd.2018.05.015
[7] Brady, J., O’Mahony, M. (2016). Development of a driving cycle to evaluate the energy economy of electric vehicles in urban areas. Applied Energy, 177: 165-178. https://doi.org/10.1016/j.apenergy.2016.05.094
[8] Galgamuwa, U., Perera, L., Bandara, S. (2015). Developing a general methodology for driving cycle construction: Comparison of various established driving cycles in the world to propose a general approach. Journal of Transportation Technologies, 5(4): 191-203. https://doi.org/10.4236/jtts.2015.54018
[9] Arat, M., Bolarinwa, E.O. (2015). Rolling resistance effect of tire road contact in electric vehicle systems (No. 2015-01-0624). SAE Technical Paper. https://doi.org/10.4271/2015-01-0624
[10] US EPA. Transportation, Air Pollution, and Climate Change. https://www.epa.gov/transportation-air-pollution-and-climate-change, accessed on Sep. 10, 2023.
[11] Awasthi, N. (2020). Designing of electric vehicle using MATLAB and Simulink. In Proceedings of the International Conference on Recent Advances in Computational Techniques (IC-RACT). https://doi.org/10.2139/ssrn.3701771
[12] Bhatt, A. (2016). Planning and application of electric vehicle with MATLAB®/Simulink®. In 2016 IEEE International Conference on Power Electronics, Drives and Energy Systems (PEDES), Trivandrum, India, pp. 1-6. https://doi.org/10.1109/PEDES.2016.7914220
[13] Skill-Lync. (2020). Electric vehicle modelling with MATLAB-Simulink. https://skill-lync.com/student-projects/electric-vehicle-modelling-with-matlab.
[14] Gupta, V., Deb, A. (2012). Speed control of brushed DC motor for low cost electric cars. In 2012 IEEE International Electric Vehicle Conference, Greenville, SC, USA, pp. 1-3. https://doi.org/10.1109/IEVC.2012.6183251
[15] GlobalPetrolPrices.com. Malaysia electricity prices. https://www.globalpetrolprices.com/Malaysia/electricity_prices/.
[16] Petrol price Malaysia live updates (RON95, RON97 & Diesel). https://ringgitplus.com/en/blog/petrol-credit-card/petrol-price-malaysia-live-updates-ron95-ron97-diesel.html.