Mafrisal | Muhammad Yamin Jinca*![]() | Muhammad Saleh S. Ali | Muhammad Asdar
| Muhammad Saleh S. Ali | Muhammad Asdar
© 2024 The authors. This article is published by IIETA and is licensed under the CC BY 4.0 license (http://creativecommons.org/licenses/by/4.0/).
OPEN ACCESS
In the archipelago of Makassar, Indonesia, maritime resources within the sectors of trade, fisheries, and tourism present a significant opportunity to elevate community welfare across small rural islands. This study aims to evaluate the performance of the existing inter-island transportation system and formulate strategies for the development of sea transportation between these islands. Employing a comprehensive integrated planning approach (IPAp), the research utilizes correlation analysis, importance performance analysis (IPA), the problem orientation policy model, and analysis of strengths, weaknesses, opportunities, and threats (SWOT). Through both qualitative and quantitative descriptive methods, the investigation delineates the critical role and performance of inter-island sea transportation, laying the groundwork for the establishment of policy priorities aimed at enhancing these services. Findings indicate that the facilities and infrastructure of inter-island transportation are pivotal, with correlation R ranging from 0.565 to 0.7602. However, the current performance of inter-island sea transportation services across all island clusters remains below par, with user satisfaction levels ranging from 38% to 50%. This underscores the necessity for a targeted action program focused on the development of sustainable transportation facilities and infrastructure. Such initiatives are essential for the formulation and revision of local transportation development plans, providing a foundation for infrastructure investment decisions that support the growth of marine and maritime economy in archipelagic areas.
regional island development, integrated planning approach, sustainable transportation, transportation performance
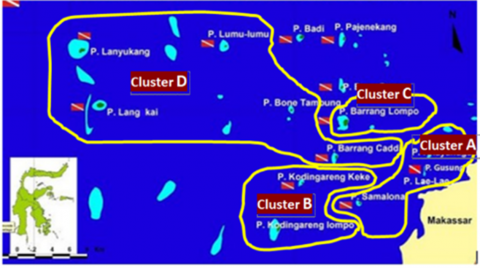
South Sulawesi has 120 islands in the Spermonde Islands region, 12 of which are within the administrative area of Makassar City. The geographical distance between islands is far apart, and the distribution of population is uneven. Marine and maritime resources have the potential to prosper the community if supported by a well-performing production and transportation system. This requires support for the performance of a sea transportation service system with good inter-island connectivity.
Theoretically and factually, island transportation is a supporting facility and developer of island cluster development that has the economic potential of natural resources in supporting the acceleration and expansion of economic development for the welfare of the community [1, 2]. Similarly, in the Spermonde region of Makassar, transportation services are important considering that the region has tourism and fisheries potential that can be developed to support the development of the economic sector of the rural small island cluster.
The socio-economic conditions of the community indicate that 75% are at a less prosperous and underprivileged level, with family incomes averaging around $200 US per month and an average of 4 dependent family members. The societal socio-economic conditions are situated at the level of fulfilling physiological and safety needs, as well as social needs [3]. The anticipated role of transportation leans more towards a social function, aiming to provide transportation facilities and infrastructure with adequate capacity and accessibility, affordable rates, efficiency, and safety.
The function of inter-island transportation serves as the vital infrastructure supporting blue and maritime economic activities. It constitutes a fundamental element in facilitating community engagement in various sectors, including inter-island trade, fisheries, tourism, and other social systems. However, the current role falls short of effectively supporting community socio-economic activities and fails to expedite economic development, leading to insufficient enhancement of investment and regional economic competitiveness. Consequently, it lacks a multiplier effect on consumption, community capital, per capita income, and regional income [4].
The main problem with inter-island transportation services on small islands is that the performance of inter-island transportation facilities and infrastructure in supporting the economy of island communities is still inadequate and not optimal [1, 5]. This requires support for the performance of the sea transportation service system with good inter-island connectivity [6]. For this reason, a problem-based policy strategy concept is needed in developing infrastructure networks and transportation services that are efficient, effective, and sustainable [7].
The benefit of research is to enrich analytical methods for the development of transportation in the archipelagic region. As input for the development of local transportation development plans (Tatralok) for small islands in the island group, thereby increasing accessibility in remote, protected, underdeveloped, and rural island areas. This area has the potential for regional economic development by supporting the blue economy and the maritime group of islands. In this way, there can be an increase in sustainable social and environmental economic activities and an increase in the welfare of the people of the archipelagic region through intrinsular sea transportation. Specifically, in the island area of Makassar City.
Inter-island maritime transportation plays a central role in the dynamics of regional development on the islands of Makassar. This transportation facility serves as a fundamental element supporting the economic ecosystem, inter-island trade, fisheries activities, and the tourism sector. Through the optimization of maritime connectivity, the island regions can maximize the exploitation of their natural resources, expand market coverage, and enhance interactions with other areas, evolving into a catalyst for economic growth and the welfare of island communities [8].
The movement and interactions among communities across islands and with the main islands are still low. Therefore, the availability of both public and pioneer vessels meeting safety and comfort standards is crucial [9]. This aligns with the objectives of pioneer transportation [10]: i) opening up isolated or remote areas; ii) enhancing inter-island trade and population mobility; iii) reducing regional disparities, and realizing regional stability.
The low sustainability of maritime transportation performance, particularly in the context of trade mobility, fishing activities, and the tourism sector, can induce significant impacts. The reduced effectiveness of maritime transportation hampers the flow of goods and individuals between islands, leading to decreased productivity in the economic sector. There is a potential for significant losses in fishing activities due to delays in the distribution of marine products. The tourism sector may also be negatively affected by accessibility constraints, hindering the distribution of coastal logistics and hinterland areas behind the port [11, 12]. This involves the management of connectivity and the integration of maritime and land transportation modes [13]. Overall, this situation has the potential to substantially decrease community and regional income.
Table 1. Research gap
|
Reference |
On time |
Smoothness |
Integrated |
Efficient |
Easy to Reach |
Capacity |
Accessibility |
Regularity |
Tariff |
Pollution |
Safety |
Comfort |
Orderly |
Security |
|
|
XY11 |
XY12 |
XY13 |
XY14 |
XY21 |
XY22 |
XY23 |
XY24 |
XY25 |
XY31 |
XY32 |
XY33 |
XY34 |
XY35 |
|
[10] |
|
√ |
√ |
√ |
|
√ |
√ |
√ |
√ |
√ |
√ |
√ |
√ |
√ |
|
[14] |
√ |
√ |
√ |
√ |
√ |
√ |
√ |
√ |
√ |
|
√ |
√ |
√ |
|
|
[15] |
|
|
|
|
|
|
|
|
|
|
√ |
|
√ |
|
|
[16] |
|
|
|
|
√ |
√ |
|
|
|
|
|
|
|
|
|
[17] |
√ |
|
|
|
|
√ |
|
|
|
|
|
√ |
|
|
|
[18] |
|
|
|
|
|
√ |
√ |
|
√ |
√ |
√ |
|
|
√ |
|
[19] |
|
|
|
|
|
√ |
|
|
|
|
|
|
√ |
|
|
[20] |
|
|
|
|
√ |
√ |
|
|
|
|
|
√ |
|
|
|
[21] |
|
|
|
|
|
√ |
|
|
|
√ |
|
|
|
|
|
[22] |
√ |
|
|
|
|
√ |
|
|
|
|
|
|
|
|
|
[23] |
|
|
|
|
√ |
|
|
|
√ |
|
|
|
|
|
|
[5] |
|
|
|
|
|
|
|
√ |
|
|
|
√ |
|
|
|
[13] |
|
|
√ |
|
|
|
√ |
|
|
|
|
|
|
|
|
[24] |
|
|
|
|
√ |
|
|
√ |
√ |
|
|
|
|
|
|
[25] |
|
|
|
|
|
|
|
|
√ |
|
√ |
|
|
|
|
[26] |
|
|
|
√ |
|
|
|
|
|
|
|
√ |
|
√ |
|
[27] |
√ |
|
|
|
|
|
|
|
|
|
√ |
|
|
|
|
[28] |
|
|
|
|
|
|
√ |
|
|
|
|
|
|
|
|
Mafrisal et al. |
√ |
√ |
√ |
√ |
√ |
√ |
√ |
√ |
√ |
√ |
√ |
√ |
√ |
√ |
The performance of maritime transportation services is a direct parameter for economic growth and the development of island regions [22]. Transportation services serve as the backbone for supporting economic activities, inter-island trade, fisheries activities, and the tourism sector. Island regions with good connectivity can optimize the utilization of their natural resources, expand market reach, and enhance connections with other areas. This is pivotal in fostering economic growth and the welfare of island communities [29]. Moreover, as a driver for the development of remote or underdeveloped areas, it functions to provide transportation services to stimulate the growth of disadvantaged regions and remote villages, and alleviate poverty in remote areas [20]. Therefore, it is crucial to evaluate the performance of services and formulate policies for the development of inter-island maritime transportation. The formulation of these policies is based on 14 indicators explained in Table 2.
To enhance the effectiveness of inter-island maritime transportation services in supporting the economy of island communities, several strategic steps can be taken, including the improvement of port facilities, docks, and other supporting facilities to ensure efficient operations [24]. Expanding connectivity through the development of shipping routes and increasing travel frequencies to improve inter-island connectivity. Establishing competitive and affordable tariff policies to facilitate easier access to maritime transportation services for the community [22]. Conducting training and intensifying supervision to ensure optimal levels of safety and security in maritime transportation operations [30]. Adopting information technology to streamline ticket booking processes, monitor shipping routes, and efficiently manage operational activities.
The role of inter-island transportation in the Makassar Islands cluster has not been very visible in supporting the socio-economic activities of the community. Small island transportation services in the island cluster area sometimes heed the norms, standards, guidelines and criteria for sailing safety. Given the importance of marine transportation for the economy of the people on the islands, a model of policy integration in sustainable transportation planning should be developed. The output of this model is an input in developing the concept of local transportation planning for the islands [31]. The research gap between this research and previous research can be seen from the variables used in Table 1.
This research is observational, using questionnaires and cameras as well as transportation to reach field study objects. Using quantitative and qualitative descriptive methods to study the existence of the role of sea transportation in supporting the economy of island communities, analyzing the suitability between performance and expectations that are considered important by stakeholders. The research was conducted in the island cluster area located in Makassar City, South Sulawesi, Indonesia, as shown in Figure 1.
In this study, 14 indicators were evaluated, and divided into economic, social and environmental sustainability attributes to provide a comprehensive portrait of performance in Table A1 in Appendix.
Figure 1. Spermonde research location in Makassar City
3.1 Data collection
Data collection was conducted on each island cluster, involving respondents such as service users, operators, regulators, and academics. A total of 120 respondents (males are 62.5% and females are 37.5%). The selection of respondents was performed using cluster random sampling, considering the respondents' level of understanding regarding the condition of the maritime transportation system and their engagement in activities using sea transportation.
Data was collected using a questionnaire instrument through in-depth interviews with all respondents. The assessment of each indicator is based on a Likert scale of 1-5, including 1 = very bad, 2 = not good, 3 = quite good, 4 = good, 5 = very good.
The characteristics of respondents are that most of them are classified as pre-prosperous and not yet prosperous, earning about 75% below the regional minimum wage (RMW) of Makassar City, which is less than IDR 3,000,000, or about US$200.00 in 2023). Movement mobility: people travel for trading activities and work as much as 66.7%. Movement to and from the island is mostly oriented towards Makassar City, which is the center of trade activities in South Sulawesi. The highest frequency of travel is 3-5 times a week (37.5%) and 6-9 times a week (35.8%); see Table 2 for more details.
Table 2. Demographic and job characteristics of respondent
|
Characteristics |
Distribution (%) |
|
Age (years) |
|
|
Under 18 |
10.0 |
|
18 – 35 |
47.5 |
|
36 – 55 |
35.0 |
|
55 and above |
7.5 |
|
Education Level |
|
|
Not attending school/primary school |
22.5 |
|
Middle/senior high school |
43.3 |
|
Bachelor/diploma |
31.7 |
|
Master/doctor |
2.5 |
|
Work |
|
|
Fishermen |
32.5 |
|
Self-employed |
23.3 |
|
Civil servants and private sector |
25.0 |
|
Student |
10.0 |
|
Housewife |
5.8 |
|
Others |
3.3 |
|
Income per month (IDR) |
|
|
< 1 million |
28.3 |
|
1 – 3 million |
46.7 |
|
3 – 5 million |
20.0 |
|
> 5 million |
5.0 |
|
Travel Destination |
|
|
Work and trade |
66.7 |
|
School |
10.0 |
|
Social/visiting family |
6.7 |
|
Recreation |
9.2 |
|
Others |
7.5 |
|
Travel Frequency (a week) |
|
|
< 3 times |
11.7 |
|
3 – 5 times |
37.5 |
|
6 – 9 times |
35.8 |
|
> 10 times |
15.0 |
3.2 Statistical tests
In the pre-survey stage, a reliability test was conducted to assess the reliability and consistency of the questionnaire as a measuring tool. The results indicated that the Cronbach's alpha values ranged from 0.63 to 0.75, indicating fairly good reliability. Additionally, following the data collection from the survey process, a validity test was performed on the 14 sea transportation service performance indicators. A confidence level of 95% (2-tailed) was applied, and the calculated r value was 0.232, signifying the validity of all the indicators.
A data normality test was also carried out using the critical ratio skewness value criterion of ±1.20 at a significance level of 0.02. Based on the test results, it can be concluded that the data is normally distributed, as the critical ratio skewness and kurtosis ratio values fall within the range of -2 to +2. The outliers test yielded a significance value of p<0.001, indicating that no observations are considered outliers. Furthermore, the multicollinearity test revealed that the determinant of the sample covariance matrix value is 2.103. This value is far from zero, allowing us to conclude that there are no multicollinearity or singularity problems in the analyzed data.
3.3 Data analysis
The analytical method used is correlation analysis to determine the relationship between variables that influence the performance of inter-island transportation services. The correlation formulation can be seen in the research of Humang et al. [32], which analyzes the factors that influence the distribution of goods in the Indonesian archipelago.
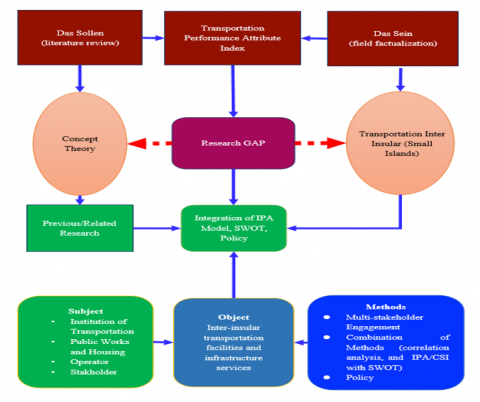
Figure 2. Conceptual framework analysis
IPA [33] and customer satisfaction index (CSI) are analyzed, aiming to map the attributes of transportation performance indicators into a Cartesian diagram consisting of four quadrants and the satisfaction of service users [34]. The formulation of this analysis can be seen in the research of Rodriguez-Valencia et al. [35] and Shaaban and Khalil [36]. Then, a combination of SWOT analysis [37] and problem-based policy analysis was used to develop policy action plans [38].
The combination of analysis of each stage, the relationship between the concepts and theories used, subjects, objects, and integration of methods can be seen in the conceptual framework in Figure 2.
4.1 Transportation performance and community economic systems
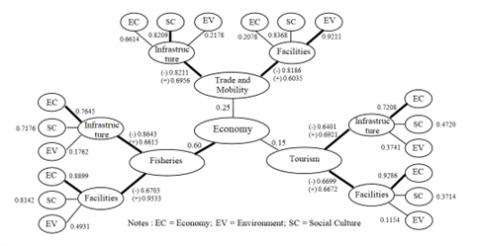
The relationship between the variables of transportation performance indicators in the economic system of small island communities consists of supporting trade and mobility activities (Y1), fisheries (Y2) and tourism (Y3) to the elements of the inter-island transportation system, namely facilities (X1) and infrastructure (X2), as well as the variable sustainability attributes of economic, socio-cultural and environmental indicators. The results of the correlation analysis method show the correlation between one performance indicator variable and other variables in a series of transportation systems, as shown in Figure 3.
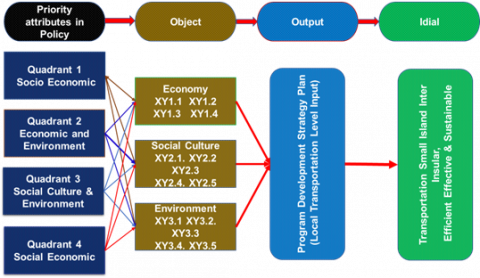
There are three economic activities of the islands that are supported by island sea transportation, namely, trade and community mobility, community fisheries activities and tourism. Sea transportation has two main system elements, namely ships as a means of transportation and ports and docks as a transportation infrastructure connectivity node. Transportation operational performance includes three aspects of analysis, namely, economic indicators (XY11 = on time, XY12 = smooth and fast, XY13 = integrity, XY14 = efficient); socio-cultural indicators (XY21 = easy to reach, XY22 = capacity, XY23 = accessibility, XY24 = regular, XY25 = tariff) and environmental indicators (XY31 = impact of pollution, XY32 = safety, XY33 = comfort, XY34 = orderly and XY35 = security).
Most of the 94% of the people in the Makassar Islands Region depend on the fisheries sector, especially in the Barrang Caddi and Barrang Lompo villages. The contribution of facilities and infrastructure to supporting the fisheries and tourism economy is excellent. The correlation of the economic contribution of the fisheries sector is 0.7645 for infrastructure and 0.8899 for transportation facilities. There are 1,473 vessels supporting economic activities, the majority of which are fishing vessels; the others are for trade and community mobility. Another potential is tourism, recording 6,558 tourists in 2020, and increasing to 14,326 in 2022.
Figure 3. Relationship between transportation facilities and infrastructure and the community economy
Notes: Value categories according to Fleiss (1981) are K < 0.40 poor agreement, 0.40 < K < 0.75 good agreement, and K > 0.75 excellent agreement.
4.2 Performance of the inter-island transport system
4.2.1 Trade and mobility
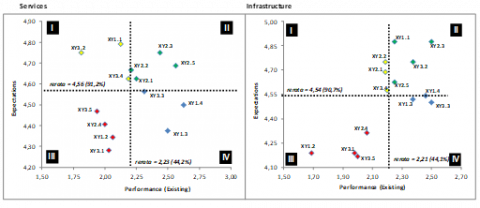
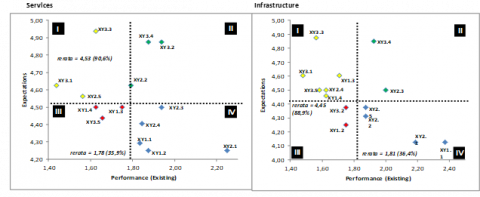
The movement of the community for trade and daily mobility for work, social activities, and school, which occurs every day, is very dependent on the availability of regular ships. Based on Figure 4, the average community assessment of the performance of transportation facility services shows that the indicator attributes in Quadrant I are safety, order, and timeliness. This is in line with the conditions of ship accidents, disorderly passengers on the ship, and frequent delays in departure and arrival times because ships often experience disruptions or are not allowed to sail.
While in quadrant II, indicators that are considered good enough and need to be maintained are accessibility, capacity, tariffs, and ease of achievement. Services at the dock have not been well managed, so there is often chaos when passengers get on and off.
The capacity of some piers is very low, unable to accommodate large numbers of passengers. Likewise, the level of achievement is still not good because of the long time and high costs incurred by users in accessing the pier from the surrounding small islands. The average performance level of existing conditions is only 2.21, or 44.2%, while service user expectations that are considered important reach 4.56, or 91.2%. The performance gap is quite high considering the fulfilment of community needs in the Makassar archipelago region, which is highly dependent on sea transportation.
Figure 4. Quadrant map of trade and mobility activities
4.2.2 Fishing activities
Fisheries activities are found in almost all island clusters, with the center of fisheries activities on Langkai Island. The preferences of fisheries business actors show that the indicators that are not good (quadrant I) are convenience, security, pollution impact, integration, efficiency, and order. Fisheries activities are still carried out traditionally due to limited dock facilities and supporting facilities for fisheries activities.
Figure 5. Quadrant map of fishing activities
Fishery products are distributed ship-to-ship. This condition has caused fisheries business actors to assess that most performance indicators still need to be improved. Fishing vessel facilities basically do not provide a sense of comfort to the crew. In addition, water pollution occurs because there are still many crew members who throw garbage into the sea. The capacity of the vessels is still perceived to be small, so the ability to distribute fish catches is not great. Meanwhile, indicators that are considered good enough (quadrant II) are safety and orderliness. The average performance level of existing conditions according to service users is only 1.80, or 35.9%, while importance or expectations can reach 4.53, or 90.6% in Figure 5. Thus, the ratio of importance to performance, or IPA index, is still far from expected.
The performance of maritime transportation significantly influences community accessibility. Well-established transportation facilities can facilitate fishermen in reaching potential fishing locations and ensure a smooth logistics supply. Similarly, prompt distribution of fishery products to both local and export markets is vital. Ultimately, this supports local economic development in the fisheries sector through job creation and increased income for coastal communities.
4.2.3 Tourism activities
The tourism competitiveness of a destination is the ability of the place to optimize its attractiveness to residents and non-residents, to provide quality, innovative, and attractive tourism services to consumers, and to gain market share in domestic and global markets while ensuring that the available resources supporting tourism are utilized efficiently and sustainably.
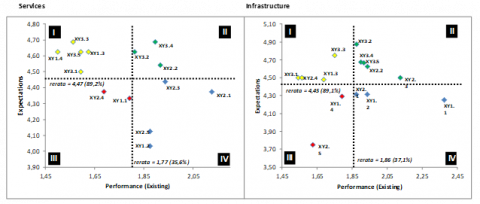
Tourism activities are mostly carried out by domestic tourists with the main destination of Samalona Island, using non-regular vessels, namely speed boats with a capacity of 8–10 people and small yachts. The mapping results in Figure 6 indicate that indicators located in Quadrant I are comfort, safety, pollution impact, integration, and efficiency. The use of speedboats is still considered inappropriate for tourist facilities in terms of comfort and safety.
Regarding pollution indicators, there is still garbage disposal by ship owners or other tourists. Service users want the existence of regular ships that are integrated with further modes to support tourist activities so that tourist trips are more efficient in terms of time and cost. Performance gaps trigger a decline in travellers.
The movement of people for tourism activities predominantly occurs on Fridays and Sundays, depending on the availability of regular or charter ship service facilities. The results of the IPA analysis are plotted in Figure 6. The average community rating of the performance of transportation facility services shows that the attributes in Quadrant I are signs of safety, order, and timeliness. This is in line with the conditions of ship accidents, disorderly passengers on the ship, and frequent delays in departure and arrival times because ships often experience disruptions or are not allowed to sail.
Whereas in quadrant II, indicators that are considered good enough and need to be maintained are accessibility, capacity, tariffs, and ease of achievement. The average performance level of existing conditions is only 2.21, or 44.2%, while the expectations of service users who are considered important reach 4.56, or 91.2%. The performance gap is very high considering the fulfilment of community needs in the Makassar archipelago region, which is very dependent on sea transportation.
The performance of sea transportation in island regions plays a pivotal role in shaping the tourism sector and local communities. Efficient transportation facilities not only enhance tourist accessibility to remote tourism destinations but also support the development of tourism infrastructure such as ports and local transportation facilities. In addition to creating jobs in the transportation sector, the increased influx of tourists stimulates local economic growth through service industries such as accommodation, restaurants, and tour guides. However, it is important to note that the surge in tourist activities may potentially have negative impacts, such as increased environmental pressure and social changes. Therefore, the focus should be on the development of sustainable maritime transportation and wise tourism management strategies to maintain a balance between tourism growth and the preservation of the sustainability of local communities and the environment.
Figure 6. Tourism activity quadrant map
4.2.4 Level of services for inter-island transport
The only public transportation in the Makassar Island group is inter-island sea transportation, which is the lifeblood of the economy. The absence of other transportation alternatives causes economic activity to be paralysed if the ship does not operate due to operational and weather disturbances. This condition causes the low economic competitiveness of the Makassar Spermonde community amidst the many potential economic resources owned in the form of fisheries and tourism, which have not been optimally utilized for the welfare of the community.
The satisfaction index of sea transportation service users in the Makassar Island cluster shows an average CSI value of 43.5% (not satisfied). The average value of satisfaction with the facility service network (ships) is 43.6%, and satisfaction with the infrastructure service network (docks) is 43.3%. Based on the location of the island cluster for each economic activity, the highest CSI value is found in cluster C and the lowest in cluster A, but overall, the value is 38.8%–49.9%, or dissatisfied.
The dissatisfaction of sea transportation service users in the Makassar archipelago is a consequence of the low performance of the current sea transportation system services. This is reflected in the community preferences for assessing the performance of sea transportation services on each island shown in Table 3. In the cluster of islands in Cluster A, the performance of transportation services on all islands for trade and mobility activities, tourism activities, and fisheries activities has a value of "less".
Service performance on island clusters in Cluster B for all types of activities also has a value of "less." The island clusters in Cluster C for trade and mobility activities have a score of "sufficient," while the other activities are "deficient." The island clusters in Cluster D generally score "less," although Lumu-lumu island in particular tends to be "sufficient," while Lanjukang island has the lowest score of "very less." As the outermost island in Makassar Spermonde, Lanjukang Island is not served by regular sea transportation.
Table 3. Level of services for inter-island transport
|
Indicator Attributes |
Performance (X) |
Important (Y) |
Satisfaction (X/Y) 100% |
|
Economy |
2,00 |
4.56 |
43,86 |
|
Social culture |
1,92 |
4,50 |
42,66 |
|
Environment |
1,87 |
4,62 |
40,48 |
|
Justice and socio-economic |
1,90 |
4,55 |
41,76 |
|
Sustainable development |
1,93 |
4,57 |
42,23 |
|
Societal sustainability |
1,90 |
4,57 |
41,58 |
|
Average value |
1,92 |
4,56 |
42,11 |
Notes: (X/Y) < 64% = Very Low; 64% < (X/Y) < 71% = Low; 71% < (X/Y) < 77% = Concerning; 77% < (X/Y) < 80% = Borderline; 80% < (X/Y) < 84% = Good; 84% < (X/Y) < 87% = Very Good; (X/Y) > 87% = Excellent.
The low performance of sea transportation services has implications for the economic and socio-cultural aspects of the Makassar Spermonde Islands community. The fact that the performance of sea transportation services is relatively poor has an impact on economic growth and uneven development on the islands. Business opportunities and investment interest are limited. The potential of marine resources (fisheries and maritime tourism) is not maximally explored to provide welfare for island communities.
These findings are in line with the study of Roberts and Lewis [16], who explains that low service performance is a measure of the condition and quality of the transportation system and has an impact on the limited competitiveness of the islands. The dependence between small islands on the mainland (Makassar City) is higher due to the inability of island communities to be as competitive as people on the mainland of Makassar. This is in line with the research of Sihaloho and Jinca [10] and Siswoyo [15] in Maluku. Limited accessibility to basic facilities such as education, health, and public services hinders the community's ability to obtain the basic services that are the right of every citizen. This is due to the uncertainty of sea transportation services, one of the causes of which is inappropriate government policies.
Another finding related to the performance of transportation services in the island cluster is that there is a significant relationship between the socio-economic aspects of the community, which is a function of income levels, and performance and motivational needs described in Maslow's Theory. The level of community welfare in the Islands region is 75% at the "not prosperous" and "pre-prosperous" levels. Communities with these characteristics are basically at the level of fulfilling psychological and security needs, as well as social needs. Performance indicators that are of concern to people with these characteristics are how to provide transportation facilities and infrastructure that have sufficient capacity, are easy to reach, have sufficient accessibility, affordable rates, are efficient, and are safe. The relationship between transportation performance, welfare hierarchy, and "Maslow" motivation in the Makassar Spermonde Island cluster community.
Based on the research findings described earlier, it is necessary to have a policy priority strategy for action to develop marine transportation facilities and infrastructure. Development of a sea transportation system policy concept that is able to improve urgent indicators to be improved to accelerate the development of marine transportation infrastructure. Through increased investment in sea transportation infrastructure, equitable development on each island, optimisation of infrastructure in accordance with demand, and coordination of government, operators, and service users, indicators that need priority improvement for infrastructure are smoth and fast, reguler, rates (tariff), impact of pollution, and security. Performance improvement for facilities is on time, accessibility, comfort, and order.
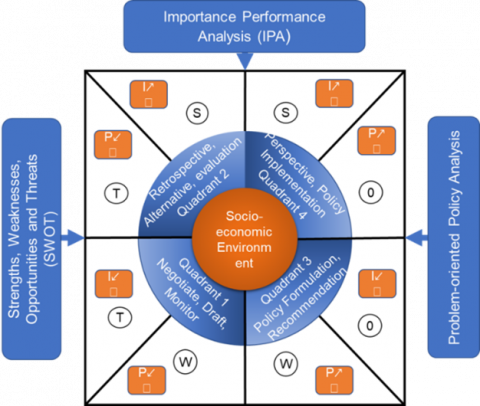
5.1 IPAp
The form of the analysis model is constructed solidly from the IPA, SWOT, and problem-oriented policy (POP) models as a function of resistance (weakness and threat) to transportation facilities and infrastructure indicators with sustainability attributes. In this case, importance (I), performance (P), strengths (S), weaknesses (W), opportunities (O), and threats (T).
The policy action direction consists of: i). current policy implementation; ii). retrospective alternative choices; iii). policy formulation, development of ideas by creating ideas for solutions and program indications, and iv). prospective Action Implementation, as shown in Table 4 and Figure 7. Meanwhile, derivatives in form of Development indicators, strategies and program indications for policy actions can be seen in Table 5.
The form of the analysis model is co-constructed from the IPA, SWOT, and POP models to create an analysis model as a function of resistance (weakness and threat) to transportation facilities and infrastructure indicators with sustainability attributes in Figure 8.
Figure 7. Integration of policy models
Figure 8. Policy concept framework
Table 4. Matrix of policy models
|
Model Integration |
Quadrant I |
Quadrant II |
Quadrant III |
Quadrant IV |
|
IPA |
I↙, P↙ |
I↗, P↙ |
P↙, I↗ |
P↗, I↗ |
|
SWOT |
T-W |
S-T |
O-W |
S-O |
|
Policy |
Monitoring |
Evaluation |
Recommendations |
Policy action |
|
Policy strategy |
Negotiate concept |
Retrospective |
Policy formulation |
Perspective |
Notes: I↗ = high importance; I↙ = low importance; P↗ = high performance; P↙ = low performance
Table 5. Development indicators, strategies and program indications
|
Transportation Facilities and Infrastructure Indicators |
Negotiating, Monitoring concepts (Strategy 1) |
Alternative Retrospective, Evaluation S-T (Strategy 2) |
Policy Formulation and Recommendations (Strategy 3) |
Perspective, Policy Implementation (Strategy 4) |
|
Development of Transportation Facilities |
||||
|
Trade and Mobilities |
XY12, XY24, XY31, XY35 |
XY11, XY32, XY34 |
XY13, XY14, XY33 |
XY21, XY22, XY23, XY25 |
|
Fishery |
XY14, XY13, XY35 |
XY25, XY31, XY33 |
XY11, XY12, XY21 XY23, XY24 |
XY22, XY32, XY34 |
|
Tourism |
XY11, XY24, |
XY13, XY14, XY25, XY31, XY23 |
XY12, XY21, XY33, XY35 |
XY22, XY32, XY34 |
|
Development of Transportation Infrastructure |
||||
|
Trade and Mobilities |
XY12, XY24, XY31, XY35 |
XY21, XY22, XY34 |
XY13, XY33, |
XY11, XY14, XY23 XY25, XY32 |
|
Fishery |
XY12, XY32 |
XY13, XY14, XY24, XY31, XY33, XY35 |
XY11, XY21, XY22, XY25, XY34 |
XY23, XY34 |
|
Tourism |
XY14, XY25 |
XY13, XY24, XY31, XY33 |
XY11, XY12, XY21 |
XY22, XY23, XY32, XY34, XY35 |
|
Priority Aspects |
Social |
Eco-Environment |
Soc- Environment |
Soc-Economy |
|
Island Group of Policy Actions |
Kodingareng, Barrang, Lompo |
Barrang, Lompo Lae-Lae |
Kodingareng, Barrang, Lompo |
Barrang, Caddi |
The role of inter-island transportation facilities and infrastructure is excellent, particularly in its influence on fisheries and tourism economic activities (correlation R = 0.7645–0.8899). The availability of transportation facilities and infrastructure has a more pronounced impact on social activities, supporting trade activities, and inter-island mobility. The contribution of inter-island transport to environmental aspects is still low and negative (R = 0.1154–0.3742). The performance of inter-island transportation in supporting community activities for all areas of the island group is very low (satisfaction level 42.11%). There is still a gap between demand (importance) and supply (performance). Indicators that require management priorities for infrastructure and facilities are integration, efficiency, marine pollution, and comfort. The priorities for handling transportation facilities are related to safety, accessibility, rates, and punctuality factors. Management priorities for transportation infrastructure are ease of access, capacity, orderliness, and security.
The implications of this model should be operationalized with the principle of bottom-up planning according to the demand and interests of transportation services in the island community. Several indicators need to be reviewed before they are decided to become development objects, especially those that are high-performing but not too important for the community.
There are four practical implications of the model output in operational planning and development of transportation in archipelago areas, namely: 1) If importance (I) and performance (P) are low, then the transformation and compromise of variable suitability between the importance and performance of transportation services are carried out. 2) If importance (I) is higher than performance (P), then negotiations are held to discuss the concept of adjustment and cooperation in solving problems and choosing a priority scale. 3) If importance (I) is lower than performance (P), then policy formulation is carried out and the development of ideas is implemented by operational efficiency. 4) If importance (I) and performance (P) are both high, then it is more prospective, so it is necessary to implement actions, maintain variables in this condition, and carry out assignment actions and strategies according to the interests and achievements of the actions.
The contribution of this model can be used in policy formulation and revision of local transportation planning (Tatralok) to increase the role of inter-island transportation in supporting the economy of island regions.
Table A1. Description of transportation performance indicators
|
Factor |
Indicators |
Code |
Description |
|
Economic Attributes (XY1) |
On time |
XY11 |
Departure, arrival and waiting times |
|
Smoothness |
XY12 |
Travel time, delays, limited carrying capacity and discipline |
|
|
Integrity |
XY13 |
Inter & intermodal integration, ease of switching modes |
|
|
Efficient |
XY14 |
Community benefits versus costs |
|
|
Social Culture Attributes (XY2) |
Easy to reach |
XY21 |
Ease of port access, cost and time efficiency |
|
Capacity |
XY22 |
Service network and infrastructure, ratio of cargo volume to fleet capacity |
|
|
Accessibility |
XY23 |
Ratio of service routes to number of islands |
|
|
Regular |
XY24 |
Schedule conformity, regularity, demand supply and management management |
|
|
Affordable Rates |
XY25 |
Appropriateness of tariffs and people's purchasing power |
|
|
Environment Attributes (XY3) |
Impact of pollution |
XY31 |
Pollution that occurs (exhaust, water, noise, vibration) |
|
Safety |
XY32 |
Accident rate of infrastructure and facilities to movement, |
|
|
Comfort |
XY33 |
Comfort on board and in port, availability and quality of facilities |
|
|
Orderly |
XY34 |
Number of violations, compliance with laws and regulations |
|
|
Security |
XY35 |
Disruptions on board and in port |
[1] Jinca, M.Y. (1994). Das Interinsularepersonen Seeverkhers System und seine Beziehungen Zur Regionalentewicklung in Ost-Indonesia. Verlag Köster, Berlin.
[2] Ralahalu, K.A., Jinca, M.Y., Siahaan, L.D., Sihaloho, A. (2013). Pembangunan transportasi kepulauan di Indonesial. Surabaya (in Indonesian). https://perpus.ivet.ac.id/index.php?p=show_detail&id=1028, accessed March 2, 2022.
[3] Taormina, R.J., Gao, J.H. (2013). Maslow and the motivation hierarchy: Measuring satisfaction of the needs. The American Journal of Psychology, 126(2): 155-177. https://doi.org/10.5406/amerjpsyc.126.2.0155
[4] Angelopoulos, J., Vitsounis, T., Paflioti, P., Chlomoudis, C., Tsmourgelis, I. (2021). Reflecting economic activity through ports: The case of Australia. Maritime Transport Research, 2: 100021. https://doi.org/10.1016/j.martra.2021.100021
[5] Moura, T.G.Z., Chen, Z.L., Garcia-Alonso, L. (2019). Spatial interaction effects on inland distribution of maritime flows. Transportation Research Part A: Policy and Practice, 128: 1-10. https://doi.org/10.1016/j.tra.2019.07.012
[6] Kambu, Z., Jinca, M.Y., Pallu, M.S., Ramli, M.I. (2022). Meta synthesis of community participation model on trans-Paopua Road development. Civil Engineeering Journal, 8(11): 2476-289. http://doi.org/10.28991/CEJ-2022-08-11-08
[7] Xi, Y.L., Miller, E.J. (2019). Accessibility: definitions, measurement & implications for transportation planning analysis. Transportation Research Procedia, 41: 159-161. https://doi.org/10.1016/j.trpro.2019.09.029
[8] Boviatsis, M., Vlachos, G. (2023). Proactive steps towards sustainable shipping: Assessing maritime accidents of the past to prevent similar incidents in the future. International Journal of Transport Development and Integration, 7(1): 13-20. https://doi.org/10.18280/ijtdi.070102
[9] Sulastriani R., Jinca, M.Y, Misliah. (2022). Development of Sea Transportation Development for the Islands of the Makassar Municipality. IOSR Journal of Mechanical and Civil Engineering (IOSR-JMCE), 19(2): 31-36. https://doi.org/10.9790/1684-1902023136
[10] Sihaloho, A., Jinca, M.Y. (2013). Performance of trans Maluku crossing transportation in supporting socio-economic activities of the community. Transportation Research Report, 24(4): 327-334. https://doi.org/10.25104/warlit.v24i4.1015
[11] Aghajanzadeh, M., Aghabayk, K., Esmailpour, J., De Gruyter, C. (2022). Importance–Performance Analysis (IPA) of metro service attributes during the COVID-19 pandemic. Case studies on transport policy, 10(3): 1661-1672. https://doi.org/10.1016/j.cstp.2022.06.005
[12] Sumrit, D., Sowijit, K. (2023). Winning customer satisfaction toward omnichannel logistics service quality based on an integrated importance-performance analysis and three-factor theory: Insight from Thailand. Asia Pacific Management Review, 28(4): 531-543. https://doi.org/10.1016/j.apmrv.2023.03.003
[13] Kapros, S., Panou, C. (2007). Chapter 10 Coastal shipping and intermodality in Greece: The weak link. Research in Transportation Economics, 21: 323-342. https://doi.org/10.1016/S0739-8859(07)21010-8
[14] Yuliani, A., Lestari, E.M. (2014). Evaluation of sea transportation services to support tourism in the West Nusa Tenggara Region. Warta Penelitian Perhubungan, 26(4): 241-252.
[15] Siswoyo, B. (2016). Public Perception of safety equipment for maritime ships and crossings in Maluku Province. Warta Penelitian Perhubungan, 28(2): 146-156.
[16] Pratiwi, R. (2019). Evaluation of ship service performance at the port of Makassar. Doctoral dissertation. Universitas Hasanuddin.
[17] Firmansyah, S., Anwar, M. R., Pujiraharjo, A. (2016). Study of Makassar port development in supporting loading and unloading flows at Makassar port. Engineering Journal Civil, 10(1): 10-20.
[18] Lekakou, M.B. (2007). Chapter 8 The eternal conundrum of Greek coastal shipping. Research in transportation economics, 21: 257-296. https://doi.org/10.1016/S0739-8859(07)21008-X
[19] Park, J.S., Seo, Y.J., Ha, M.H. (2019). The role of maritime, land, and air transportation in economic growth: Panel evidence from OECD and non-OECD countries. Research in Transportation Economics, 78: 100765. https://doi.org/10.1016/j.retrec.2019.100765
[20] Roberts, S., Lewis-Cameron, A. (2010). 1 - Small island developing states: Issues and prospects. Marketing Island Destinations: Concepts and cases, 1-10. https://doi.org/10.1016/B978-0-12-384909-0.00001-5
[21] Lewis-Cameron, A., Roberts, S. (2010). The competitive island destination. In: Lewis-Cameron, A., Roberts, S. (eds.). Marketing Island Destinations, Routledge, pp. 179-185. https://doi.org/10.1016/B978-0-12-384909-0.00013-1
[22] Konstantinus, A. (2021). Short sea shipping: Stated intentions of shipowners and operators in the Southern Africa Development Community Region. Maritime Transport Research, 2: 100015. https://doi.org/10.1016/j.martra.2021.100015
[23] Ishiguro, K., Inamura, H. (2005). Identification and elimination of barriers in the operations and management of maritime transportation. Research in Transportation Economics, 13: 337-368. https://doi.org/10.1016/S0739-8859(05)13015-7
[24] Wang, W., Wu, Y.W. (2021). Is uncertainty always bad for the performance of transportation systems?. Communications in Transportation Research, 1: 100021. https://doi.org/10.1016/j.commtr.2021.100021
[25] Lakshmanan, T.R. (2011). The broader economic consequences of transport infrastructure investments. Journal of transport geography, 19(1): 1-12. https://doi.org/10.1016/j.jtrangeo.2010.01.001
[26] Burns, M.G. (2021). Transportation safety and security. International Encyclopedia of Transportation, pp. 47-52. https://doi.org/10.1016/B978-0-08-102671-7.10217-9
[27] Faturachman, D., Mustafa, S. (2012). Performance of safety sea transportation. Procedia - Social and Behavioral Sciences, 57: 368-372. https://doi.org/10.1016/j.sbspro.2012.09.1199
[28] Pourramazani, H., Garcia, J.L.M. (2023). Evaluating urban transportation accessibility: A Systematic review of access dimensions and indicators. International Journal of Transport Development and Integration, 7(4): 331-339. https://doi.org/10.18280/ijtdi.070407
[29] Tuan, V.A., Van Truong, N., Tetsuo, S., An, N.N. (2022). Public transport service quality: Policy prioritization strategy in the importance-performance analysis and the three-factor theory frameworks. Transportation Research Part A: Policy and Practice, 166: 118-134. https://doi.org/10.1016/j.tra.2022.10.006
[30] de Oliveira, H.C., You, J., Coelho, A.P. (2021). Governing coalitions and key performance indicators of port governance. Maritime Transport Research, 2: 100023. https://doi.org/10.1016/j.martra.2021.100023
[31] Jinca, M.Y., Humang, W.P. (2023). Perencanaan dan Pengembangan Transportasi Wilayah Kepulauan. Nas Media Pustaka. https://edeposit.perpusnas.go.id/collection/perencanaan-dan-pengembangan-transportasi-wilayah-kepulauan-sumber-elektronis/113475.
[32] Humang, W.P., Hadiwardoyo, S.P. (2019). Factors influencing the integration of freight distribution networks in the Indonesian archipelago: A structural equation modeling approach. Advances in Science, Technology and Engineering Systems, 4(3): 278-286. https://doi.org/10.25046/aj040335
[33] Boley, B.B., McGehee, N.G., Hammett, A.T. (2017). Importance-performance analysis (IPA) of sustainable tourism initiatives: The resident perspective. Tourism Management, 58: 66-77. https://doi.org/10.1016/j.tourman.2016.10.002
[34] Paddeu, D., Fancello, G., Fadda, P. (2017). An experimental customer satisfaction index to evaluate the performance of city logistics services. Transport, 32(3): 262-271. https://doi.org/10.3846/16484142.2016.1146998
[35] Rodriguez-Valencia, A., Rosas-Satizabal, D., Paris, D. (2019). Importance-performance analysis in public transportation: Methodological revision for practical implementation. Transportation Research Record, 2673(2): 710-723. https://doi.org/10.1177/0361198118825125
[36] Shaaban, K., Khalil, R.F. (2013). Investigating the customer satisfaction of the bus service in Qatar. Procedia - Social and Behavioral Sciences, 104: 865-874. https://doi.org/10.1016/j.sbspro.2013.11.181
[37] Bugheanu, A.M. (2015). SWOT analysis of public transport system in Bucharest. Management Research and Practice, 7(1): 14-31.
[38] Dunn, W.N. (2018). Public Policy Analysis. Routledge, New York, USA. https://doi.org/10.4324/9781315663012