Imam Basuki![]()
© 2023 IIETA. This article is published by IIETA and is licensed under the CC BY 4.0 license (http://creativecommons.org/licenses/by/4.0/).
OPEN ACCESS
The excessive number of passengers at Adisutjipto Airport, Yogyakarta, Indonesia over the airport capacity has urged the government to relocate the airport to Yogyakarta International Airport (YIA) in Kulon Progo, which is located in two hour’s drive from the city of Yogyakarta, Indonesia. Such great distance certainly necessitates a mode of transportation to enable the movement of passengers to and from YIA. On this basis, this research aims to create an intermodal passenger transport planning, including routes, the necessary number of ways and financial feasibility for ease of transport to and from the new airport. This research used transportation planning method based on route analysis of potential transportation demand. The study was conducted by an interview survey of 1,000 respondents of air transport passengers at Adisutjipto Airport. The results of the survey were analysed in terms of the potential demand, trip distribution, route network and transportation need and financial feasibility. The study revealed that there were two provinces with high potential demand for airport development, namely the Province of the Special Region of Yogyakarta (72.80%) and the province of central Java (27.20%). It was predicted that the airport will serve 5,070 number of passengers/day. Eight routes were found to be very potential and will require 46 vehicles to serve the number of passengers, including the spare. Financial feasibility shows a net benefit value (NPV) of 128.397,296,609 (NPV>0), financial interest rate return of 18.23% (FIRR > bank interest) and benefit-cost ratio (BCR) 1.4625 (BCR>1), indicating that this planning project is feasible to implement.
financial feasibility, intermodal passenger transport, potential transportation demand, route network, trip distribution, Yogyakarta International Airport
Yogyakarta International Airport (YIA) in Kulon Progo, Indonesia is a new airport projected to replace Yogyakarta’s Adisutjipto International Airport. The location between the two airports is more than 50 km, a 2-h drive from Yogyakarta, Indonesia. Such a great distance certainly requires a mode of transportation to enable the movement of passengers to and from YIA.
The airport is one of the centres of activities that generate many trips from cities in the region [1, 2]. This significant passenger movement will burden the existing road network and cause a severe problem if not handled with proper planning. Air transportation services and economic development interact through a series of mutual causality feedback relationships. Air transportation creates more comprehensive socio-economic benefits through its potential to enable certain types of activities in a local economy [3-6].
The construction of airports also influences changes in movement patterns, investment development patterns and transportation modes. It is necessary to plan the public transport that serves this need to support the construction of a new airport. Integrated modes of transportation are transportation services between cities between provinces, transportation between cities within regions and urban transport. The development and management of transportation systems are significant in economic and social development related to transportation systems, such as safety, cost and quality, which require practical solutions and improvements [7, 8]. To cater the current demand, the airport transfer from Adisutjipto Airport, Yogyakarta, Indonesia to The YIA in Kulon Progo was carried out in April 2020, during the COVID-19 pandemic, when the number of passengers and flights decreased drastically. Private companies provide intermodal transportation at the new airport, but it is scarce. Many offers from illegal vehicle rentals and at high prices. This paper is composed to help recognized stakeholders achieve fair pricing and manage intermodal freight volume requirements. The article updates the need for integrated modes of transportation at YIA in 2023, considering post-COVID-19 conditions, including routes and financially viable fleet size criteria. The year 2023 was chosen because the Indonesian government predicts that life will return to normal in that year. State monetary policies are starting to be directed at the regular sectors, which, in contrast to the condition in 2020-2022, were allocated mostly for handling the spread of corona virus disease 2019 (COVID-19) and the recovery of the national economy. The estimated number of passengers in 2023 was made by assuming the forecast conditions in 2021 [9].
2.1 Intermodal passenger transport
The movements of passengers or freight from an origin to a destination rely on several modes of transportation [10]. Based on the Regulation of the Minister of Transportation of the Republic of Indonesia, intermodal passenger transport refers to a transportation of inter-route network and inter-province city. The transport with the origin, destination and transit terminals are in the form of terminals or other transportation modes, including airports, ports and train stations connected as route networks and or strategic areas or other areas that have the potential for trip generation and travel attraction between cities and between provinces [11]. Transport operations is expected to provide a cost-effective operation following travel requests that are timely and reliable by customer needs and target operators [12, 13]. Therefore, the origin and destination terminals of each route were determined by considering that: (a) estimated transportation needs to and from the node to the city outside the rural location of the node is at least 5 years; (b) the transportation node is part of the national node.
Intermodal passenger transport service organized with the following characteristics: (a) explicitly transporting passenger movement from one mode to another; (b) scheduled; (c) using a bus car.
2.2 Transportation network system
This transportation network system includes: (a) transportation services consisting of several modes of transportation, including the ways of roads, railways and air modes; (b) the transportation network system under study specifically for the road network; (c) the loading of the leading road network used to predict future traffic loads.
Accessibility analysis in the preparation of a study on the operation of intermodal passenger transport includes road network accessibility and road network mobility.
Connected vehicles on the mode choice and mobility of transportation network demands were modified based on the travel time between each origin-destination (OD) pair caused by the connected car [14].
The analysis of land use patterns can affect the determination of the operation of intermodal passenger transport, which is used to determine the location of the route to get to the airport. Therefore, it is necessary to analyse the following aspects: (a) locations of potential passengers such as residential centres, trade and service centres and others requiring intermodal passenger transport; (b) land use patterns that will help determine the route or location of the supporting facilities for the operation of intermodal passenger transport.
Intermodal passenger transport involves several categories, namely facility network, route network, organization network and demand network [15-17].
2.3 Determination of the zone system and network system
The zoning study area is one of the most widely studied transport planning as the first and the most critical steps [18]. The transportation system for the study area consists of two elements: the zone system and the road network system. The zone system divides the study area into several sections as the minor aggregation level of generating and towing trips. Generally, the zone is the centre of the location or centroid, which is assumed to be the starting or ending point of the journey. A road network consists of roads or links which generally give the attributes of length, capacity and speed of operation. The intersection between streets is called a node which can be in the form of a crossroads (with or without traffic lights), while for the study of regional transportation networks between cities, the node can be a city. In the study of node-point transportation, terminals (buses, trains, airports, ports) can be the beginning and end of a trip using public or non-road-based transportation. Zone system based on the city centre and administrative area boundaries, such as regency/city and provincial borders, consists of internal and external zones [19].
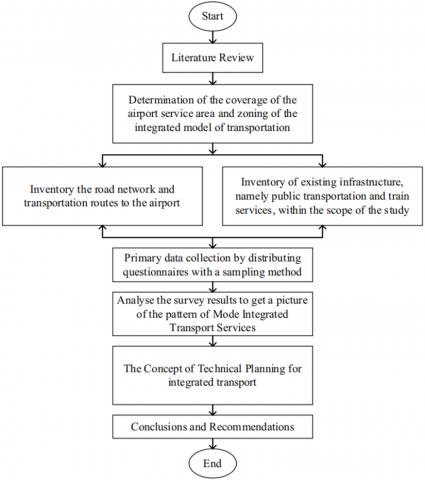
Figure 1. Steps in intermodal passenger transport planning
The intermodal passenger transport planning at YIA was conducted using the following steps (Figure 1). The first step was determining the coverage of the airport service area and zoning of the integrated model of transportation [20]. This step started with preparing a map of the study area, determining the zones or node points to be studied as the origin and destination, and giving the area boundary line, known as the outer boundary line (external cordon line). The basis for zoning consideration is the study area’s determination for survey activities intermodal passenger transport. Determining service zones based on the district/city area’s boundaries are calculated based on the location of the nearest airport. It was conducted by inventory of existing infrastructure, namely public transportation and train services, within the scope of the study, inventory of the road network and transportation routes to the airport, and primary data collection by distributing questionnaires with a sampling method. The next step was analysing the survey results to get a picture of the pattern of mode integrated transport services. The analysis addressed passenger preferences on the condition of transportation services to and from the airport and prediction of potential demand for sure or selected corridors (alternative route determination). After obtaining an overview of travel demand, an integrated transportation technical planning concept was prepared, including networks and routes, headway, frequency, type of vehicle used, tariffs and integrated operational time for each mode. The final stage is to provide recommendations on the fleet needed.
4.1 Yogyakarta International Airport service area coverage
The coverage of the YIA Service Area, as shown in Figure 2, was calculated based on the distance of the district/city road network to the surrounding airports.
Figure 2. Yogyakarta International Airport coverage service area
4.2 Origin-destination survey
Stated preference [21-23] is a data collection technique based on the approach to the opinion of respondents in dealing with various choices. This technique uses an experimental design to create alternative imaginary situations. The step taken was to indicate the respondents’ responds of the real ideal problems. It was aimed at enabling the researchers to exercise control over all factors in the choices offered.
An excellent public transport system was designed and funded to meet potential demand [24]. Plan for intermodal passenger transport planning activities at YIA will involve the participation of stakeholders, including the community (participatory planning), in the overall activity process.
The OD survey is a part of the activities carried out to obtain data on the amount of travel/ movement from the original location to the destination location within the scope of the study area [25, 26].
The OD matrix process was carried out based on the input in passenger travel data. The OD matrices in the analysis was used for the following reasons:
(a) Destination–origin matrix is the most basic information for all existing transportation problem-solving techniques. Various planning policies in the transportation sector were determined at the national and regional scope through the various efforts in developing methods to obtain the destination-origin matrix [27, 28]. The inexpensive way is more beneficial. In this study, the method of establishing the destination–origin. This study used the matrix of the conventional method by distributing questionnaires, and the primary input data in the form of trip OD passenger data. The conventional OD matrices formation method has many advantages from various sides, especially in terms of less time consumption and cost savings.
(b) The main criteria for determining the zone system in this study were the homogeneity and availability of data from the study area. The data were the transportation data (number of vehicles, bus lines, passengers), demographic data, urbanization data and economic data [29]. Therefore, the application in the study area on zone boundaries was based on the administrative boundaries of the district/municipality.
(c) One thing that affected the accuracy of the OD matrices was the amount of data and the location of the survey [30].
4.3 Primary data questionnaire collection
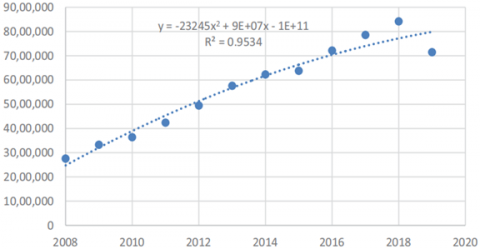
The data from PT Angkasa Pura I (Persero) Yogyakarta indicated the number of passengers departing and arriving in 2008–2019 (Table 1). Using the time series method with a polynomial graph and coefficient of determination of R squared (R2)=0.9534, it resulted in a perfect approximation (Figure 3). The prediction of the number of passenger movements until 2023 (2025) can be seen in Table 1.
Figure 3. Trendline function number of passengers
Table 1. Number of passengers and projections at Yogyakarta Adisutjipto International Airport
|
Year |
Total passenger |
Daily average passenger |
Remarks |
|
2008 |
2,752,421 |
7,541 |
Reality data |
|
2009 |
3,325,442 |
9,111 |
|
|
2010 |
3,635,588 |
9,961 |
|
|
2011 |
4,236,985 |
11,609 |
|
|
2012 |
4,945,446 |
13,550 |
|
|
2013 |
5,757,436 |
15,774 |
|
|
2014 |
6,227,791 |
17,063 |
|
|
2015 |
6,374,762 |
17,466 |
|
|
2016 |
7,211,858 |
19,759 |
|
|
2017 |
7,854,201 |
21,519 |
|
|
2018 |
8,417,098 |
23,061 |
|
|
2019 |
7,143,435 |
19,572 |
|
|
2020 |
8,513,182 |
23,324 |
Prediction |
|
2021 (2023) |
8,688,766 |
23,805 |
Prediction |
|
2022 (2024) |
8,817,860 |
24,159 |
Prediction |
|
2023 (2025) |
8,900,464 |
24,385 |
Prediction |
Several factors were considered in determining the size of the sample. To determine the number of samples, the following is required:
(a) Determination of the population as the object of observation (per day);
(b) Total number of passengers per airport per day (if the object of observation is per day);
(c) Random sampling throughout the day (all hours of service).
The number of respondents were determined on a daily passenger basis of 19,572 (2019) people based on the following Slovin formula [31, 32]:
$n=\frac{N}{1+n \cdot e^2}$ (1)
where, n=number of samples; N=total population; e=margin of error.
The survey on 1,000 airport passengers who used Yogyakarta’s Adisutjipto International Airport asked respondents’ willingness to use transportation to and from YIA in Kulon Progo during operation. Table 2 presents the results of the choice of transportation modes used to and from YIA in 2019.
Out of 1,000 number of respondents, there were 3.08% margins of error.
$e=\sqrt{\frac{\frac{N}{\frac{1000}{N}-1}}{N}}=\sqrt{\frac{\frac{19572}{\frac{1000}{}-1}}{19572}}=0.0308$
Table 2. Selection of transportation modes
|
Modes of transportation |
Heading airport |
Leaving airport |
% average |
||
|
Number |
% |
Number |
% |
||
|
Train |
182 |
18.20 |
177 |
17.70 |
17.95 |
|
Taxi |
260 |
26.00 |
268 |
26.80 |
26.40 |
|
Motorcycle |
74 |
7.40 |
68 |
6.80 |
7.10 |
|
Intermodal passenger transport |
218 |
21.80 |
208 |
20.80 |
21.30 |
|
Private car |
163 |
16.30 |
178 |
17.80 |
17.05 |
|
Public transportation |
63 |
6.30 |
67 |
6.70 |
6.50 |
|
The other |
40 |
4.00 |
34 |
3.40 |
3.70 |
|
Total |
1,000 |
100.00 |
1,000 |
100.00 |
100.00 |
Table 3. Origin and destination of the respondents
|
No |
City name |
Distance (km) |
Number of respondents |
Potential intermodal passenger transport |
|||
|
Number |
% |
Annual |
Daily |
Hour |
|||
|
1 |
Yogyakarta |
43.20 |
454 |
45.40 |
840,221 |
2,302 |
154 |
|
2 |
Sleman |
48.80 |
152 |
15.20 |
281,307 |
771 |
51 |
|
3 |
Purwokerto |
132.00 |
54 |
5.40 |
99,938 |
274 |
18 |
|
4 |
Bantul |
37.20 |
49 |
4.90 |
90,685 |
248 |
17 |
|
5 |
Wates |
13.30 |
39 |
3.90 |
72,178 |
198 |
13 |
|
6 |
Magelang |
75.70 |
67 |
6.70 |
123,997 |
340 |
24 |
|
7 |
Temanggung |
99.00 |
34 |
3.40 |
62,924 |
172 |
11 |
|
8 |
Klaten |
79.70 |
34 |
3.40 |
62,924 |
172 |
11 |
|
9 |
Wonosari |
85.70 |
34 |
3.40 |
62,924 |
172 |
11 |
|
10 |
Kebumen |
61.20 |
30 |
3.00 |
55,521 |
152 |
10 |
|
11 |
Wonosobo |
79.20 |
29 |
2.90 |
53,671 |
147 |
10 |
|
12 |
Purworejo |
27.10 |
24 |
2.40 |
44,417 |
122 |
8 |
|
|
|
|
1,000 |
100.00 |
1,850,707 |
5,070 |
338 |
Table 4. Potential service routes of intermodal passenger transport
|
No |
Route |
Distance (km) |
Coverage area |
Potential passenger |
|
|
A |
B |
||||
|
1 |
YIA – Wates – Ngabean |
43,20 |
Yogyakarta |
154 |
257 |
|
2 |
YIA – Wates – Jombor |
48,80 |
Sleman |
51 |
|
|
3 |
YIA – Wates – condong catur |
52,70 |
Bantul |
17 |
|
|
4 |
YIA – Wates – Giwangan – Klaten |
79,70 |
Wates |
13 |
|
|
5 |
YIA – Bantul – Giwangan – Wonosari |
85,70 |
Klaten |
11 |
|
|
|
|
|
Wonosari |
11 |
|
|
6 |
YIA – Borobudur – Magelang – Temanggung |
99,00 |
Magelang |
24 |
35 |
|
|
|
|
Temanggung |
11 |
|
|
7 |
YIA – Purworejo – Wonosobo |
79,20 |
Purworejo |
4 |
14 |
|
|
|
|
Wonosobo |
10 |
|
|
8 |
YIA – Purworejo – Kebumen – Purwokerto |
132,00 |
Purworejo |
4 |
32 |
|
|
|
|
Kebumen |
10 |
|
|
|
|
|
Purwokerto |
18 |
|
|
Total |
|
|
|
338 |
338 |
Table 3 presents the respondents’ origin and destination and the estimation of potential intermodal passenger transport based on estimates made in 2021 in Table 1.
Passengers in 2021 (2023) are estimated to be 8,688,766 or 23,805 per day, so the potential annual need for intermodal passenger modes is 21.30%×8,688,766=1,850,707 or 5,070 per day.
Determining intermodal passenger transport stops can adjust to the potential centre of activity or other strategic locations (terminals, stations, hotels, shopping centres, tourist sites). Several possible alternative areas for route development exist based on passenger movement data, service area coverage and the criteria mentioned above. Table 4 and Figure 4 recommend potential routes for intermodal passenger transportation based on the demand for passenger movement.
Figure 4. Map route of intermodal passenger transport
Travel time with vehicle speed is an average of 60 km per hour with a time deviation of 10% of travel time. The following formula calculates travel time:
$T T_{A B}=\left(A T_{A B}\right)+\left(\sigma_{A B}\right)+\left(D T_{A B}\right)$ (2)
where, TTAB=travel time from A to B; ATAB=average travel time from A to B with a speed of 60 km/h; σAB=deviation of travel time from A to B (10% from AT); DTAB=vehicle downtime at the terminal between AB (5% from AT).
From Table 4 presents the recommendations for potential routes for intermodal passenger transportation, and thus the travel time can be calculated and presented in Table 5.
Routes 1 to 5 covers the destination of Yogyakarta, Sleman and Bantul agglomeration areas, so that potential passengers were counted into one with the following formula:
$P P_i=\left[\frac{F i}{\sum F}\right] * B$ (3)
The calculation obtained the following number of passengers:
route 1=(49.68/356.62)×257=35.80;
route 2=(56.12/356.62)×257=40.44;
route 3=(60.61/356.62)×257=43.68;
route 4=(91.66/356.62)×257=66.05;
route 5=(98.56/356.62)×257=71.03.
Table 5. Traveling time per route
|
Route |
Traveling time (minutes) |
||||
|
AT |
DT |
σ |
TT |
||
|
C=A/60 |
D=0.05×C |
E=0.1×C |
F=C+D+E |
||
|
1 |
YIA – Wates – Ngabean |
43.20 |
2.16 |
4.32 |
49.68 |
|
2 |
YIA – Wates – Jombor |
48.80 |
2.44 |
4.88 |
56.12 |
|
3 |
YIA – Wates – Condong Catur |
52.70 |
2.64 |
5.27 |
60.61 |
|
4 |
Wates – Giwangan – Klaten |
79.70 |
3.99 |
7.97 |
91.66 |
|
5 |
YIA – Bantul – Giwangan – Wonosari |
85.70 |
4.29 |
8.57 |
98.56 |
|
6 |
YIA – Borobudur – Magelang – Temanggung |
99.00 |
4.95 |
9.90 |
113.85 |
|
7 |
YIA – Purworejo – Wonosobo |
79.20 |
3.96 |
7.92 |
91.08 |
|
8 |
YIA – Purworejo – Kebumen – Purwokerto |
132.00 |
6.60 |
13.20 |
151.80 |
Figure 5. Intermodal passenger transport bus and seat configuration
Table 6. Estimation of bus needs per route
|
Route |
Headway (min) |
Bus needs |
Passenger |
||||
|
Per hour |
1-way |
2-way |
Per route |
Per bus |
|||
|
G |
H=F/G |
I |
|||||
|
1 |
YIA – Wates – Ngabean |
30 |
1.66 |
2 |
4 |
35.80 |
8.95 |
|
2 |
YIA – Wates – Jombor |
30 |
1.87 |
2 |
4 |
40.44 |
10.11 |
|
3 |
YIA – Wates – condong catur |
30 |
2.02 |
2 |
4 |
43.68 |
10.92 |
|
4 |
YIA – Wates – Giwangan – Klaten |
30 |
3.06 |
3 |
6 |
66.05 |
11.01 |
|
5 |
YIA – Bantul – Giwangan – Wonosari |
30 |
3.29 |
3 |
6 |
71.03 |
11.84 |
|
6 |
YIA – Borobudur – Magelang – Temanggung |
30 |
3.80 |
4 |
8 |
35.00 |
4.38 |
|
7 |
YIA – Purworejo – Wonosobo |
60 |
1.52 |
2 |
4 |
14.00 |
3.50 |
|
8 |
YIA – Purworejo – Kebumen – Purwokerto |
60 |
2.53 |
3 |
6 |
32.00 |
5.33 |
|
The number of buses needed |
|
21 |
42 |
||||
|
Real needs of all buses with a spare |
|
|
46 |
||||
Table 7. Estimation of bus needs per route
|
Route |
Vehicle operating costs (IDR/km) |
Number of frequencies |
Kilometres travelled per day |
Operational costs per year (IDR) |
|
|
J |
K |
L=A×K |
M=J×L×365 |
||
|
1 |
YIA – Wates – Ngabean |
9,351 |
10 |
432 |
5,898,175,037 |
|
2 |
YIA – Wates – Jombor |
8,497 |
10 |
488 |
6,053,614,094 |
|
3 |
YIA – Wates – Condong Catur |
8,013 |
10 |
527 |
6,165,124,053 |
|
4 |
Wates – Giwangan – Klaten |
8,264 |
6 |
478 |
8,654,094,743 |
|
5 |
YIA – Bantul – Giwangan – Wonosari |
7,839 |
6 |
514 |
8,827,900,187 |
|
6 |
YIA – Borobudur – Magelang – Temanggung |
7,162 |
6 |
594 |
12,422,847,312 |
|
7 |
YIA – Purworejo – Wonosobo |
8,441 |
6 |
475 |
5,856,015,232 |
|
8 |
YIA – Purworejo – Kebumen – Purwokerto |
7,824 |
4 |
528 |
9,047,419,457 |
|
Total |
|
|
|
|
62.925.190.115 |
Table 8. Existing intermodal passenger transport routes
|
No |
Existing route |
Rates (IDR) |
Distance (km) |
Rates/km (IDR) |
|
1 |
Borobudur |
75,000 |
51.00 |
1,470.59 |
|
2 |
Kebumen |
60,000 |
110.00 |
545.45 |
|
3 |
Magelang |
50,000 |
48.20 |
1,037.34 |
|
4 |
Purworejo |
50,000 |
79.60 |
628.14 |
|
5 |
Temanggung |
70,000 |
70.00 |
1,000.00 |
|
6 |
Wonosari |
50,000 |
35.20 |
1,420.45 |
|
7 |
Wonosobo |
85,000 |
100.00 |
850.00 |
|
8 |
Secang |
60,000 |
58.50 |
1,025.64 |
|
|
|
|
Average |
997.20 |
Table 6 calculates the need for buses by considering the number of prospective passengers and the distance of departure time (headway). Forty-two buses are ready to operate, with a reserve of 10% or four buses. Thus, the total demand for all buses is 46 buses. The maximum number of passengers per bus is 11.84≈12, so the intermodal passenger bus plan with a medium bus capacity is 15 seats. Figure 5 shows a proposed Hino Dutro 130 MDBL luxury medium bus (minibus) with 15 passenger seats with vehicle dimensions having an overall height approx. ±2,709 mm, length of 7,673 mm and width of 2,135 mm.
4.4 The operating costs and tariff determination
Table 7 presents the calculation of the operating costs of each route with different amounts and distances using the Hino Dutro 130 MDBL vehicle.
Existing intermodal passenger transport services at Yogyakarta Adisutjipto International Airport and current rates these presented in Table 8. It can be seen in Table 8 that the tariff rates vary and range from IDR 545.45 up to IDR 1,470.59 per km.
The fare per kilometre currently has an interval of 925.13 (calculated based on the difference between the highest and the lowest). Users’ willingness to rate the service they receive (willingness to pay/WTP) is considered to be on average (997.20). The base rate per km was=997.20, based on which the travel costs and potential income were determined and presented in Table 9.
4.5 Financial feasibility analysis
The basis of investment decisions is the rate of return on investment/investment costs from the number of benefits calculated during the planning period. The feasibility analysis determine the appropriateness of the planned intermodal passenger transport operation.
Standard economic indicators commonly used in financial evaluation include the net present value (NPV), financial internal rate of return (FIRR) and benefit-cost ratio (BCR) [33, 34]. In general, all indicators will provide a scale that compares the value of each proposed alternative’s benefits and costs, but specifically, each indicator has different characteristics.
Table 9. The travel costs and potential income
|
No |
Route |
Coverage area |
Annual potential passenger |
Fare (IDR) |
Income (IDR) |
|
|
WTP |
Fix |
|||||
|
1 |
YIA – Wates – Ngabean |
Yogyakarta |
840,221 |
48,664 |
50,000 |
42,011,050,000 |
|
2 |
YIA – Wates – Jombor |
Sleman |
281,307 |
50,608 |
50,000 |
14,065,350,000 |
|
3 |
YIA – Wates – Condong Catur |
Bantul |
90,685 |
37,096 |
37,000 |
3,355,345,000 |
|
4 |
Wates – Giwangan – Klaten |
Wates |
72,178 |
13,263 |
12,500 |
902,225,000 |
|
5 |
YIA – Bantul – Giwangan – Wonosari |
Klaten |
62,924 |
79,477 |
80,000 |
5,033,920,000 |
|
Wonosari |
62,924 |
85,460 |
85,000 |
5,348,540,000 |
||
|
6 |
YIA – Borobudur – Magelang – Temanggung |
Magelang |
123,997 |
75,488 |
75,000 |
9,299,775,000 |
|
Temanggung |
62,924 |
98,723 |
97,500 |
6,135,090,000 |
||
|
7 |
YIA – Purworejo – Wonosobo |
Purworejo |
22,209 |
27,024 |
25,000 |
555,212,500 |
|
Wonosobo |
53,671 |
78,978 |
75,000 |
4,025,325,000 |
||
|
8 |
YIA – Purworejo – Kebumen – Purwokerto |
Purworejo |
22,209 |
27,024 |
25,000 |
555,212,500 |
|
Kebumen |
55,521 |
61,029 |
60,000 |
3,331,260,000 |
||
|
Purwokerto |
99,938 |
131,631 |
125,000 |
12,492,250,000 |
||
|
Total income |
|
|
|
|
|
107,110,555,000 |
Table 10. The benefit-cost ratio (BCR)
|
Year |
cost |
Revenue |
Discounted factor (DF) 10% |
NPV cost |
NPV revenue |
NPV net benefit |
|
Investment purchase unit |
39,100,000,000 |
|
1.0000 |
39,100,000,000 |
− |
−39,100,000,000 |
|
1 |
62,925,190,115 |
107,110,555,000 |
0.9091 |
57,204,718,286 |
97,373,231,818 |
40,168,513,532 |
|
2 |
62,925,190,115 |
107,110,555,000 |
0.8264 |
52,004,289,351 |
88,521,119,835 |
36,516,830,484 |
|
3 |
62,925,190,115 |
107,110,555,000 |
0.7513 |
47,276,626,683 |
80,473,745,304 |
33,197,118,622 |
|
4 |
62,925,190,115 |
107,110,555,000 |
0.6830 |
42,978,751,530 |
73,157,950,277 |
30,179,198,747 |
|
5 |
62,925,190,115 |
107,110,555,000 |
0.6209 |
39,071,592,300 |
66,507,227,524 |
27,435,635,225 |
|
|
|
|
|
277,635,978,149 |
406,033,274,758 |
128,397,296,609 |
The NPV approach assesses alternative planning’s financial performance by calculating the difference in the benefits and the cost value of each alternative throughout the planning period. The difference in value is then estimated in its present value (the base year of the project) by reducing its value due to an interest rate (discount rate), which is expected to occur throughout the planning period. This NPV indicator can provide information on the amount of the difference (benefit-cost) in each review year and the current value of money. If the NPV value is >0, the alternative planning is financially feasible [35].
Economic growth and inflation in Indonesia in 2019 was 8.15%, so the discount factor is set with a security of 10%.
Table 11. Cumulative present value
|
Year |
CPV cost |
CPV revenue |
|
Investment purchase unit |
39,100,000,000 |
0 |
|
1 |
96,304,718,286 |
97,373,231,818 |
|
2 |
148,309,007,637 |
185,894,351,653 |
|
3 |
195,585,634,319 |
266,368,096,957 |
|
4 |
238,564,385,849 |
339,526,047,234 |
|
5 |
277,635,978,149 |
406,033,274,758 |
FIRR is a value of the interest rate (discount rate) when the present value of the investment benefit is equal to the current value of the investment cost or the amount of the interest rate at a time when the NPV value is 0. If the FIRR value > actual discount rate has expected to occur throughout the planning period, the alternative is feasible [36].
The calculation in Table 10 indicates that the price of the Hino Dutro 130 MDBL vehicle is IDR 850,000,000 per unit, with operation time of 5 years, so its NPV net benefit is=128.397,296,609; BCR is=1.4625; FIRR is=0.9114 for 5 years, which is equivalent to 18.23% per year. With the predicted bank’s interest of 7.0%, the FIRR is > the bank’s interest. Table 11 shows the cumulative present value, which states that the value of cost < revenue or pay back period=1.99 years=2 years. According to Tables 10 and 11, BCR is > 1; NPV net benefit is >0 and FIRR is >bank interest, and thus the proposed vehicle is feasible to implement.
Yogyakarta International Airport (YIA) in Kulon Progo is one of the National Strategic Projects Based on the Regulation of the President of the Republic of Indonesia concerning the Acceleration of Implementation of National Strategic Projects. YIA as a replacement for Yogyakarta Adisutjipto International Airport. The number of passengers at Adisutjipto Airport has exceeded the airport capacity, thus causing plans to relocate the airport to YIA in Kulon Progo.
The airport transfer was conducted in April 2020 during the COVID-19 pandemic when the number of passengers and flights decreased drastically. This paper updates the estimated need for integrated transportation modes at YIA in 2023 by considering post-COVID-19 conditions, including routes and requirements according to the number of fleets.
Estimated number of passengers in 2023 was made based on the assumption on forecasting conditions in 2021. The year 2023 was chosen because the Indonesian government predicts that life will return to normal in that year. The country’s monetary policy also returns to normal, because from 2020 to 2022, the country’s economic policy had to deal with the spread of cOVID-19 and the recovery of the national economy caused by the pandemic.
Based on the coverage area of services from YIA and potential passengers, the two provinces with high demand potential were the Special Region of Yogyakarta (72.80%) and central Java (27.20%). It was predicted that the airport will have to serve number of 5,070 passengers/day.
There were eight potential routes to be developed for intermodal passenger transport routes. The selected mode was Hino Dutro 130 MDBL luxury medium bus (minibus) with 15 passenger seats. In terms of the vehicle dimensions, overall, its height was approx. ±2,709 mm, with the length of 7,673 mm, width of 2,135 mm, with a total 46 transportation requirement to serve these passengers, including reserves. The feasibility study with financial considerations used NPV, BCR and FIRR methods. Financial feasibility shows NPV net benefit of 128,397,296,609 (NPV > 0), FIRR of 18.23% (FIRR > bank interest) and BCR of 1.4625 (BCR > 1), which indicates that this planning project is feasible to implement.
The data we use is part of research funded by a grant from the Ministry of Education, Culture, Research and Technology - Grant of the Directorate of Research and Community Service (DRPM) number B/1436.4/L5/RA.00/2019 and Atma Jaya University Yogyakarta.
[1] Allard, R.F., Moura, F. (2016). The incorporation of passenger connectivity and intermodal considerations in intercity transport planning. Transport Reviews, 36(2): 251-277. https://doi.org/10.1080/01441647.2015.1059379
[2] Mandle, P.B., Mansel, D.M., Coogan, M.A. (2000). Use of public transportation by airport passengers. Transportation Research Record, 1703(1): 83-89. https://doi.org/10.3141/1703-11
[3] Hansman, R.J., Ishutkina, M. (2009). Analysis of the interaction between air transportation and economic activity: a worldwide perspective. ICAT - Reports and Papers.
[4] Donzelli, M. (2010). The effect of low-cost air transportation on the local economy: Evidence from Southern Italy. Journal of Air Transport Management, 16(3): 121-126. https://doi.org/10.1016/j.jairtraman.2009.07.005
[5] Mullen, C., Marsden, G. (2015). Transport, economic competitiveness and competition: A city perspective. Journal of Transport Geography, 49: 1-8. https://doi.org/10.1016/j.jtrangeo.2015.09.009
[6] Cattaneo, M., Malighetti, P., Percoco, M. (2018). The impact of intercontinental air accessibility on local economies: Evidence from the de-hubbing of malpensa airport. Transport Policy, 61: 96-105. https://doi.org/10.1016/j.tranpol.2017.10.009
[7] Mardani, A., Zavadskas, E.K., Khalifah, Z., Jusoh, A., Nor, K.M. (2016). Multiple criteria decision-making techniques in transportation systems: A systematic review of the state of the art literature. Transport, 31(3): 359-385. https://doi.org/10.3846/16484142.2015.1121517
[8] Berg, C.N., Deichmann, U., Liu, Y., Selod, H. (2017). Transport policies and development. The Journal of Development Studies, 53(4): 465-480. https://doi.org/10.1080/00220388.2016.1199857
[9] Government Regulation instead of Law of the Republic of Indonesia Number 1 of 2020. https://peraturan.bpk.go.id/Home/Details/135060/perpu-no-1-tahun-2020.
[10] Rodrigue, J.P., Comtois, C., Slack, B. (2016). Transportation and the spatial structure. The Geography of Transport Systems. https://doi.org/10.4324/9781315618159-2
[11] Minister of Transportation of the Republic of Indonesia. (2019). Regulation of the Minister of Transportation of the Republic of Indonesia Number PM 15 of 2019 concerning the Implementation of Transportation of People with Public Motorized Vehicles in Route. Regulation of the Minister of Transportation of the Republic of Indonesia.
[12] Crainic, T.G., Crainic, T.G. (2014). Intermodal Transportation Department of Industrial Engineering.
[13] Rajabi-Bahaabadi, M., Shariat-Mohaymany, A., Yang, S. (2019). Travel time reliability measures accommodating scheduling preferences of travelers. Transportation Research Record, 2673(4): 708-721. https://doi.org/10.1177/0361198119836980
[14] Minelli, S., Izadpanah, P., Razavi, S. (2015). Evaluation of connected vehicle impact on mobility and mode choice. Journal of Traffic and Transportation Engineering (English edition), 2(5): 301-312. https://doi.org/10.1016/j.jtte.2015.08.002
[15] Luk, J., Olszewski, P. (2003). Integrated public transport in Singapore and Hong Kong. Road & Transport Research, 12(4), 41-51.
[16] Bernal, L.M.M.D. (2016). Basic parameters for the design of intermodal public transport infrastructures. Transportation Research Procedia, 14: 499-508. https://doi.org/10.1016/j.trpro.2016.05.104
[17] Jia, G.L., Ma, R.G., Hu, Z.H. (2019). Review of urban transportation network design problems based on CiteSpace. Mathematical Problems in Engineering, 2019: 5735702. https://doi.org/10.1155/2019/5735702
[18] Martínez, L.M., Viegas, J.M., Silva, E.A. (2007). Zoning decisions in transport planning and their impact on the precision of results. Transportation Research Record, 1994(1): 58-65. https://doi.org/10.3141/1994-08
[19] Draçi, B., Çaro, D., Nikolli, P. (2014). Center-periphery urban territorial dynamics: The case of Durrës Municipality-Albania. Mediterranean Journal of Social Sciences, 5(9): 552-557. http://dx.doi.org/10.5901/mjss.2014.v5n9p552
[20] Paköz, M.Z., Sakarya, A. (2021). Evaluating changes in spatial accessibility to airports in turkey between 2000 and 2018. Transportation Research Record, 2675(10): 425-439. http://dx.doi.org/10.1177/03611981211011649
[21] Wilson, A.G. (1998). Land-use/transport interaction models: Past and future. Journal of Transport Economics and Policy, 32(1): 3-26.
[22] Hensher D.A., Louviere, J.J. (1983). Identifying individual preferences for international air fares: An application of functional measurement theory. Journal of Transport Economics & Policy, 17(3): 225-245.
[23] Petrik, O., de Abreu e Silva, J. Moura, F. (2016). Stated preference surveys in transport demand modeling: disengagement of respondents. Transportation Letters, 8(1): 13–25. https://doi.org/10.1179/1942787515Y.0000000003
[24] Porru, S., Misso, F.E., Pani, F.E. Repetto, C. (2020). Smart mobility and public transport: Opportunities and challenges in rural and urban areas. Journal of Traffic and Transportation Engineering (English Edition), 7(1): 88-97. https://doi.org/10.1016/j.jtte.2019.10.002
[25] Marques Teixeira, F., Derudder, B. (2022). Revealing route bias in air transport data: The case of the Bureau of Transport Statistics (BTS), Origin-Destination Survey (DB1B). Journal of Air Transport Management, 82: 101745. https://doi.org/10.1016/j.jairtraman.2019.101745
[26] Meira, L.H., de Mello, C.A., Castro, Y.M., Oliveira, L.K., de Nascimento, C.O.L. (2020). Measuring social effective speed to improve sustainable mobility policies in developing countries. Transportation Research Part D: Transport and Environment, 78: 102200. https://doi.org/10.1016/j.trd.2019.12.002
[27] Guedes, M.C.M., Oliveira, N., Santiago, S., Smirnov, G., On the evaluation of a public transportation network quality: Criteria validation methodology. Research in Transportation Economics, 36(1): 39-44. https://doi.org/10.1016/j.retrec.2012.03.013
[28] Li, X., Kurths, J., Gao, c., Zhang, J., Wang, Z., Zhang, Z. (2017). A hybrid algorithm for estimating origin–destination flows. IEEE Access, 6: 677-687. https://doi.org/10.1109/AccESS.2017.2774449
[29] Abramović, B. (2013). Creating OD matrix using cordon survey: case study – City of Varaždin. WIT Transactions on the Built Environment, 130: 385-395. https://doi.org/10.2495/UT130301
[30] Zockaie, A., Saberi, M., Saedi, R. (2018). A resource allocation problem to estimate network fundamental diagram in heterogeneous networks: Optimal locating of fixed measurement points and sampling of probe trajectories. Transportation Research Part C: Emerging Technologies, 86: 245-262. https://doi.org/10.1016/j.trc.2017.11.017
[31] Amir, A., Wairara, S., Latief, R., Ainani, A.F. (2019). Analysis of knowledge level of human resources on GMP (Good Manufacturing Practice) in processing and fisheries group in Makassar city. IOP Conference Series: Earth and Environmental Science, 343: 012168. https://doi.org/10.1088/1755-1315/343/1/012168
[32] Kasim, S.N., Abdullah, A., Herry, S. (2019). Strengthening the beef cattle farmer-based organization in partnership system of maiwa breeding center. IOP Conference Series: Earth and Environmental Science, 334: 012053. https://doi.org/10.1088/1755-1315/334/1/012053
[33] Beria, P., Bertolin, A., Grimaldi, R. (2018). Integration between transport models and cost-benefit analysis to support decision-making practices: Two applications in Northern Italy. Advances in Operations Research, 2018: 2806062. https://doi.org/10.1155/2018/2806062
[34] Farida, I., Anasarida, A.A., Susetyaningsih, A., Kurniawati, R. (2019). Revenue components of road construction operations based on economic feasibility analysis. Journal of Physics: Conference Series, 1402: 022017. https://doi.org/10.1088/1742-6596/1402/2/022017
[35] Annema, J.A., Frenken, K., Koopmans, C., Kroesen, M. (2017). Relating cost-benefit analysis results with transport project decisions in the Netherlands. Letters in Spatial and Resource Sciences, 10: 109-127. https://doi.org/10.1007/s12076-016-0175-5
[36] Florio, M., Morretta, V., Willak, W. (2018). Cost-benefit analysis and European Union cohesion Policy: Economic versus financial returns in investment project appraisal. Journal of Benefit-Cost Analysis, 9(1): 147-180. https://doi.org/10.1017/bca.2018.4