Minu Theresa Mathew*![]() | Zeyad Ismail
| Zeyad Ismail![]()
© 2023 IIETA. This article is published by IIETA and is licensed under the CC BY 4.0 license (http://creativecommons.org/licenses/by/4.0/).
OPEN ACCESS
With over half of recent global calamities traceable to seismic activities, including earthquakes, volcanic eruptions, and underwater landslides, and their resultant tsunamis, the importance of efficient disaster management cannot be overstated. This study proposes a novel disaster management system, designed to safeguard both human and animal life, particularly along the Arabian Peninsula's coastal areas, which are vulnerable to tsunamis. Seismic activities result from the release of accumulated tectonic plate pressure over millions of years, giving rise to two primary seismic wave types-pressure waves, which travel at a rate of five kilometers per second, and slower shear waves, moving at one kilometer per second. When such activities occur underwater, the subsequent shockwaves can generate tsunamis, which pose significant threats to coastal regions. The proposed disaster management system leverages pressure sensors and wireless communication technology. Deployed on the ocean floor, these sensors detect changes in water pressure caused by displacement, differentiating between standard ocean waves and those induced by seismic activities. Data from these pressure sensors, in conjunction with tidal gauges, are collected and analyzed by a ground station. Based on the severity of the situation, alerts are then issued to relevant parties. This system aims to provide rapid communication to residents in potential disaster zones, facilitating swift evacuation in response to detected seismic activities. To assess the system's effectiveness, a simulation model was created using Proteus, with the results thoroughly analyzed and evaluated. The system's design and implementation is expected to significantly reduce response times to seismic events and tsunamis, thereby enhancing disaster management along the Arabian Peninsula's coastline.
BPR, tidal gauges, GPS, ATMEGA 16, GSM Module
Tsunamis, colloquially referred to as "harbor waves," are primarily produced by submarine earthquakes, a product of tectonic plate friction. This friction causes a pressure wave to emanate from the earthquake's epicenter [1]. As wave trains, tsunamis maintain intervals of a few minutes to several hours. Despite their destructive potential, the relatively small amplitude of these waves renders them undetectable in an open ocean. However, as the wave nears a harbor or land, the wave's front catches up with the rear, culminating in an elevation of the water column's vertical displacement. This vertical height can range from a few feet to several hundred feet [2], with the devastating onrush of water reaching kilometers inland. Despite the extensive damage tsunamis can inflict, existing early warning systems often fail to provide adequate evacuation time for coastal residents. The recent tsunamis in the Asia-Pacific region, for instance, resulted in numerous fatalities, with the warning systems in place proving insufficient. In light of these shortcomings, there is a critical demand for a system with lower failure probability, capable of providing multi-level monitoring and threat indications. This paper delves into an analysis of the current tectonic activity and regions within the Arabian Peninsula, highlighting the necessity of a disaster warning system for potential tidal surges. A study on the requirements for the design of a disaster management system is undertaken, leading to the implementation of the proposed warning system. Utilizing an ATMEGA328 microcontroller, a Proteus model was created to simulate the warning system, with the subsequent outputs thoroughly analyzed and evaluated. Consideration is given to the already implemented Indian Ocean tsunami warning system, which was found to suffer from grid failure and a delay in response times. Additionally, there was a lack of clarity regarding the expected run-up height and the impact of the anticipated tidal surge. The proposed system addresses these issues by incorporating a tidal surge level indicator, which can alert relevant parties when a hazard is detected. The primary focus of this paper is the implementation of this disaster management system, simulated using an ATMEGA 16 microcontroller [3, 4].
2.1 2004 boxing day tsunami/epicenter: Sumatra Indonesia
A 9.1 magnitude earthquake happened in west coast of Sumatra on December 26 2004 resulting in the huge release of pressure from the tectonic plates creating tsunami [2]. Almost all the countries in the Indian Ocean were affected by the devastating effect. Banda Aceh in Indonesia was hugely affected. The other countries had little warning regarding the advance of the tsunami wave train, owing to the fact that the tremors were not felt in those countries. The tsunami warning system was not installed in the Indian Ocean during the early 2000. Even though, the pacific tsunami warning system was prevalent during those days to detect tsunamis in the Pacific Ocean, the entire system proved to be ineffective in relaying information during the tsunami of 2004. Tsunamis were not common in the Indian Ocean even though the ring of fire region which are tsunami prone regions exists in Pacific Ocean. The western ridge of this ring of fire region extends to the Indian Ocean. The scientists believed the tectonic pressure build up and shifting will only happen once in million years, that’s why the Sumatran tsunami caught everyone by surprise. The tsunami warning system was deployed in Indian Ocean and was fully functional by February 2008. As the study of Bhaskaram et al. [5], there are many draw backs of this warning system in relation to the suitable dispatch of warning to the residents in the tsunami prone areas. In 2012, an 8.4 magnitude earthquake happened in Sumatra Island, the warning was issued in Banda Aceh very near to the epicenter 20 minutes after the first tremors, whereas the warning was issued in the Andaman and Nicobar Islands after eight minutes. These delays can really question the effectiveness of the tsunami warning system installed in these regions. Upon a careful investigation, it was found out that the delay was apparently due to the crash down or failure of the electrical grid connections. Another key requirement is the dispatch of the information between the member nations, which can be vital in the case of emergencies.
2.2 Indian Ocean tsunami warning system: Installed in February 2008
According to Nayak [1], the main requirement of an efficient tsunami warning system is a bottom pressure recorder installed in the sea beds near the fault regions in tsunamigenic zones. These pressure sensors detect the smallest change in water depth for up to 6km and hence detect the tsunami wave trains. Tidal gauges can also be helpful in finding out the displacement of water column, in addition to these preliminary factors fully operational base stations which can dissipate information to the residents can also be employed in these zones. The run-up height acquired by the wave train can be roughly assessed as well as the inundation level of the wave trains. However, the correct assessment is not possible. At the event of an earthquake not all the parameters will be available, but the magnitude, depth and location will be available. In the present TWS, with the available data’s the wave propagation scenarios can be developed and retrieved to find out the possible striking targets [5]. The topography of the coast line and bathymetry of the ocean floors determine the nature of the progressing wave. The wave height is entirely dependent on the ocean bathymetry. Steeper shorelines and shallow waters produce tsunami waves of greater height. The base station or warning centre’s which work throughout the year has certain technical computatory platforms, communication tools, assessment tools etc. The warning centers monitors the water level based upon the information disseminated by different bottom pressure recorders and gauges, and rule out and can accept data depending upon the data provided. Built in software can produce warning if the data’s exceed certain limiting values. Software developed over GIS technology is commonly used in tsunami warning systems, which does acquisition, analysis of the data released from the seismometers, bottom pressure recorders, tidal gauges etc. [1, 6-8].
As seen in the case studies given above the already implemented warning system, has failed in the critical circumstances owing to the delayed response, power outage, no established connection with the grid lines, no effective communication systems etc. Due to these failed implemented models, research on systems to reduce the response time is required.
2.3 Risk assessment in the Arabian Peninsula
According to Al-Amri, Characterization of seismic zones in the Arabian Peninsula. There is a common misconception that the Persian Gulf countries are well protected from water in surges owing to the fact that most of these countries are not in open ocean waters and they are in shallow waters [9]. According to the statistics, there are many minor quakes especially under water quakes in the Persian Gulf regions some of which are cited below [10].
Table 1 and Table 2 show the major under water tremors in the Arabian Peninsula and Persian Gulf region. They show that the region is not entirely protected from the in surges. According to Ambraseys and Melville [11], Ambraseys et al. [12], if there is a major earth quake which happened in the southern ridge of Iran or in the Arabian Sea, it can definitely trigger a tsunami in the Persian Gulf regions. Since most of have shallow waters, the results can be an increase in the amplitude of the resulting tsunamis. Although the above statistics gave the details of minor earth quakes in the recent times, there are earthquakes and the resulting tsunamis in the Arabian Peninsula centuries before. This clearly underlines the fact that the Arabian Peninsula is not devoid of tremors in the mainland or underwater. Since seismic events cannot be predicted using any technology or software’s available, possibility of a major underwater seismic event cannot be completely ruled out. 2004 Indian Ocean Tsunami is an example of the clear and present danger which affected a number of countries not just in the Indian Ocean even in the countries in the African and North American Continent. As shown in Table 1. the tremors are not a red alert level seismic event but these low risk to moderate risk event seismic event occurred along the Arabian Peninsula which requires careful understanding of the seismic activity along the Arabian plate. A detailed understanding of tidal surges which happened along the Arabian Peninsula will give an insight about the possible risks.
In addition to these earth quakes, numerous tsunamis were generated in Arabian Peninsula due to the earth quakes generated in the Arabian Peninsula. A statistical analysis is given below.
Table 3 give’s a statistical analysis on the tidal surges in the Arabian Peninsula which was found out to be significant. In the light of the above analysis a tsunami warning system is a requirement in the Arabian sea. Arabian Gulf region is susceptible to earth quake and the resulting tsunami activities due to the pressure of subduction of Arabian plate under the Eurasian plate, Arabian Gulf regions are prone to high level of seismic effects [12]. As the tectonic plates move past each other the pressure of subduction can create a mega thrust which can result in an earth quake of up to 9.2 magnitudes [10].
Now the question is where should be the warning system installed. To answer this question the coastal bathymetry and detailed study of tectonic plates are required.
Table 1. Major under water quakes in Arabian Peninsula
|
Sl. No. |
Magnitude |
Region |
Latitude |
longitude |
Depth in km |
Date |
Time UTC |
|
1 |
4.9 |
Persian Gulf |
27.32 |
52.95 |
10 |
12-04-2015 |
16:48:16 |
|
2 |
5.6 |
Southern Iran |
26.4 |
53.54 |
5.2 |
30-07-2014 |
01:32:09 |
|
3 |
4.7 |
Southern Iran |
26.45 |
53.49 |
34.7 |
27-04-2014 |
05:34:33 |
Table 2. List of Tsunami’s generated in the Indian Peninsula which impacted the Persian Gulf regions
|
Sl. No. |
Location |
Cause |
Tsunami |
Date |
|
1 |
Kachh region/Indus delta, India |
Earthquake |
yes |
326 BC |
|
2 |
Iranian coast, Arabian gulf |
earthquake |
yes |
April 1-May 9, 1008 |
|
3 |
Dhabhol coast, Maharastra, India |
earthquake |
yes |
1524 AD |
|
4 |
Kachh region, India |
earthquake |
yes |
June 16,1819 |
|
5 |
Kachh region, India |
earthquake |
yes |
June19,1845 |
|
6 |
Makran coast, pakistan |
earthquake |
yes |
November 28,1945 |
Table 3. Statistical analysis of Tsunami’s generated in the Arabian Peninsula
|
Sl. No. |
Location |
Date |
Tsunami |
Remarks of the Event |
|
1 |
Siraf, Iran |
June 17, 978 |
Tsunami, coastal flooding |
2000 people killed, coastal flooding |
|
2 |
Near Bahrain |
November, 1426 |
None recorded |
Earth quake |
|
3 |
Siraf, Iran |
1008 (exact date unknown) |
Tsunami or huge insurge of water |
Fatalities, coastal area flooding |
|
4 |
Bushehr, Iran |
September, 1871 |
Tsunami, coastal flooding |
Fatalities reported, coastal flooding, Al-Tabah event |
|
5 |
Hufuf, Saudi Arabia |
1832 |
None recorded |
earthquake |
|
6 |
Bushehr, Iran |
June 13, 1852 |
None recorded |
earthquake |
|
7 |
Qeshm Island, Iran |
May 19, 1884 |
None recorded |
Felt at saudi |
|
8 |
Qeshm Island, Iran |
November, 27, 2005 |
None recorded |
Felt at dubai, sharjah |
3.1 Requirements
3.1.1 Bottom pressure recorder sensor
The sensors which can be employed to the ocean floor can be of different types like bourdon tube type, vibrating wire type, quartz type, strain gauge type etc. Vibrating wire type of transducer mainly uses the principle of vibrating frequency in relation to the pressure inducted mechanical motion. Capacitance type of transducers can also be employed which uses the capacitance of plates as a factor, which vary with the pressure applied to it. Capacitance type has many structural drawbacks. Strain gauge type of transducer can also be used which uses the principle of whetstone’s bridge. This uses the principle of variation of resistance of a conductor as the change in the mechanical deformation. The strain gauge type sensors can be deployed for long term application which requires increased sensitivity and less drift. A model of 410k-017 digital quartz pressure transducer is used in the pacific tsunami warning system. Model 1635-7H is a newer version of pressure recorders commonly used in pacific tsunami warning systems. A glass sphere is used which holds all the electronic devices and a foam flotation package can be implemented. An anchor can be connected to the shroud and a burn wire release technique can be connected to the shroud.
3.1.2 Tidal gauges
Tidal gauges employed in the warning systems measure the height of the surrounding water level. It is normally equipped with the sensors. Modern tidal gauges use very narrow tubes through which the sound is transmitted. The electronics installed in the device measure the time taken by the reflected sound waves to travel back from the earth’s surface. A group of tidal gauges as in Indian Ocean warning system can disseminate information correctly across the system. The positions of these tidal gauges can be determined by the coastal topography and bathymetry of the Arabian Peninsula.
3.1.3 Coastal bathymetry and topography
Coastal bathymetry of the Arabian Peninsula determines the height of the surge waves resulting from the tsunami. A detailed bathymetric data of the coastal regions are already available using LAS server for bathymetric data or live access to the national virtual ocean data system (NVODS). In order to get a more accurate data a detailed bathymetry of the Arabian Peninsula regions can be conducted, as is done in Indian Ocean regions prior to the installation of Indian Ocean tsunami warning systems. In Indian Ocean warning system two echo sounding systems installed in two different research vehicles were used to acquire the bathymetric data of Deep Ocean as well as the bathymetric data of the coastal regions. A Kongsberg-Maritime EM120 System was installed in a German RV for Indian Ocean warning system, for deep water bathymetry. The sea beam shallow beam 1050 D echo sounder was installed in a research vehicle for the bathymetry of near coastal regions. All of these systems utilize linear transducers in their system. The sonar frequency for the first system is 12khz, with an angular coverage of 150 degree with 191 beams per ping. For the second system covers the sonar frequency of 50khz for medium depth and 180khz for shallow depth with 126 beams per ping. Data acquisition takes place at rv’s fixed speed.
3.2 Model of risk analyzed warning system
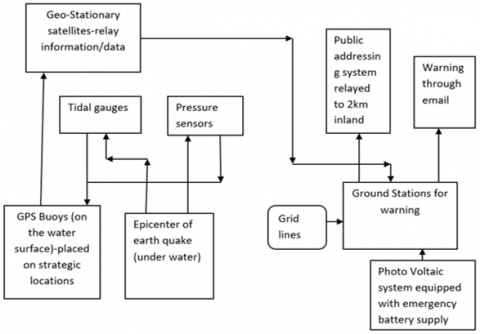
Figure 1 as given below depicts the proposed risk analyzed warning system. The Basic requirements of any warning system to be implemented are the sensors and the Communication System. The proposed model is having Bottom Pressure recorders and Tidal Gauges to sense tidal in surges in the event of a seismic activity. The Communication system consists of a series of warning systems and communication utilizing the buoys and geo stationary satellites. A public addressing systems implemented can effectively warn coastal residents in the event of different threats due to a seismic activity. The figure given below shows a generalized model of the warning system that can be implemented in the Arabian peninsula. The model is cost effective and applicable considering the relative shallow waters of the Arabian Peninsula region.
Figure 1. Generalized model of warning system
The epicenter of any seismic event will result in the tremors which will be dissipated along the entire tectonic plate. As shown in the generalized model above pressure sensors deployed can detect slightest changes in the pressure or volume of the water. The tidal gauges as shown in the figure can be implemented in the coastal area as well in open waters in critical locations. If there is an event of a seismic activity the pressure sensor senses the changes in the pressure or volume of water detecting the seismic activity and send a signal to the Global positioning system equipped buoys where in the location of the seismic event can be pinned accurately. Coupled to the buoys there are tidal gauges which can detect any changes in the tidal activity and send a warning in the event of any unusual activity. The buoys are connected to geo stationary satellite system which will be coupled to a ground station/warning system. The warning station can generate automated emails and sent these automated emails to the coastal residents within 2km perimeter warning them of an impending tidal surge. Public Addressing system will be activated at this point to warn the residents of the seismic activity. As shown in the figure the ground station must never have a power outage this is achieved by a two way power connection one is using the Grid lines and the second one utilizing Photo Voltaic system with emergency battery backup. This two way connection of Power supply can eliminate the power outage in the event of a tidal surge.
BPR Sensor that can be deployed can have the following specifications:
Paroscientific diqiquartz model 410k
Range-10,000psi
Resolution-0.15ppm
Accuracy-0.015% full scale, 0.03% corrected
Figure 2. Mooring system
The mooring system is equipped with additional components like Benthos glass spheres, polypropylene threading, to fix its position underwater. The entire mooring system is balanced on a 14 ft fibre glass pole arrangement equipped with a synthetic foam and strobe and RF pressure case to effectively sense the changes in the pressure underwater in the event of a seismic activity.
The mooring arrangement given in the Figure 2. Eble and Gonzalez [13] have electronic components placed inside an aluminium case. The mooring arrangement is also conjugated with the very high frequency buoys and has lights with strobes for effective communication. The pole connected to the sensor arrangement has a length of 14 ft. A tripod and anchor arrangement is also attached to the pressure sensor to effectively attached to a point [13].
According to Eq. (1), The sensor has an output in the form of a sinusoidal waveform with frequency say F and if the sensitivity has to be increased then a multiplying circuit has to be implemented which increases the sensitivity and the output frequency will be:
$\mathrm{F}=2^{\mathrm{n}}$ (1)
The conjugated arrangement of tidal buoys and bottom pressure sensors can detect the seismic tremors underwater and changes in the volume of water which can detect the presence of tremors and subsequent tidal flow. The model is conjugated communication systems to alert the parties to be affected immediately using a public addressing system and communication using automated emails. The power outage problem in the warning system can be fully eliminated since there is effective coordination of PV as well as grid lines connected to the warning ground station.
3.3 Flow chart of the warning system
The flow chart representation as shown below in the figure shows how the warning to different levels of threats in the event of a seismic activity is disseminated. If there is any seismic activity the signals received in the ground station can be assessed by a closed loop assessing and monitoring system. On the basis of these inputs, the assessing systems can generate different levels of threat. One of the inputs to these assessing systems can also be a seismometer output which shows the level of tremor felt in the mainland area. The assessment/monitoring system evaluates the possibility of tidal surges every hour for 4 hours since the first major seismic event. There is also a provision for non-threat bulletin with all the available inputs in the form of automated messages from the assessment/monitoring system. The no-threat messages will also be posted in the website archived for further analysis and evaluation of the event in the future.
Figure 3. Flow chart of warning system
The communication can be relayed using the mechanism as illustrated above.
The scenario of seismic activity is divided into 3 levels:
The threat due to tidal surge is maximum at this level. Due to the threat factor effective warning must be initiated using the public addressing system as well as automated messages enabled by the communication systems employed in the ground warning stations to the residents in 2km perimeter.
The orange level threat is the level in which threat level is moderate, characterized by the warning utilizing the communication system enabled to the residents in 1km perimeter near the beach or bay area.
This level has Minimum threat level in which a bulletin of the no tidal surge will be issued via messages or through website.
Implemented Simulation
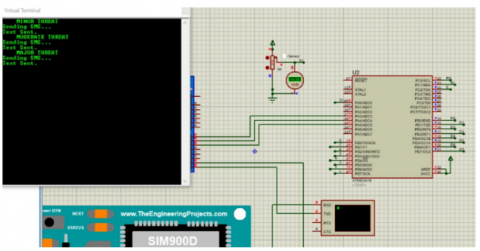
Figures 3-7 represent the implemented microcontroller based system which gives adequate warning to the respondents in the event of a critical disaster and different levels indicated by each of the responses as given in the proposed model. A prototype model of the proposed system is presented with ATMEGA16 microcontroller, which indicates the level of threat based on the combined readings from the BPR sensor and tidal gauges. The readings from the gauges are represented using electronic voltages where in different ranges of the voltages corresponds to different threat levels. These voltage levels are provided to the ATMEGA16microcontroller and upon the level indication, the LED display will indicate the threat level as minor threat, moderate threat, or major threat. These display levels are directly proportional to the readings from the sensors deployed. A critical warning message was sent using the simulation system implemented which uses SIM900D mobile GSM module utilizing ATMEGA328p and sensor data. This warning message will reach the inbox of the inhabitants who reside in 2KM perimeter and the results of the simulation show that the message reached the end users mobile unit.
When compared to the already existing systems worldwide the system to be implemented in the Arabian Peninsula will not face problems due to increased response time, no power outage difficulties as the suggested system incorporates a PV system along with the grid lines connected. One of the possible limitations of the system implemented is that if the sensors are not working efficiently the faulty readings can trigger the warning system and can result in a faulty warning message being propagated.
Figure 4. Implemented system with minor threat level
Figure 5. Implemented system with moderate threat level
Figure 6. Implemented system with major threat level
Figure 7. SMS messaging implemented with the SIM 900D Module
The research paper focuses on the design of an outline of the disaster management system in the event of an underwater or inland seismic activity. Since the risk analysis of the Arabian Peninsula was done, it shows that even though much of the Arabian Peninsula is in shallow waters and surrounded by other geographical features that protect the mainland’s, the tidal surges in the near future cannot be fully eliminated. Since there are no current warning systems employed in the Arabian Peninsula, the research outline model which is described in the paper can be an effective first line tool in the implementation of the disaster warning mechanism. The criteria of warning given in three levels namely red, orange and yellow level clearly outlines the level of threat and the perimeter of affected coastal area. Implementation of the assessment/evaluation system will be very effective as the proposed and suggested model is a closed loop one. The closed loop model evaluates output in a per hour basis and evaluates the threat and issue warning messages accordingly. The warning messages are restricted to a perimeter for example red threat is only for 2km, orange threat is only for 1km. This perimeter defined threat level conjugated with a timely updated database of contacts of coastal residents can disseminate threats effectively.
The implemented system can result in a better response from the respondents owing to the threat indicated warning and the better establishment of the communication system through the GSM Module and the data management.
The salient features of the model discussed in the paper are given in Table 4.
Table 4. Features of the model suggested
|
Sl. No. |
Property |
Model Features |
|
1 |
Sensitivity of the BPR |
Highly sensitive effective in shallow as well as deep depth tremors |
|
2 |
Deployment cost |
Moderate deployment cost |
|
3 |
Communication effectiveness |
Moderate to high level effectiveness since public addressing systems and emails are employed |
|
4 |
Power outage possibility |
Nil to minimum since PV system is also conjugated |
|
5 |
Warning time |
Minimum to moderate time requirement in warning |
A disaster management system for the tidal surge is implemented and the implications of the system proposed were studied using a simulation and was found to be having minimal delay time. The simulations on the basis of the set criteria were successful in terms of the system stability, initial cost, deployability and response time.
Since the study focuses on the initial outlining for the warning system that can be possibly deployed in the region, further researches in the technology and components and the communication system are required. Further research on the stability of the PV system implemented and its stability has to be studied. Comparison analysis on the mooring system and the associated components can also be done. One of the limiting factors of the study is that the system’s integration with the power system has to be tested for the efficacy and stability.
[1] Nayak, S. (2008). Indian tsunami warning system. The International Archives of the Photogrammetry, Remote Sensing and Spatial Information Sciences, XXXVI(B4). https://doi.org/10.1017/CBO9781139523905.032
[2] Sim, S. (2014). 2004 Indian ocean tsunami 10 years later: Warning system installed after disaster has 'Critical Gaps'. ibtimes.com.
[3] Ayad, M., Saoudi, K., Alharbi, T.E.A., Alzaidi, M.S., Benziane, M., Mouassa, S., Ghoneim, S.S.M. (2022). Design and study of a microstrip patch antenna for GPS application. Traitement du Signal, 39(4): 1145-1151. https://doi.org/10.18280/ts.390406
[4] Zhao, W., Li, H.G., Zou, L.Y. (2017). Singular value decomposition aided robust cubature quadrature Kalman filter in GPS/INS integrated navigation system. Advances in Modelling and Analysis C, 72(1): 48-66. https://doi.org/10.18280/ama_c.720104
[5] Bhaskaran, P.K., Dube, S.K., Murty, T.S., Gangopadhyay, A., Chaudhury, A., Rao, A.D. (2005). Tsunami travel time atlas for the Indian Ocean. The Indian Ocean Tsunami, 273-292.
[6] Achilleos, G.A. (2008). Positioning and mapping locations and routes of extended visibility through GIS digital elevation data. International Journal of Sustainable Development and Planning, 3(3): 223-241. https://doi.org/10.2495/SDP-V3-N3-223-241
[7] Gitis, V.G., Derendyaev, A.B. (2018). Web-Based GIS Platform for Automatic Prediction of Earthquakes. In: Gervasi, O., et al. Computational Science and Its Applications - ICCSA 2018. ICCSA 2018. Lecture Notes in Computer Science(), vol 10962. Springer, Cham. https://doi.org/10.1007/978-3-319-95168-3_18
[8] Blewitt, G., Hammond, W.C., Kreemer, C., Plag, H.P., Stein, S., Okal, E. (2009). GPS for real-time earthquake source determination and tsunami warning systems. Journal of Geodesy, 83: 335-343. https://doi.org/10.1007/s00190-008-0262-5
[9] Al-Amri, A.M. (2007). Characterization of seismic zones in the Arabian Peninsula. In Seventh Meeting of the Saudi Society for Geosciences. King Saud University, Riyadh.
[10] Al-Amri, A.M. (2005). Seismic source zones of the Arabian Peninsula and adjacent countries. In Gulf Seismic Forum, UAE University, Al-Ain, UAE, pp. 2-3.
[11] Ambraseys, N.N., Melville, C.P. (2005). A history of Persian earthquakes. Cambridge university press.
[12] Ambraseys, N.N., Melville, C.P., Adams, R.D. (1994). The Seismicity of Egypt, Arabia and the Red Sea. No Title. https://doi.org/10.1017/CBO9780511524912
[13] Eble, M.C., Gonzalez, F.I. (1991). Deep-ocean bottom pressure measurements in the northeast Pacific. Journal of Atmospheric and Oceanic Technology, 8(2): 221-233. https://doi.org/10.1175/1520-0426(1991)008%3C0221:DOBPMI%3E2.0.CO;2