Yanhao Li* | Yang Liu | Huibo Li | Ningyi Liang
© 2020 IIETA. This article is published by IIETA and is licensed under the CC BY 4.0 license (http://creativecommons.org/licenses/by/4.0/).
OPEN ACCESS
This paper attempts to evaluate the actual carrying capacity and guarantee the operation safety of Qin Bridge, Ningbo, China. Considering the structural features of the bridge, reasonable field load plans were prepared to realize load test safety control of long-span through tied-arch bridges with single bearing surface (SBS-TTABs). The internal force, stress, and deformation control under different working conditions of static load were calculated, and compared with those measured in static load tests. After that, the natural vibration, and damping features of the target bridge under impact and bumping were explored through pulsating test, barrier-free driving test, and bumping test. The results show that the maximum deflection and strain measured on the midspan section and arch rib section were both smaller than theoretical values, the calibration coefficients of deflection and strain fell in 0.60-0.88 and 0.48-0.88, respectively, indicating that the overall rigidity and strength of the bridge meet relevant code. Under the test loads, the maximum relative residual deflection and the maximum relative residual strain at each measuring point were 12.98% and 11.76%, respectively. Both were below the 20% threshold specified in JTG/T J21-2011. It shows that the bridge span has excellent elastic recovery ability. In dynamic load tests, the fundamental frequency measured by driving test agreed with that measured by bumping test, and the vibrations were smaller than the theoretical values. This means the main span has stable vibration features. Overall, the target bridge has sufficient capacity to withstand Urban-A level vehicle load, under normal use conditions, and the bridge structure belongs to the safe state.
carrying capacity, load tests, deflection, through tied-arch bridges with single bearing surface (SBS-TTABs)
Through tied-arch bridges with single bearing surface (SBS-TTABs) are unique and complex in terms of structural design and construction. For large-span arch bridges, the most effective way to identify the overall stress behaviors is to establish a reliable and reasonable finite-element model for theoretical calculation, and to verify the calculated results through field test [1-4]. The relevant studies have laid a solid basis for the research into the overall static behavior and dynamic response of SBS-TTABs.
For example, Fang et al. [5] conducted static and dynamic load tests on the completion state of Chaotianmen Yangtze River Bridge in Chongqing. Hui et al. [6] carried out a static load test on Caiyuanba Yangtze River Bridge, a highway-light rail bridge in Chongqing. Bu [7] examined the mechanical performance of long-span concrete filled steel tube (CFST) tied arch bridges. Yang and Shen [8] tested and analyzed the static and dynamic load performance of super long-span bridges with continuous steel truss and flexible arch.
Armendariz and Bowman [9] evaluated the load capacity of an arch bridge in Indiana, US through finite-element analysis and five static truck tests. Mohammadzadeh et al. [10] explored the impacts of ballast mats on the structural performance of masonry arch bridges through dynamic load tests. Chiozzi et al. [11] developed a MATLAB-based computational tool, named ArchNURBS, to evaluate the safety of arched masonry structures. Gara et al. [12] carried out impact load tests on a steel arch bridge in the construction phase. Focusing on various types of bridges, Lorenzoni, et al. [13] investigated how the extraction of modal parameters is affected by structural topology, extraction duration, load, and environmental effect. Using the LAN XI dynamic test system proposed by Kilikevicius et al. [14] analyzed the structural dynamic response of an old bridge, and acquired the main dynamic parameters of the bridge. Aras [15] performed modal tests on an overpass during the construction, and thus determined the transition of structural system.
This paper probes deep into a long-span SBS-TTAB in southeastern China. Based on the stress features and visual quality of the bridge, the safety performance of the bridge was investigated, including the deflection of control sections, the stress distribution law of concrete main beam, and the cable force of suspension rods under live load. Static and dynamic load tests were performed on the main bridge, and the test results were compared with the theoretical values. The mechanical properties of the bridge were reasonably computed, and evaluated in details. The results provide a good reference for load tests on completion state of similar bridges.
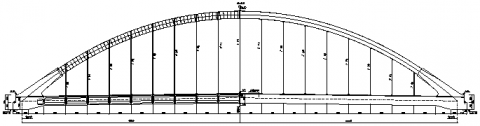
Qin Bridge is a 293m-long bridge spanning across Fenghua River, Ningbo, southeastern China’s Zhejiang Province. The longitudinal section and cross section of the bridge are illustrated in Figures 1 and 2, respectively. From the west to east, there are four 19m side spans, a 20m side span, a 120m middle span, a 20m side span, and three 19m side spans.
The main bridge is a through tied-arch structure with single bearing surface, without any supporting pier in the river. The calculated span is 120m, and the rise is 24m, putting the rise-span ratio at 1:5. The arch axis takes the shape of a quadratic parabola.
The arch rib adopts a single concrete-filled steel tube, while the arch seat is made of reinforced concrete. The 2m-tall, 3.3m-wide arch rib consists of 3 chambers. On both sides of the arch rib are two rectangular steel pipes that are circular in the upper or lower half.
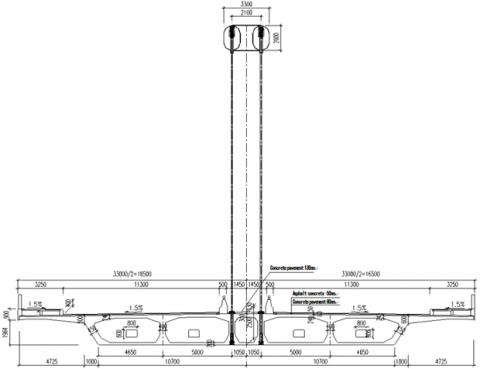
The total width of the bridge deck is 33m. Horizontally, the layout is as follows: 0.25m railing + 3m sidewalk + 11m roadway + 0.5m anti-collision wall + 3.5m central divider + 0.5m anti-collision wall + 11m roadway + 3m sidewalk + 0.25m railing.
A total of 17 pairs of suspension rods are arranged on two cable planes, with a longitudinal spacing of 6m and a traverse spacing of 3.1m. The main bridge is supported by basin-type rubber bearings, including 1 fixed bearing, 2 unidirectional movable bearings, and 5 bidirectional movable bearings.
Figure 1. Longitudinal section of Qin Bridge
Figure 2. Cross section of Qin Bridge
3.1 Control calculation of long-span rigid tied-arch bridge
For long-span tied arch bridges, the bridge design hinges on the determination of reasonable completion state. After years of service, the rigidity distribution between arch rib and the rigid main beam (tie bar) changes in rigid tied-arch bridges. Hence, the actual completion state might not be the same as the ideal completion state. Therefore, the actual line shape and internal force state of the test beam section should be identified first through load tests on completion state. The specific steps are as follows:
Step 1. Clarify the form and size of the main beam and arch rib, and determine the dead load.
Step 2. Collect relevant materials on design, construction and monitoring, construct an accurate finite-element model, optimize the bridge structure in the light of construction, and obtain the ideal line shape and internal force state of the completion state through repeated adjustment.
Step 3. Measure the cable force of suspension rods, back-calculate the cable length of the rods under no stress, fine-tune the line shape to approximate the actual completion state, and take the internal force state under dead load as the initial state of live load calculation.
3.2 Finite-element simulation
The finite-element simulation of Qin Bridge was carried out on midas. Specifically, the arch rib, i.e. the single concrete-filled steel tube, was simulated as beam elements; the suspension rods were simulated as truss elements; the main beam was simulated by the grillage method; the auxiliary structures, e.g. bridge deck pavements and sidewalks, were simulated under external load, including the initial cable force of the suspension rods. On this basis, the main bridge was meshed into 1,210 grids and 766 nodes. The calculation parameters of structural members and loads were obtained from the design documents. The finite-element model of the main bridge is presented as Figure 3 below.
According to the principle of matrix calculation, the undamped free vibration of the bridge structure can be described by the following differential equation:
$\left[ M \right]\left\{ {\ddot{\delta }} \right\}+\left[ K \right]\left\{ \delta \right\}=\left\{ 0 \right\}$ (1)
Thus, the free vibration of the bridge can be expressed as the following characteristic equation:
$\left([K]-\omega^{2}[M]\right)\{A\}=\{0\}$ (2)
Through calculation, the undamped vertical fundamental frequency was obtained as 1.63Hz.
Figure 3. Finite-element model
3.3 Load of control calculation
The design vehicle load of the bridge is Urban-A level. Thus, the theoretical load of our load tests was controlled under this level.
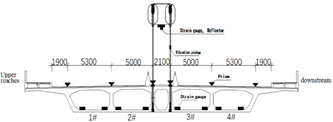
4.1 Control factors and measuring points of static load tests
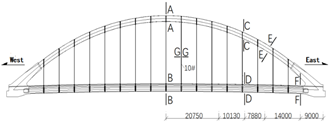
The load tests aim to obtain parameters like stress distribution and deflection distribution of the control section, as well as the cable force of some suspension rods. The control factors and control sections of the main bridge tests are given in Table 1 and Figure 4, respectively.
The stress measuring points of arch crown section, 1/4 arch rib section, and maximum negative bending moment section were arranged on the lower edge of the arch rib. The stress measuring points of midspan section, 1/4-span section, and arch foot section were arranged symmetrically on the bottom plate of the chamber. Four measuring points were deployed in the upstream and downstream, respectively.
The deflection measuring points of arch crown section, and 1/4 arch rib section were arranged on the lower edge of the arch rib. The deflection measuring points of midspan section, and 1/4-span section were arranged symmetrically on the bridge deck. Three measuring points were deployed in the upstream and downstream, respectively.
As shown in Figure 5, the fulcrum settlement measuring points were arranged at the main piers on both sides.
Table 1. Control factors and key items of main bridge tests
|
Control sections |
Control factors |
Key items |
|
A |
Maximum positive bending moment on arch crown section |
Section strain and deflection |
|
B |
Maximum positive bending moment on midspan section |
Section strain and deflection |
|
C |
Maximum positive bending moment on 1/4 arch rib section |
Section strain and deflection |
|
E |
Maximum negative bending moment near arch foot |
Section strain |
|
G |
Maximum cable force increment near midspan |
Cable force increment |
Figure 4. Control section layout of main bridge
Figure 5. Arrangement of measuring points on the cross section
4.2 Loading of static load tests
Before the static load tests, the most vulnerable positions of structural internal force were determined, based on the internal force envelope under live load (considering the initial stress rigidity). For each control section, the load was distributed according to the influence line of linear load, provided that the load falls in the range specified by the Evaluation Method of Carrying Capacity of Former Highway Bridges (Trial). Through control calculation, the theoretical live load was obtained, and used to formulate the load test plan.
Considering the high magnitude and multiple levels of load, the static load tests were performed at night, when the temperature is relatively stable. Five loading control parts were selected on the bridge. With a total load of 35t, 12 loading trucks were adopted to implement the static load tests under 5 working conditions (Figure 6). Before loading, preload was applied to eliminate nonlinear factors.
Displacement was collected automatically and crosschecked by 4 total stations. Stress was measured automatically by multiple stations, such that the test data are accurate and valid. According to the standard live load and the calculated results, the load efficiencies (Table 2) of the static load tests were between 0.86 and 0.93, falling within the specified range of 0.85-1.05.
Table 2. Load efficiencies of static load tests
|
Working conditions |
Control items |
Theoretical load |
Test load |
Load efficiency |
|
Ⅰ |
Bias load of positive bending moment on arch crown section /(kN·m) |
4,721 |
4,391 |
0.93 |
|
Ⅰ |
Bias load of positive bending moment on midspan section /(kN·m) |
2,565 |
2,385 |
0.93 |
|
Ⅰ |
Bias load of cable force increment near midspan /(kN) |
182 |
157 |
0.86 |
|
Ⅱ |
Balanced load of positive bending moment on arch crown section /(kN·m) |
4,328 |
4,025 |
0.93 |
|
Ⅱ |
Balanced load of positive bending moment on midspan section /(kN·m) |
2,360 |
2,171 |
0.92 |
|
Ⅱ |
Balanced load of cable force increment near midspan /(kN) |
133 |
117 |
0.88 |
|
Ⅲ |
Bias load of positive bending moment on 1/4 arch rib section /kN·m |
2,843 |
2,445 |
0.86 |
|
Ⅳ |
Balanced load of positive bending moment on 1/4 arch rib section /(kN·m) |
2,591 |
2,306 |
0.89 |
|
Ⅴ |
Balanced load of negative bending moment near arch foot/(kN·m) |
-5,324 |
-4,579 |
0.86 |
4.3 Control factors and measuring points of dynamic load tests
The dynamic load tests include pulsation test, driving test, and bumping test. The dynamic test sensors were deployed on the bridge deck of the middle span to measure vertical vibration. The impact sensors were arranged on the bottom of the midspan of the main beam. The photo of dynamic load tests is presented in Figure 7.
4.4 Loading of dynamic load tests
(1) Pulsation test: A vibration pickup was installed on the upstream and downstream of the midspan section of the main bridge to collect the vibration frequency of the bridge under natural excitation.
(2) Barrier-free driving test: With a total load of 33.5t, a loading truck drove along the centerline of the road on the bridge deck at 20km/h and 30km/h, respectively. The dynamic strain of the truck was recorded by dynamic and static digital strain gauges.
(3) Bumping test: The loading truck bumped at the midspan of the main bridge and stopped, causing free vibrations of the bridge. The residual vibration signals were captured by speed sensors, and used to test the damping features of the bridge.
Figure 6. Field loading of static load tests
Figure 7. Field loading of dynamic load tests
5.1 Results of deflection test and analysis
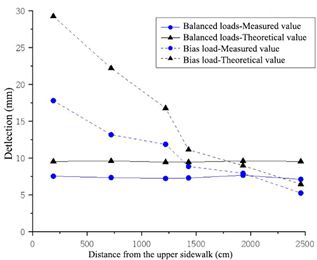
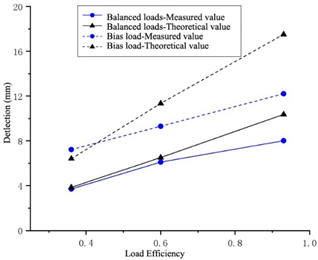
For the lack of space, this subsection mainly analyzes the measured deflections under the maximum positive bending moment on midspan section, arch crown section, and 1/4 arch rib section. Figures 8 and 9 compare the measured maximum vertical deflections on midspan section and arch crown section with theoretical values.
Figure 8. Deflection distribution of midspan section
Figure 9. Deflection distribution of arch crown section
Under bias load, the effect of bias load was prominent in the transverse direction of the midspan, as the maximum deflection was measured as 17.77mm. The maximum deflection on arch crown section was 11.01mm. The calibration coefficients of measuring points for midspan deflection were 0.60-0.88, while that of measuring points for arch crown deflection was 0.63.
Under balanced load, the maximum deflection measured in the transverse direction of the midspan was located at the centerline of the single-land road, and was synchronized in the upstream and the downstream. The maximum deflections in the upstream and the downstream were 7.36mm, and 7.64mm, respectively. The maximum deflection was 7.85mm at thec arch crown. The calibration coefficients of measuring points for midspan deflection were 0.74-0.89, while those of measuring points for arch crown deflection were 0.78.
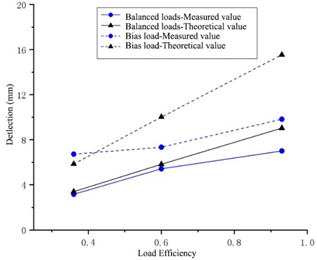
Figure 10 compares the measured deflection of maximum positive bending moment on 1/4 arch rib section with theoretical value. Under bias load, the maximum deflection on 1/4 arch rib section was 12.21mm; under balanced load, the maximum deflection on 1/4 arch rib section was 8.02mm. The calibration coefficients under the two loads were 0.70 and 0.77, respectively.
Figure 10. Deflection distribution of 1/4 arch rib section
It can be seen that the midspan section of the main span has obvious bias load effect. The measured and theoretical bias load coefficients were 1.64 and 1.85, respectively. In general, the main bridge has good bending resistance. The measured maximum deflection of the deck was below the designed control value L/600 (200.00mm), and the calibration coefficients were all smaller than 1. The results show that the finite-element model can reasonably reflect the overall static behavior of the bridge.
5.2 Results of strain test and analysis
This subsection focuses on the strain test results from sections A, B, E, and F (Tables 3 and 4). Under the bias load, the calibration coefficients of strain measuring points on section A were 0.53-0.86, while those on section B were 0.74. Under balanced load, the calibration coefficients of strain measuring points on section A were 0.48-0.88, while those on section B were 0.67. Under balanced load, the calibration coefficients of strain measuring points on section D were 0.43-0.71, while those on Section B were 0.64.
Under all working conditions, the strain calibration coefficients were smaller than 1, indicating that the strength of the main beam has a certain surplus. After unloading, the relative residual strains at measuring points were below 20%, as required in the Specification for Inspection and Evaluation of Load-bearing Capacity of Highway Bridges (JTG/T J21-2011) [16]. This means the elastic recovery ability of the main beam and arch rib sections meets the requirements.
Table 3. Strain assessment results under working conditions I and II
|
Control sections |
Location of measuring point |
Measured strain/με |
Theoretical strain/με |
Calibration coefficient |
Relative residual strain/% |
|
Section A |
Lower edge of arch rib |
26(22) |
36(33) |
0.74(0.67) |
8.92(-2.4) |
|
Section B |
Upstream 1# chamber |
4(12) |
6(25) |
0.67 (0.48) |
10.87(5.4) |
|
Downstream 1# chamber |
14(20) |
20(25) |
0.70 (0.80) |
11.76(8.8) |
|
|
Upstream 2# chamber |
23(27) |
32(36) |
0.72 (0.75) |
4.90(-2.6) |
|
|
Downstream 2# chamber |
20(25) |
38(38) |
0.53 (0.66) |
6.98(4.6) |
|
|
Upstream 3# chamber |
32(21) |
46(38) |
0.70(0.55) |
-3.26(-5.4) |
|
|
Downstream 3# chamber |
39(26) |
57(36) |
0.68 (0.72) |
-1.29(8.4) |
|
|
Upstream 4# chamber |
51(22) |
68(25) |
0.75 (0.88) |
5.45(4.0) |
|
|
Downstream 4# chamber |
70(17) |
81(25) |
0.86 (0.68) |
3.21(3.7) |
Note: 1. “-” means compressive strain, and “+” means tensile strain; 2. The bracketed figures are the test results under working condition II.
Table 4. Stress assessment results under working condition V
|
Control sections |
Location of measuring point |
Measured strain/με |
Theoretical strain/με |
Calibration coefficient |
Relative residual strain/% |
|
Section E |
Lower edge of arch rib |
-27 |
-42 |
0.64 |
5.32 |
|
Section F |
Upstream 1# chamber |
-4 |
-7 |
0.57 |
4.76 |
|
Downstream 1# chamber |
-12 |
-17 |
0.71 |
4.76 |
|
|
Upstream 2# chamber |
-11 |
-17 |
0.65 |
2.65 |
|
|
Downstream 2# chamber |
-6 |
-14 |
0.43 |
1.00 |
|
|
Upstream 3# chamber |
-7 |
-14 |
0.50 |
-2.94 |
|
|
Downstream 3# chamber |
-13 |
-17 |
0.76 |
2.99 |
|
|
Upstream 4# chamber |
-11 |
-17 |
0.65 |
5.66 |
|
|
Downstream 4# chamber |
-5 |
-7 |
0.71 |
9.47 |
5.3 Results of cable force tests and analysis
Table 5 lists the results of cable force tests of suspension rod 10# under the working condition of maximum cable force increment.
As shown in Table 5, the measured cable forces agreed well with the theoretical values, with the negative maximum deviation being -9.24%. This means the live load propagates normally via the suspension rod to the arch rib. The accuracy of the finite-element model is further confirmed.
Table 5. The results of cable force tests under maximum cable force increment
|
No. |
Bias load under working condition I/kN |
Balanced load under working condition II/kN |
||||
|
Measured increment |
Theoretical increment |
Relative difference/% |
Measured increment |
Theoretical increment |
Relative difference/% |
|
|
Upper part of 10# |
139 |
153 |
-9.15 |
110 |
119 |
-7.56 |
|
Lower part of 10# |
157 |
171 |
-8.19 |
108 |
119 |
-9.24 |
6.1 Results of fundamental frequency test and analysis
Under natural excitation, barrier-free driving, and after-vibration of bumping, the speed response signals were collected from the measuring points through continuous sampling.
The measured frequency is compared with the calculated frequency in Table 6, and the results of fast Fourier transform (FFT) are displayed in Figure 11.
As shown in Figure 11, the measured frequencies were greater than calculated values, that is, the measured dynamic rigidity was greater than the theoretical value. Hence, the bridge structure boasts good rigidity and technical condition, with small damping variations. Moreover, the measured fundamental frequencies were all 1.95Hz under natural excitation, barrier-free driving, and after-vibration of bumping. The results indicate that the bridge structure has stable vibration features, and the boundaries of span structure are not affected by the live load.
Figure 11. The FFT results of natural frequencies
Table 6. Comparison between measured frequency and theoretical value
|
Order |
Measured frequency/Hz |
Calculated frequency /Hz |
Ratio |
Damping ratio |
|
1 |
1.95 |
1.63 |
1.20 |
0.056 |
6.2 Results of impact coefficient test and analysis
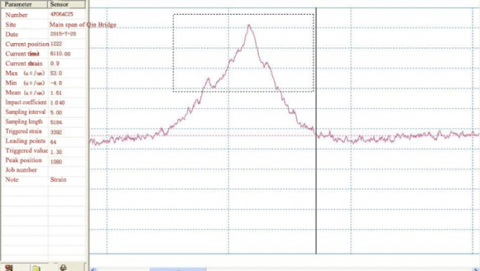
Table 7 compares the measured impact coefficient and theoretical value. Figure 12 shows the time history of dynamic strain of the mid-span section. It can be seen that the impact coefficient of the main span was smaller than the theoretical value, indicating that the vibration performance and deck flatness are both normal.
Table 7. Comparison between measured and theoretical impact coefficients
|
Driving speed |
Measured impact coefficient |
Theoretical impact coefficient |
|
30 km/h |
1.040 |
1.071 |
Figure 12. Time history of dynamic strain on midspan section
Under the test loads, the deflection measured at each point of the main bridge was smaller than the theoretical value, and the calibration coefficients were basically between 0.60 and 0.88. The results show that the main bridge still has some surplus in rigidity. Under the test loads, the strain measured at each point of the main bridge was smaller than the theoretical value, and the calibration coefficients were basically between 0.48 and 0.88. This means the main bridge still has some surplus in strength. Under the test loads, the measured cable force at each point was smaller than the theoretical value, indicating that the suspension rods of the main bridge have some surplus in tensile strength. The above results of static and dynamic tests prove that the long-span SBS-TTAB has sufficient capacity to withstand Urban-A level vehicle load, under normal use conditions.
Under the test loads, the maximum relative residual deflection and the maximum relative residual strain at each measuring point were 12.98% and 11.76%, respectively. Both were below the 20% threshold specified in JTG/T J21-2011. It shows that the bridge span has excellent elastic recovery ability. The bias load coefficients on the midspan section were relatively large. The torsional rigidity of such a wide box beam, with two cable planes in the middle span, has a nonnegligible impact on bias load coefficient.
The vibration features of the span structure were stable, and the results of driving test agreed well with those of the bumping test. The vibrations induced by bumping attenuated quickly, reflecting the good attenuation performance of the main beam. The measured damping ratio of the bridge fell in the normal range. The impact coefficient measured on the midspan section was smaller than the theoretical value, indicating that the vehicle impact on the bridge structure is smaller than the theoretical design value. To sum up, the results of static and dynamic tests prove the stability and reliability of the target bridge.
This work was supported by Chongqing Municipal Education Commission (Grant No.: KJ1712315) and Yangtze Normal University (Grant No.: 2016XJQN10).
[1] Jia, Y., Bai, L.H., Ji, Y.T., Li, J.J., Yuan, D.M. (2017). Study of load tests for long-span continuous rigid frame bridge. Journal of Architecture and Civil Engineering, 34(4): 105-111. https://doi.org/10.3969/j.issn.1673-2049.2017.04.014
[2] Fu, G.Q., Lv, L., Jia, Y., Liao, P., Gao, Z.Y. (2017). Study on static load test of simply-supported girder bridge reinforced by steel plates. Railway Engineering, 57(6): 24-27.
[3] Paeglitis, A., Freimanis, A. (2016). Comparison of constant-span and influence line methods for long-span bridge load calculations. The Baltic Journal of Road and Bridge Engineering, 11(1): 84-91. https://doi.org/10.3846/bjrbe.2016.10
[4] Lantsoght, E.O., van der Veen, C., Hordijk, D.A., de Boer, A. (2017). Development of recommendations for proof load testing of reinforced concrete slab bridges. Engineering Structures, 152(12): 202-210. https://doi.org/10.1016/j.engstruct.2017.09.018
[5] Fang, H.B., Li, O. (2015). Study on load test of Chaotianmen Yangtze River Bridge in Chongqing. Railway Engineering, (2): 12-15. https://doi.org/10.3969/j.issn.1003-1995.2015.02.04
[6] Hui, D., Lu, W.W., Yan, M., Li, X.B. (2013). Static loading tests research about Caiyuanba Highway-rail Bi-urpose Yangtze River Bridge. Sichuan Building Science, 39(2): 95-99. https://doi.org/10.3969/j.issn.1008-1933.2013.02.020
[7] Bu, Z.P. (2015). Study on the static and dynamic load test for long-span CFST tied arch bridge. Journal of Xi'an University of Architecture & Technology (Natural Science Edition), 47(3): 388-391.
[8] Yang, Y., Shen, Q.C. (2014). Static and dynamic loading tests and structural analysis for Rongjiang River Bridge with continuous steel truss and flexible arch in Xiamen-Shenzhen Railway. Journal of Railway Science and Engineering, 11(4): 19-25. https://doi.org/10.3969/j.issn.1672-7029.2014.04.004
[9] Armendariz, R.R., Bowman, M.D. (2018). Improved load rating of an open-spandrel reinforced-concrete arch bridge. Journal of Performance of Constructed Facilities, 32(4): 04018035. https://doi.org/10.1061/(ASCE)CF.1943-5509.0001177
[10] Mohammadzadeh, S., Miri, A., Nouri, M. (2017). Enhancing the structural performance of masonry arch bridges with ballast mats. Journal of Performance of Constructed Facilities, 31(5): 04017089. https://doi.org/10.1061/(ASCE)CF.1943-5509.0001080
[11] Chiozzi, A., Malagù, M., Tralli, A., Cazzani, A. (2016). ArchNURBS: NURBS-based tool for the structural safety assessment of masonry arches in MATLAB. Journal of Computing in Civil Engineering, 30(2): 04015010. https://doi.org/10.1061/(ASCE)CP.1943-5487. 0000481
[12] Gara, F., Nicoletti, V., Carbonari, S., Ragni, L., Dall’Asta, A. (2020). Dynamic monitoring of bridges during static load tests: influence of the dynamics of trucks on the modal parameters of the bridge. Journal of Civil Structural Health Monitoring, 10: 197-217. https://doi.org/10.1007/s13349-019-00376-1
[13] Lorenzoni, F., De Conto, N., da Porto, F., Modena, C. (2019). Ambient and free-vibration tests to improve the quantification and estimation of modal parameters in existing bridges. Journal of Civil Structural Health Monitoring, 9(5): 617-637. https://doi.org/10.1007/s13349-019-00357-4
[14] Kilikevičius, A., Bačinskas, D., Jurevičius, M., Kilikevičiene, K., Fursenko, A., Jakaitis, J., Toločka, E. (2018). Field testing and dynamic analysis of old continuous truss steel bridge. Baltic Journal of Road & Bridge Engineering, 13(1): 54-66. https://doi.org/10.3846/bjrbe.2018.394
[15] Aras, F. (2018). Modal testing of an isolated overpass bridge in its construction stages. The Baltic Journal of Road and Bridge Engineering, 13(1): 67-76. https://doi.org/10.3846/bjrbe.2018.398
[16] The Ministry of Transport of the People's Republic of China. (2011). JTG/T J21—2011 Specification for Inspection and Evaluation of Load−bearing Capacity of Highway Bridges. Beijing: People's Traffic Press.