Ayse Akbulut Basar![]()
© 2024 The authors. This article is published by IIETA and is licensed under the CC BY 4.0 license (http://creativecommons.org/licenses/by/4.0/).
OPEN ACCESS
The study aims to analyze the correlation between decisions on location, construction style, function, and building height in residential areas and an earthquake-resilient urban approach using multivariate linear regression analysis. The selected study area is Sahinali Neighborhood in the city center of Nigde, impacted by in the Kahramanmaras Earthquake Sequence (the 7.8 and 7.5 Mw earthquakes) in Turkey on February 6, 2023. Findings reveal that site selection is the most crucial factor influencing earthquake damage vulnerability, followed by building function, layout, and number of floors. The results emphasize that city-scale decisions made through zoning plans directly influence the development of an earthquake-resistant city.
urban resilience, earthquake vulnerability, regression analysis, Nigde, Turkey
Urban resilience refers to a city's resilience to natural and man-made disasters and its flexibility to cope with the impacts of these disasters [1-3]. Urban resilience is related to a city's physical infrastructure, social structures, governance, and socio-economic factors [3-5].
Earthquakes have a direct impact on the city as they lead to loss of life and destruction of property and infrastructure. Measures taken against earthquakes and efforts to alleviate the problems that may be experienced after earthquakes are addressed within the scope of the disaster-resilient city approach in the field of urban planning [6-8]. The resilience of cities, home to over half of the world's population, is demonstrated by their ability to adapt to the rapid pace of contemporary physical, social, and economic developments while minimizing vulnerability to unplanned events. By accurately identifying risks related to disasters, it becomes feasible to implement precautionary measures in cities, particularly in areas highly susceptible to such events. The present century has witnessed a rise in uncertainties for urban centers. The imperative to anticipate potential challenges that urban systems might face places a significant responsibility on the field of urban planning [6, 9-12].
A resilient urban planning approach necessitates addressing the natural and constructed physical environment of the entire city in a multidisciplinary manner. Zoning plans are the primary tool for Turkey to foster resilient cities through urban planning [13-15]. Through technical and legal means, zoning plans are designed to determine how many individuals will be located in a certain area, their occupations, recreational activities, and the social and cultural resources that will be available. based on these large-scale decisions, the essential choices taken for the implementation of the zoning plans can be enumerated as: site selection, construction form, function, and the number of floors [13].
The study aims to analyze the correlation between decisions on location, construction style, function, and building height in residential areas and an earthquake-resilient urban approach using multivariate linear regression analysis. In this study, answers to the following questions are sought:
·Is there a significant correlation between decisions in urban planning—specifically, the selection of residential areas, building layout, structural function, and the number of floors (height)—which are crucial aspects of urban planning and outcomes of zoning plans, and vulnerability to earthquakes when considered variables as indicators?
·If so, to what extent?
·Which indicator exhibits a stronger correlation with vulnerability to earthquake damage?
2.1 Nigde as a case study
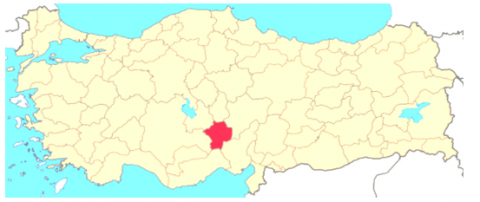
The seismic events that took place on 6 February 2023, namely the Kahramanmaras Pazarcık earthquake measuring 7.8 Mw and the Ekinozu earthquake measuring 7.5 Mw, occurred within a six-hour interval and is regarded as highly devastating seismic occurrences in the history of Turkey’s disaster incidents. These calamities tragically resulted in the loss of an estimated 50.000 lives [16]. Due to the magnitude of the earthquake, the ten provinces in Turkey were initially identified as the directly affected areas: Kahramanmaras, Gaziantep, Malatya, Diyarbakir, Kilis, Sanliurfa, Adıyaman, Hatay, Osmaniye, and Adana. However, as a result of the damage assessment performed after the severe disaster, the Disaster and Emergency Management Authority (AFAD) recommended the expansion of the scope of the affected regions [17]. Consequently, Elazig, Bingol, Kayseri, Mardin, Tunceli, Batman, and Nigde Provinces were declared as disaster affected areas on April 3, 2023. Of this, Nigde was selected as the focus area for this study [17]. Nigde, situated in the Central Anatolia Region, is home to approximately 365.000 inhabitants (Figure 1).
Figure 1. Geographical location of Nigde
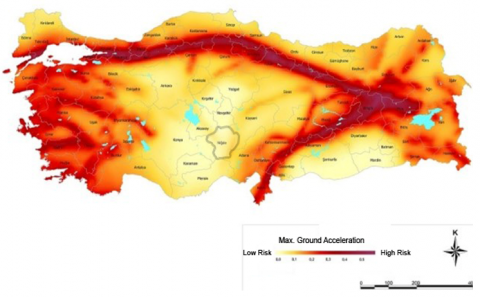
Despite being located in a geographically low-risk area for earthquakes compared to the entirety of Turkey, Nigde has a complex geological history, and historical records indicate that it has experienced moderate-scale earthquakes over time. (Figure 2) [9, 18, 19]. Upon examining current studies on the city center of Nigde Province, it is evident that some areas are geologically unsuitable for settlement, vulnerable to earthquakes, and pose a high risk for residential areas due to the characteristics of the ground [9, 20].
Figure 2. Turkey earthquake hazard map [21]
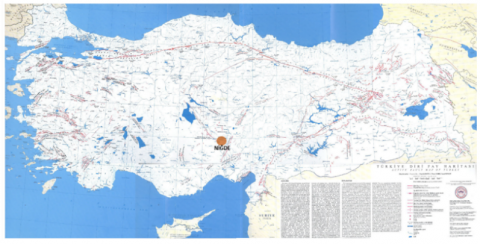
Nigde suffered structural damage at the building level after the disaster on February 6, 2023 [22]. Subsequently, the Turkish Mineral Research and Exploration Administration (MTA) updated and released a map of active fault lines (Figure 3), indicating the presence of three fault lines surrounding Nigde in the north (Derinkuyu), northeast-southwest (Ecemiş), and northwest-southeast (Tuz Gölü) directions [23]. Hence, it can be asserted that Nigde is also situated in an earthquake-prone region.
According to damage assessment studies conducted by the Ministry of Environment, Urbanization, and Climate Change after the earthquake, out of the 1.972 buildings in the Central District and its surrounding villages and neighborhoods, 178 were severely damaged, 157 were moderately damaged, and 681 slightly damage [24].
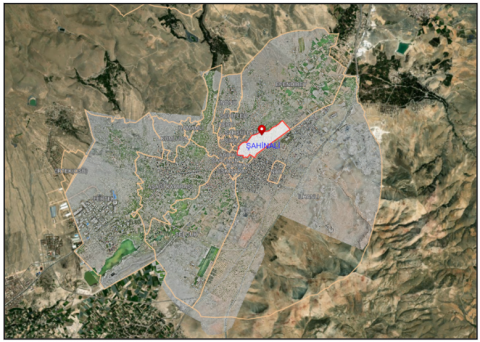
Based on field studies, the Sahinali Neighborhood in the Central District of Nigde was chosen as the investigation area due to its high concentration of heavily damaged buildings requiring immediate demolition. Sahinali Neighborhood is located in the northeastern part of Nigde Province's central district, along the Kayseri Road (Figure 4). Covering an area of 137.8 hectares, it is the fourth largest neighborhood in terms of population (7.999 people) and the fifth largest in terms of area (1.245 km²) in Nigde Province center [25].
Figure 3. Updated map of fault lines in Turkey [23]
Figure 4. Geographical location of Sahinali Neighborhood in Nigde
In Environmental Plan Analytical Report prepared by Nigde Municipality in 2010, it was noted that 41% of the Central District of Nigde Province is geologically unsuitable for settlement, 27% can be inhabited with precautions, and the remaining 32% is suitable for settlement. Like much of the city center, Sahinali Neighborhood is situated in a geologically hazardous area characterized by alluvial soils [26].
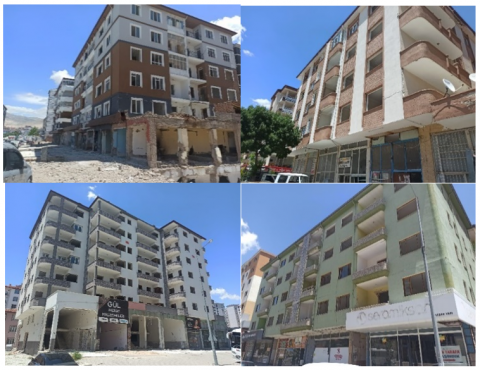
A total of 286 buildings were assessed in Sahinali Neighborhood. Among these, 8% (24) were severely damaged (Figure 5), 3% were moderately damaged, and 10% (29) were slightly damaged [24].
Out of the 286 buildings in the sample, 32% are situated in the stream bed, while the remaining 68% are located in other areas. The neighborhood exhibits three different types of construction forms: adjacent, separate, and block layouts. Specifically, 27% of the buildings were constructed in adjacent layout, 25% in separate layout, and 48% in block layout. Regarding building usage within the neighborhood, it has been observed that some buildings served as residential and commercial purposes, with residential functions in top floors and ground floors dedicated to commercial activities. The analysis indicates that 20% of the examined buildings are primarily residential, while 80% are predominantly residential buildings with ground-floor commercial spaces. Additionally, the analysis of the number of floors reveals that the sampled neighborhood encompasses buildings with varying floor heights. As a result, the breakdown indicates that 3% of the buildings have 1‑2 floors, 14% have 3‑4 floors, 49% have 5‑6 floors, 17% have 7‑8 floors, 12% have 8‑9 floors, and 5% have 10 floors or more.
Figure 5. Examples of severely damaged and evacuated buildings in Sahinali Neighborhood (Original)
2.2 Method
2.2.1 Data collection tools
The study's data were obtained through the e-government platform and the Nigde Municipality City Guide Application. The "Damage Determination Inquiry and Appeal Procedures" menu provides data on the neighborhood, street name, building number, and building damage status and is publicly available through the Ministry of Environment, Urbanization, and Climate Change [24]. The City Guide Application facilitated the acquisition of up-to-date satellite photos, the number of floors, and zoning status data based on the neighborhood, street name, and building number [27]. All data used for the study were retrieved from the relevant sources on April 20, 2023, while fieldwork was conducted between May 1 and 10, 2023.
As the chosen data collection instrument, publicly accessible platforms open to all have been favored. This deliberate choice aims to facilitate the broad dissemination of the study's content, methodology, and findings. The parameters within the study have been derived from online platforms serving as the primary data collection source. The preference for these data sources is attributed to their status as official records shared post-disaster. Despite the imperative of including the building age parameter in the study, given the locale's status as one of the oldest neighborhoods and the municipality's archival challenges concerning pre-1990 title deed records, its incorporation proved unfeasible. Recognizing potential conflicts and errors in data obtained through searches based on building numbers, on-site verification was concomitantly conducted through fieldwork. Consequently, owing to constraints in both time and human resources, the examination was limited to the neighborhood displaying the highest degree of damage. In this context, it becomes evident that the municipality is ill-prepared in the context of collecting, classifying, and digitizing data pertinent to structures, particularly concerning their resilience to disasters.
2.2.2 Data analysis method
The study employed the multivariate linear regression analysis method, also known as multiple regression analysis, which is a statistical analysis technique aiming to explain a dependent variable using multiple independent variables [28]. It is performed to determine the presence of significant relationships between the dependent and independent variables, as well as to quantitatively measure the effect of the independent variables on the dependent variable [29-31]. While we cannot predict the exact timing of earthquakes, we do have the opportunity to proactively take precautions and minimize damage by establishing parameters for constructing disaster-resistant cities. In this study, the justification for employing the Multiple Regression Analysis method lies in clarifying the relationship between the parameters derived from development plans and the damage status of buildings.
Multiple regression analysis has been extensively used in earthquake-related studies, including predictions, damage reduction strategies through various indicators, vulnerability detection, and the development of more resilient structures and cities. Researchers such as Godschalk et al. [32], Bostenaru Dan and Armas [33], Rahman et al. [34] and Mitsova [35] have emphasized the use of multivariate regression analysis to enhance the design and policy-making processes in urban planning related to natural disasters. They have demonstrated the relationships between disaster-resilient urban infrastructure, superstructure development, and earthquake damage using this method. Similarly, Li [36], Jia and Yan [37], Bostenaru Dan and Armaş [38], Yariyan et al. [39], and Saputra et al. [40] have utilized multiple regression analysis to identify the factors influencing earthquake damage within the field of engineering and create earthquake vulnerability indices.
In the dataset utilized for this study, there is one dependent variable and four independent variables. The dependent variable is the structural damage status, while the independent variables are being located in the stream bed, construction form, function, and the number of floors. The subcategories of the variables group are presented in Table 1.
Table 1. Variables and subcategories used in the analysis
|
Variable Type |
Subcategories |
|
Dependent Variable: Structural Damage Status |
-No Damage -Slight Damaged -Moderate Damaged -Severe Damaged |
|
Independent Variable: Being in a Stream Bed |
-In a Stream Bed -Other |
|
Independent Variable: Construction Form |
-Adjacent -Separated -Block |
|
Independent Variable: Structure Function |
-Residential -Residential and Commercial |
|
Independent Variable: Number of Floors |
-1‑2 -3‑4 -5‑6 -7‑8 -9‑10 -More than 10 |
In light of this information, the regression hypothesis established in the study is as follows:
H0: β1=β2=⋯=βp=0
H1: At least 1 βj≠0
H0: None of the independent variables predicts the dependent variable.
H1: At least one of the independent variables significantly predicts the dependent variable.
Data were analyzed using IBM SPSS Statistics 26 software.
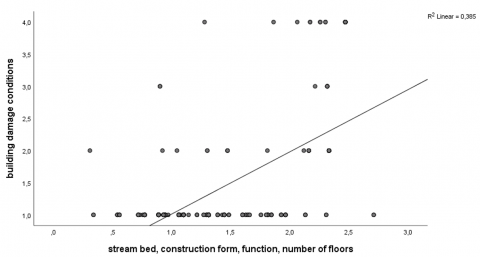
To predict the building damage status, the multivariate linear regression analysis was conducted using the variables of being located in the stream bed, construction form, function, and number of floors. As a result of the analysis, a significant regression model was obtained, F(4, 281)=48.96, p<0.001 and 40% of the variance in the dependent variable (R2adjusted= 40) was explained by the independent variables (Table 2).
The R2 value of 0.40 is statistically significant and the increase in this figure can be attributed to a higher number of variables and meaningful relationships that elucidate the dependent variable. This study was conducted using parameters present in development plans, which are publicly accessible after an earthquake. It is essential to highlight that the study measures the significance level of these variables and assigns them a ranking.
Accordingly, the independent variable of being in the stream bed significantly and negatively predicts structural damage, β=-49, t(281)=-9.25, p<0.001, pr2=0.233.
The other independent variable, construction form, positively and significantly predicts structural damage, β=20, t(281)=4.19, p<0.001, pr2=0.06.
The independent variable, function, positively and significantly predicts structural damage, β=16, t(281)=3.36, p<0.001, pr2=0.04.
The last independent variable, the number of floors, positively and significantly predicts structural damage, β=21, t(281)=4.09, p<0.001, pr2=0.056.
In this context, the regression equation:
$Y=\beta_0+\beta_1 X_1+\beta_2 X_2+\cdots+\beta_p X_p$ (1)
can be formulated as follows:
Structural Damage Status=1.143-0.85×Being in the Stream Bed+0.21×Construction Form+0.36×Building Function+0.17×Number of Floors.
This Eq. (1) is visualized in Figure 6, illustrating the results of the multiple regression analysis.
Table 2. Multiple regression analysis results for predicting
|
Model |
Unstandardized Coefficients |
Standardized Coefficients |
t |
Sig. |
95.0% Confidence Interval for B |
Correlations |
Collinearity Statistics |
|||||
|
B |
Std. Error |
Beta |
Lower Bound |
Upper Bound |
Zero-Order |
Partial |
Part |
Tolerance |
VIF |
|||
|
(Constant) |
1.143 |
0.296 |
|
3.860 |
0.000 |
0.560 |
1.725 |
|
|
|
|
|
|
Stream bed |
-0.848 |
0.092 |
-0.448 |
-9.254 |
0.000 |
-1.029 |
-0.668 |
-0.531 |
-0.483 |
-0.424 |
0.895 |
1.117 |
|
Number of floors |
0.169 |
0.041 |
0.210 |
4.095 |
0.000 |
0.088 |
0.250 |
0.423 |
0.237 |
0.188 |
0.797 |
1.255 |
|
Construction forms |
0.210 |
0.050 |
0.200 |
4.192 |
0.000 |
0.111 |
0.308 |
0.274 |
0.243 |
0.192 |
0.921 |
1.085 |
|
Function |
0.364 |
0.108 |
0.165 |
3.360 |
0.001 |
0.151 |
0.577 |
0.178 |
0.197 |
0.154 |
0.872 |
1.147 |
|
*Dependent Variable: building damage conditions **p<.001 |
||||||||||||
Figure 6. Visualization of multiple regression analysis
After the earthquake sequence on February 6, 2023, in Kahramanmaraş, Turkey, the neighborhood with the highest number of heavily damaged buildings in Niğde Province, located in the affected area, was selected as the study area.The study's outcomes effectively addressed the research questions guiding the research. It has been established that a significant correlation exists between selected variables and the earthquake vulnerability of structures. The findings underscore the substantial influence of site selection, identifying it as the most critical factor in earthquake vulnerability. Specifically, in neighborhoods situated in geologically hazardous areas, choosing a location in the stream bed was found to have a direct and negative impact on structures across all parameters. The study emphasizes that decision-making regarding site selection surpasses the importance of other parameters in determining structural vulnerability.
The next parameter that exhibited the greatest influence on vulnerabilities was the building's function. It was determined that using the ground floor for commercial purposes, while having residential units on the upper floors, increases the risk compared to using the building solely for residential purposes. The function parameter is followed by the construction form. It was observed that the most damage-sensitive building layout parameters were block, adjacent, and separated. This underscores the need to reevaluate small-scale parcels through land arrangements in seismic-risk areas during planning, aiming to avoid block or adjacent forms as much as possible.
As for the last parameter, the number of floors exhibited the weakest relationship with vulnerability. While the number of floors in a building has a significant relationship with damage vulnerability in the analysis, it can be interpreted that this parameter is important, but its significance among all parameters is relatively low.
Following the assessment of building damages, the study also examined the existing zoning plans for areas with heavily damaged structures.
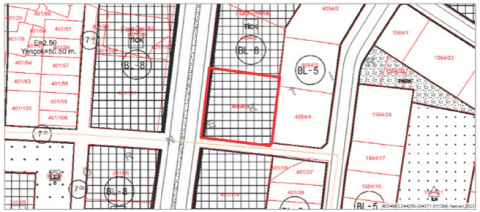
Figure 7 presents an example of a 1/1000 scaled implementation zoning plan, approved on 05.10.2021, illustrating the zoning plan for a parcel where a heavily damaged building is located in Sahinali Neighborhood. The figure highlights that a zoning permission was granted for a 6-floor, separated structure with residential and commercial use.
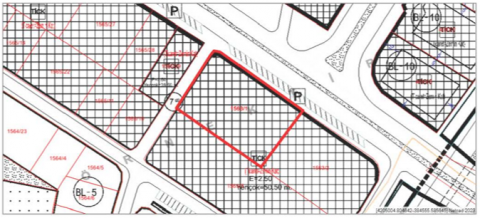
Furthermore, the same plan reveals that the zoning permit for the parcel located in the stream bed, heavily damaged after the earthquake, allows for up to 16 floors (Figure 8). The figure demonstrates that while the current street texture consists of 4‑5 floor residential buildings, the new zoning plan permits the entire street and the connected street to be used for residential and commercial purposes.
Figure 7. Example of the current zoning plan on the parcel where a heavily damaged building is located 1
Figure 8. Example of the current zoning plan on the parcel where a heavily damaged building is located 2
The examination of examples following the earthquake disaster in the province has revealed the need for a revision of existing zoning plans. It has been identified that current decisions should be reassessed in light of their potential to induce vulnerability. This underscores the importance of urban policies and, once again, emphasizes the necessity of preparing city plans based on scientific data.
This study sheds light on the critical significance of decisions related to the location of residential areas, function, construction form, and the number of floors (height) concerning earthquake vulnerability. Contrary to prevailing public views, the findings underscore the importance of making informed decisions based on a disaster-resistant urban planning framework rather than relying solely on building-specific decisions, legislation, and regulations. Furthermore, while building height initially influences earthquake risk perception, especially concerning preferences for living spaces, it has been determined that the utilization of the ground floor and its location within the parcel and neighboring parcels carry greater significance. Hence, achieving a disaster-resilient city necessitates a primary focus on urban-scale approaches and the formulation of zoning plans aligned with these strategies. It is expected that these findings, being the first in the field of urban planning, will provide valuable input for future studies, encompassing additional parameters and addressing large-scale settlement.
[1] Cutter, S.L., Barnes, L., Berry, M., Burton, C., Evans, E., Tate, E., Webb, J. (2008). A place-based model for understanding community resilience to natural disasters. Global Environmental Change, 18(4): 598-606. http://doi.org/10.1016/j.gloenvcha.2008.07.013
[2] Brand, F., Jax, K. (2007). Focusing the meaning(s) of resilience: Resilience as a descriptive concept and a boundary object. Ecology and Society, 12(1): 23. https://doi.org/10.5751/ES-02029-120123
[3] Manyena, S.B. (2006). The concept of resilience revisited. Disasters, 30(4): 434-450. http://doi.org/10.1111/j.0361-3666.2006.00331.x
[4] Berke, P.R., Kartez, J.D., Wenger, D. (1993). Recovery after disaster: Achieving sustainable development, mitigation, and equity. Disasters, 17(2): 93-109. http://doi.org/10.1111/j.1467-7717.1993.tb01137.x
[5] Cimellaro, G.P., Reinhorn, A.M., Bruneau, M. (2010). Framework for analytical quantification of disaster resilience. Engineering Structures, 32(12): 3639-3649. http://doi.org/10.1016/j.engstruct.2010.08.008
[6] Meerow, S., Newell, J.P., Stults, M. (2016). Defining urban resilience: A review. Landscape and Urban Planning, 147: 38-49. https://doi.org/10.1016/j.landurbplan.2015.11.011
[7] Folke, C., Carpenter, S., Walker, B., Scheffer, M., Chapin, T., Rockström, J. (2010). Resilience thinking: Integrating resilience, adaptability and transformability. Ecology and Society, 15(4): 20. http://doi.org/10.5751/ES-03610-150420
[8] Newman, P., Beatley, T., Boyer, H. (2009). Resilient cities: Responding to peak oil and climate change. Australian Planner, 46(1): 59. http://doi.org/10.1080/07293682.2009.9995295
[9] Başar, A.A. (2023). An approach proposal to vulnerability analysis in urban resilience. International Journal of Geography and Geography Education (IGGE), 48: 145-164. https://doi.org/10.32003/igge.1177863
[10] Davoudi, S., Shaw, K., Haider, L.J., Quinlan, A.E., Peterson, G.D., Wilkinson, C., Fünfgeld, H., McEvoy, D., Porter, L., Porter, L., Davoudi, S. (2012). Resilience: A bridging concept or a dead end? “Reframing” resilience: Challenges for planning theory and practice interacting traps: Resilience assessment of a pasture management system in Northern Afghanistan urban resilience: What does it mean in planning practice? Resilience as a useful concept for climate change adaptation? The politics of resilience for planning: A cautionary note: Edited by Simin Davoudi and Libby Porter. Planning Theory & Practice, 13(2): 299-333. https://doi.org/10.1080/14649357.2012.677124
[11] Pickett, S.T.A., Cadenasso M.L., Grove J.M. (2004). Resilient cities: Meaning, models, and metaphor for integrating the ecological, socio-economic, and planning realms. Landscape and Urban Planning, 69(4): 369-384. https://doi.org/10.1016/j.landurbplan.2003.10.035
[12] Gunderson, L.H. (2000). Ecological resilience—In theory and application. Annual Review of Ecology and Systematics, 31(1): 425-439. https://doi.org//10.1146/annurev.ecolsys.31.1.425
[13] Ersoy, M. (2017). Osmanlıdan Günümüze İmar ve Yasalar [Zoning and Laws from the Ottomans to the Present]. Baskı, Ninova Yayıncılık, İstanbul.
[14] Sengezer, B., Koc, E. (2005). A critical analysis of earthquakes and urban planning in Turkey. Disasters, 29(2): 171-194. http://doi.org/10.1111/j.0361-3666.2005.00279.x
[15] Balamir, M. (2004). Urban seismic risk management: The earthquake master plan of Istanbul (EMPI). In 13th World Conference on Earthquake Engineering Vancouver, B.C., Canada, p. 9005.
[16] AFAD. (2023). Kahramanmaras’ta Meydana Gelen Depremler Hk. [About Earthquakes in Kahramanmaras] Basın Bülteni-36. https://www.afad.gov.tr/kahramanmarasta-meydana-gelen-depremler-hk-36.
[17] AFAD. (2023). Genel Hayata Etkili Afet Bölgesi Hk. [About the Disaster Area Affecting General Life] -BASIN DUYURUSU. https://www.afad.gov.tr/genel-hayata-etkili-afet-bolgesi-hk.
[18] Boğaziçi University Kandilli Observatory and Earthquake Research Institute. (2023). http://www.koeri.boun.edu.tr/sismo/bilgi/sss_tr.htm.
[19] Clark, M., Robertson, A. (2002). The role of the early tertiary ulukişla basin, southern turkey, in suturing of the mesozoic tethysocean. JGeolSoc, 159: 673-690. https://doi.org/10.1144/0016-764902-015
[20] Celik, F., Öztürk, M.Z., Şener, M.F., Arıöz, Ö., Erbil, M. (2021). Mapping investigation based on engineering geology of a developing urban area (Niğde, Turkey). Arabian Journal of Geosciences, 14(14): 1316. https://doi.org/10.1007/s12517-021-07699-8
[21] AFAD. (2023c). Turkey's new earthquake hazard map. https://en.afad.gov.tr/turkeys-new-earthquake-hazard-map-is-published.
[22] Nigde Municipality. (2023). https://www.nigde.bel.tr/nigdede-deprem-sonrasi-hasarli-binalar-tespit-ediliyor.
[23] MTA. (2023). Active fault map of Turkey. https://www.mta.gov.tr/v3.0/bilgi-merkezi/dirifay.
[24] E-Government Gateway. (2023). Çevre, Şehircilik ve İklim Değişikliği Bakanlığı Hasar Tespit Sorgulama ve İtiraz İşlemleri [Ministry of Environment, Urbanization and Climate Change Damage Assessment Inquiry and Objection Procedures]. https://www.turkiye.gov.tr/cevre-ve-sehircilik-hasar-tespit-sorgulama.
[25] TUIK. (2018). https://www.tuik.gov.tr./
[26] Nigde Municipality. (2010). 1/25000 scale environmental plan analytical report.
[27] Nigde Municipality City Guide Application. (2023). https://keos.nigde.bel.tr/keos/.
[28] Fox, J. (2015). Applied Regression Analysis and Generalized Linear Models. Sage Publications.
[29] Hair, J.F., Black, W.C., Babin, B.J., Anderson, R.E. (2014). Multivariate Data Analysis. Pearson.
[30] Gujarati, D.N., Porter, D.C. (2009). Basic Econometrics. McGraw-Hill.
[31] Neter, J., Kutner, M.H., Nachtsheim, C.J., Wasserman, W. (1996). Applied Linear Statistical Models. Irwin.
[32] Godschalk, D.R., Beatley, T., Berke, P.R., Brower, D.J., Kaiser, E.J. (1998). Natural Hazard Mitigation: Recasting Disaster Policy and Planning. Island Press.
[33] Bostenaru Dan, M., Armas, I. (2015). Earthquake impact on settlements: The role of urban and structural morphology. Natural Hazards and Earth System Science, 15(10): 2283-2297. https://doi.org/10.5194/nhess-15-2283-2015
[34] Rahman, M.M., Asikunnaby, Chaity, N.J., Abdo, H.G., Almohamad, H., Al Dughairi, A.A., Al-Mutiry, M. (2023). Earthquake preparedness in an urban area: The case of Dhaka city, Bangladesh. Geoscience Letters, 10(1): 27. https://doi.org/10.1186/s40562-023-00281-y
[35] Mitsova, D., Esnard, A.M., Sapat, A., Lai, B.S. (2018). Socioeconomic vulnerability and electric power restoration timelines in Florida: The case of Hurricane Irma. Natural Hazards, 94: 689-709. https://doi.org/10.1007/s11069-018-3413-x
[36] Li, S.Q. (2023). Empirical vulnerability estimation models considering updating the structural earthquake damage database. Soil Dynamics and Earthquake Engineering, 169: 107864. https://doi.org/10.1016/j.soildyn.2023.107864
[37] Jia, J., Yan, J. (2015). Analysis about factors affecting the degree of damage of buildings in earthquake. Journal of Physics: Conference Series, 628(1): 012062. https://doi.org/10.1088/1742-6596/628/1/012062
[38] Bostenaru Dan, M., Armaş, I., Goretti, A. (2014). Earthquake hazard impact and urban planning—An introduction. Earthquake Hazard Impact and Urban Planning, pp. 1-12. https://doi.org/10.1007/978-94-007-7981-5_1
[39] Yariyan, P., Avand, M., Soltani, F., Ghorbanzadeh, O., Blaschke, T. (2020). Earthquake vulnerability mapping using different hybrid models. Symmetry, 12(3): 405. https://doi.org/10.3390/sym12030405
[40] Saputra, A., Rahardianto, T., Revindo, M.D., Delikostidis, I., Hadmoko, D.S., Sartohadi, J., Gomez, C. (2017). Seismic vulnerability assessment of residential buildings using logistic regression and geographic information system (GIS) in Pleret Sub District (Yogyakarta, Indonesia). Geoenvironmental Disasters, 4(1): 1-33. https://doi.org/10.1186/s40677-017-0075-z