Shaymaa Salim Younus Al-Mashhadani*![]() | Hasan Abdulrazzaq Hasan Al Sanjary
| Hasan Abdulrazzaq Hasan Al Sanjary![]()
© 2024 The authors. This article is published by IIETA and is licensed under the CC BY 4.0 license (http://creativecommons.org/licenses/by/4.0/).
OPEN ACCESS
Since residential apartments are important sources of energy for the world's population, many excellent studies have examined how well-insulated buildings and apartment’s function. However, because of the building's location relative to the equator, the impact of the building on climate data varies, and the role of engineering spaces within the apartment in influencing thermal performance was not discussed in most of these studies. The purpose of this research is to use ECOTECT2011 to examine the thermal loads of virtual residential areas in two different cities: Kuala Lambor, which is located close to the equator, and Mosul, which is located far from it. The study will also examine the ratio of thermal loads in each city to the other, the number of days of rest, and the thermal and transitional period in each city. According to the study's findings, there are more rest days and transition periods in the city close to the equator than in the city farther away. These findings may indicate that space engineering is less effective as a thermal treatment in areas close to thermal extremism.
thermal performance, equator cities, spatial engineering, transition period, thermal rest days
In order to improve the overall level of indoor comfort (thermal, visual, and acoustic comfort as well as indoor air quality), ecological design incorporates natural elements into architectural design [1]. Built to suit local climate conditions. This is all done while lowering energy consumption, as the term "thermal performance in buildings" refers to the quantity of energy needed to achieve the desired environmental conditions while lowering consumption [2] by knowing how to use natural day lighting, heating, and cooling techniques that take into account the needs and climatic conditions of the area [3]. While each individual's experience of heat varies according to age, gender, attire, activity level, cultural norms, and other factors, the fundamentals of thermal comfort are generally the same [4]. To maintain the comfort and health of residents, the interior environment must be planned and managed. Achieving thermal comfort requires creating a thermally neutral environment where people do not require a warmer or colder setting [5]. The differences in climate data resulting from different geographical locations are the most significant aspects of the natural environment that should be integrated with architectural design. That is why our study is so important and why its primary goal is to investigate how far from the equator an object is, how that affects residential apartment spaces' thermal performance, and how that affects occupants' thermal comfort.
Many recent studies have looked at environmental factors and how they influence the decisions that architects make when designing a building. One such study [6] looked at the effect of different climate data derived from different geographic locations on a building's thermal performance. examined how different building envelope features at the three levels (external walls, partitions, and roofs) affect the energy efficiency and thermal performance of four distinct cities located in disparate geographic locations with respect to temperature, humidity, longitude and latitude, and air speed. The study's conclusion corroborated the findings of multiple researchers who showed how variations in a city's climate data affect the thermal behavior of the building envelope, which in turn affects interior building temperatures and occupant comfort [7]. The study's findings indicated a rise in the need for cooling and a decrease in the use of energy for heating. The study looked at how climate change would affect an urban building unit in Greece's energy requirements for heating and cooling. which focused on selecting the optimal thermal shape for four building models for five climate-variable Chinese cities, hoping that the results would provide designers with guidelines and ideas for better design. programs for modeling, simulating, and figuring out how much heat each shape absorbs annually. A study [8] found that the pyramid has the highest annual heat load and that the dome operates at its best thermal efficiency when the wwr ratio is 30% or less. It was reported that the study of a building design model in five European Union countries was published in a roughly north to south pattern and that the decline in heating demand in northern and central Europe is greater than the rise in cooling demand [9]. The aforementioned studies examined the overall thermal behavior of buildings in relation to their geographic locations; however, they did not address the effects of building designs in relation to their proximity to the equator, an imaginary line that divides the globe into equal parts north and south and represents the zero-degree latitude line. Measuring about 24,901 miles in length, only 21.3% of it is on land and the remainder is in water. The equator runs through several countries, mostly in Africa and South America, and only thirteen of those have cities on or near the equator: Sao Tome and Principe, the Democratic Republic of the Congo, the Republic of the Congo, Gabon, Somalia, the Maldives, and Uganda. These include Ecuador, Kiribati, Kenya, Columbia, Brazil, and Indonesia. Its location puts it in close proximity to other cities that are also near the equator, such as Singapore, Nairobi, Guayaquil, Fortaleza, Kuala Lumpur, Manaus, Kampala, Kigali, Pekanbaru, Balikpapan, Libreville, Kuching, Iquitos, and Jayapura Bogota [10]. Residential buildings and apartments' thermal performance away from the equator, as well as how that translates into each of the spaces that comprise an apartment, were not covered in the studies. How can space engineering, in addition, reduce or even eliminate heat loads in tropical cities in comparison to cities situated far from the equator.
The majority of thermal performance studies did not focus on examining the degree to which the climatic data resulting from different geographic locations relative to the equator, and the resulting difference in monthly and total thermal loads, percentages of loads, the number of times of transitional periods, and the amount of variation in thermal loads, affect the thermal behavior of residential apartment spaces.
(1) Estimating the percentages of thermal loads and the overall extent to which residential apartment spaces' various locations in respect to the equator influence their thermal behavior for every month of the year.
(2) Calculating the exact effect of space behavior on climate data, encompassing the quantity of transitional periods, the loads in each, and the magnitude of the thermal load variation in each.
(1) The study found that the monthly thermal loads of the residential apartment spaces varied significantly in terms of thermal performance based on factors such as the percentage of loads, total thermal loads, and proximity to and distance from the equator.
(2) The number of transitional periods, the degree of thermal load variation, the number of rest days, and the highest thermal load values vary significantly depending on an area's distance from the equator.
The study calculates the monthly heat load for the entire year, identifies transitional periods and the degree of thermal variation in each transitional zone for each space, and measures the thermal behavior of the residential apartment spaces that are the subject of the research using the program ECOTECT2011, which is specifically designed to measure the thermal behavior of buildings and contains tools. It uses its own analytics and displays the results in the form of EXCEL tables for the values of refrigeration, air conditioning, and heat loads (during the day, month, or year). Because it is located between latitudes (29 and 37) and represents the researcher's local environment, the Iraqi city of Mosul was selected as an example. It symbolizes the researcher's local surroundings and is situated between latitudes (1-6) degrees. Situated north of the equator, or any city with an equivalent distance from the equator; the comparison of the two previous cases and the ratio of the differences between the cases; and the potential variations in the thermal behavior of residential apartments, especially during the transitional period, which can be represented by the annual decrease and increase in the number of days that residential apartments experience thermal comfort.
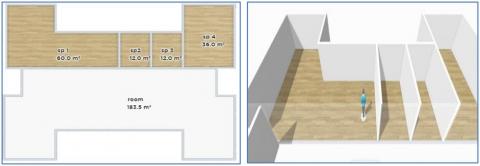
The study's sample consisted of a hypothetical residential apartment with four spaces (a master bedroom, two secondary bedrooms, and a reception room), as depicted in Figure 1, and with each space's conditions and characteristics (such as exposure area and shape factor) as per Table 1. The purpose of this was to test the research hypotheses.
Figure 1. Shows the specific sample in question, which is represented by a fictitious four-room apartment
Table 1. Showing the details of the spaces under study
|
No. |
Name |
Area, m2 |
Exposure Area |
Shape Factor |
|
Space-1 |
Reception and Sitting Room |
60 |
85.98 |
0.353 |
|
Space-2 |
Bedroom-1 |
12 |
10.85 |
0.226 |
|
Space-3 |
Bedroom-2 |
12 |
10.85 |
0.226 |
|
Space-4 |
Master bedroom |
36 |
58.8 |
0.409 |
In addition, it must be installed in both measurement cases in order to accurately assess the impact of the variation in climatic data resulting from the variation in the apartment's distance from the equator as specified in the research. And that the measurement mechanism is the same for any residential apartment that can be selected for testing, with results that vary according to the difference in the apartment's characteristics from the sample above.
Presuming that a residential apartment is the sample selected for the study, the measurement procedure will concentrate on ascertaining the precise influence of the variation in climate data brought about by the apartment's distance from the equator on the behavior of the spaces in the apartment and in two geographically different cities, one near and the other far from the equator. Kuala Lumpur, a tropical country between 100° and 103° E in the eastern hemisphere and between 1° and 6° N in the northern latitude, is characterized by a moderate climate throughout the year, whereas the city of Mosul was known for its extreme summer and winter temperatures [11]. This means that there is a chance that the results will differ clearly and accurately depending on the climate data for the two cities. Its proximity to the equator and the surrounding bodies of water contribute to its extremely unstable climate [12]. It is characterized by temperatures that are typically lower than those found elsewhere [13]. Mosul is located between longitude and latitude (36.09°). There, one experiences hot, dry summers and cold, snowless winters [14]. The weather is extremely hot in the summer and extremely cold in the winter [15]. For the outer cover of the selected apartment, a wall of blocks measuring 15cm in thickness (blcok15cm) and an external cement finish measuring 10 mm (cement plaster 10 mm) were determined as a fixed type. Internal plasterboard finishing measured 20 mm (plaster board 20 mm), as indicated in Table 2, and adopted as a temperature (22-28) as a thermal comfort limit in order to precisely determine the thermal behavior of the apartment spaces. The traditional local building materials that were utilized were selected because they are the most prevalent in the Mosul neighbourhood [16]. can provide basic cues to the designer to help achieve more efficient thermal performance of a residential apartment and lessen the difference in the required air conditioning load between its spaces [17].
Table 2. Wall layers for the external walls and their characteristics/ Prepare the researcher
|
|
Layer Name |
Width, mm |
Density |
Conduction |
|
1 |
Cement plaster |
10 |
2050 |
1.080 |
|
2 |
Block medium weight |
150 |
2300 |
1.490 |
|
3 |
Gypsum plasterboard |
20 |
980 |
0.360 |
In the practical test, the apartment specified in the research is drawn geometrically using the AutoCAD 2021 program, and it is then exported to the Ecotect 2011 program as shown in Figure 2. this allows us to examine how the thermal behavior of residential apartment spaces affects the differences in climate data for two cities that have different climates due to their locations on the equator. Next, as shown in Figure 3, draw the apartment using a three-dimensional model inside a hypothetical residential building. Next, establish a fixed height for each apartment space. Finally, calculate the total thermal loads for each month of the year in the two cases the one near the equator, namely Kuala Lumpur, and the one far from it, namely Mosul by installing the building materials for the spaces' walls and selecting (calculate) from the menu, choosing (thermal analyses), and selecting space load. After the analysis is completed by the program, we visit (monthly load). The numbers of days of thermal comfort when the monthly and annual total thermal loads are calculated are displayed in an Excel file-compatible list. In order to determine the number of days, critical days, and highest value of (HVAC) for each of the two cities under consideration, one can search and calculate within the results file mentioned above, where thermal load values are non-existent. There are two distinct climatic transition zones in Mosul where there are no thermal loads. In order to investigate and elucidate the differences in the thermal behavior of the spaces between them between the two cities (Mosul and Kuala Lumpur), the study will attempt to explain the behavior of the residential apartment spaces selected as a sample for study in one of these two regions and on both sides of it.
Figure 2. Apartment space plan in the Ecotect program
Figure 3. Stereoscopic apartment in the Ecotect software
Due to the difficulty of drawing precise comparisons between the two cities, we divide the work into two levels in order to shed light on the differences in thermal performance between the virtual apartment spaces specified in the research and the cities that are close to the equator, such as Kuala Lumpur in Malaysia, and those that are far from it, such as Mosul in Iraq.
The monthly thermal load, total annual load, and ratio of loads between the far-from-the-equator city of Mosul and the near-equator city of Kuala Lumpur are generally computed as follows. The heat load ratios between Kuala Lumpur, which is near the equator, and Mosul, which is far from it, are determined in the following ways:
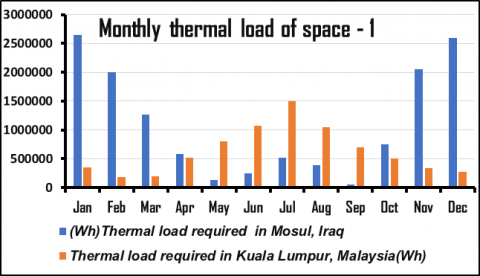
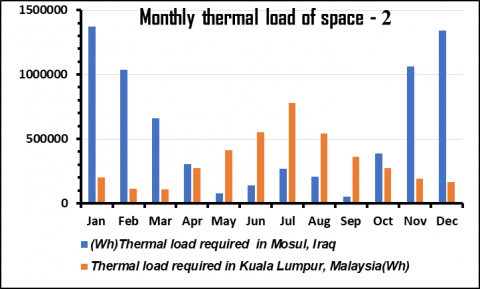
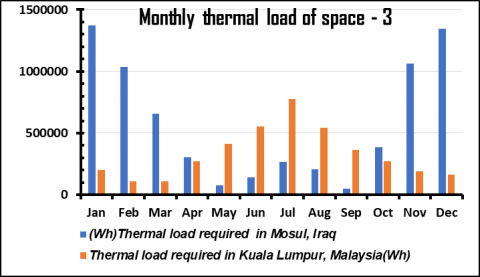
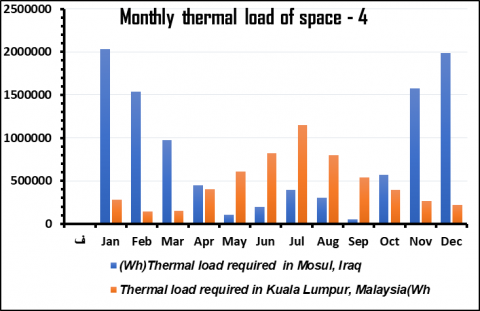
(1) A comparison of the monthly thermal loads for each space in the two cities that are closest to the equator (Kuala Lumpur as a case study) and the furthest from the equator (Mosul as a case study) is presented in Table 3 and Figures 4-7. This shows the results of measuring the monthly thermal loads for each space in the two cities over the course of a year:
The data in Figures 4-7 unequivocally demonstrate that areas (1, 2, 3, 4) in Mosul, Iraq, require a higher heat load than Kuala Lumpur, Malaysia. This is because the two cities' distinct equator-based locations result in disparate climates. The two cities' varying thermal loads are proof that, despite the space's identical dimensions, geometry, and form factor, it performs differently thermally.
The results highlight the limitations of Iraq's high load requirements for the entire year, except for two transitional periods (between May and June and between September and November), which impede efforts to improve thermal performance. Due to the high temperatures there, modifying the geometry of the two locations on either side of Iraq's thermal comfort zones will not improve the spaces and will likely be ineffective.
In comparison, it is evident that any alteration to the geometry, proportions, and shape factor of any given space has a significant positive influence on the overall thermal performance of the residential apartment and each individual space, whereas in Kuala Lumpur, the climate is generally milder and there are lower thermal loads.
Table 3. Monthly thermal load of spaces of case study
|
|
Sp.1 |
Sp.2 |
Sp.3 |
Sp.4 |
||||
|
|
Mosul |
Kuala Lumpur |
Mosul |
Kuala Lumpur |
Mosul |
Kuala Lumpur |
Mosul |
Kuala Lumpur |
|
Jan. |
2647836 |
355954 |
1371146 |
199809 |
1371146 |
199809 |
2029295 |
284079 |
|
Feb. |
2004690 |
183552 |
1038101 |
112187 |
1038101 |
112187 |
1536390 |
144914 |
|
Mar. |
1271106 |
196332 |
658225 |
109288 |
658225 |
109288 |
974173 |
153961 |
|
Apr. |
585919 |
517947 |
303410 |
271408 |
303410 |
271408 |
449047 |
399260 |
|
May |
127586 |
796915 |
75665 |
412672 |
75665 |
412672 |
103118 |
610754 |
|
Jun. |
247336 |
1067021 |
141577 |
552542 |
141577 |
552542 |
195628 |
817763 |
|
Jul. |
519595 |
1501440 |
269065 |
777501 |
269065 |
777501 |
398217 |
1150701 |
|
Aug. |
393926 |
1045950 |
204929 |
541631 |
204929 |
541631 |
302741 |
801614 |
|
Sep. |
58067 |
700725 |
49341 |
362861 |
49341 |
362861 |
52751 |
537034 |
|
Oct. |
747088 |
511405 |
386869 |
271582 |
386869 |
271582 |
572566 |
394917 |
|
Nov. |
2055408 |
332646 |
1064366 |
188393 |
1064366 |
188393 |
1575261 |
261616 |
|
Dec. |
2593348 |
274680 |
1342932 |
162347 |
1342932 |
162347 |
1987538 |
221701 |
Figure 4. Monthly heat load of the first space in the two different cities
Figure 5. Monthly heat load of the second space in the two cities
Figure 6. Monthly heat load of the third space in the two cities
Figure 7. Monthly heat load of the fourth space in the two cities
Table 4. Total thermal load of spaces of case study
|
Space-1 |
Space-2 |
Space-3 |
Space-4 |
||||
|
Mosul |
Kuala Lumpur |
Mosul |
Kuala Lumpur |
Mosul |
Kuala Lumpur |
Mosul |
Kuala Lumpur |
|
13251906 |
7484567 |
6905626 |
3962220 |
6905626 |
396222 |
10176725 |
5778314 |
Table 5. Ratio of loads of Kuala Lumpur to Mosul
|
|
Total Load in Mosul |
Total Load in Kuala Lumpur |
Ratio of Loads of Kuala Lumpur to Mosul |
*100% |
|
Sp-1 |
13251906 |
7484567 |
0.56479174 |
56.4791 |
|
Sp-2 |
6905626 |
3962220 |
0.57376695 |
57.3766 |
|
Sp-3 |
6905626 |
3962220 |
0.57376695 |
57.3766 |
|
Sp-4 |
10176725 |
5778314 |
0.567797 |
56.7797 |
|
|
Average |
|
|
57.003 |
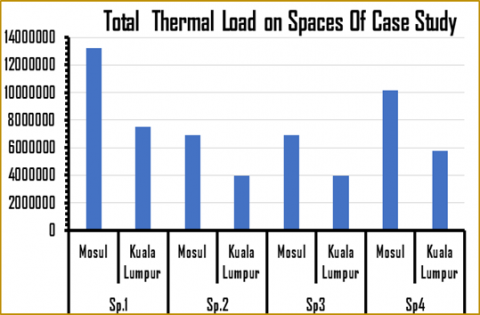
(2) The results of calculating the annual thermal loads for each of the four spaces specified in the research sample, as shown in the following:
Figure 8. The annual heat loads for the four spaces of the apartment in the two cities
Table 4 above shows the results of the total annual thermal loads in the four spaces of the two cities. it is evident from this data that Mosul has higher thermal loads than Kuala Lumpur due to its distance from the equator (Figure 8), which enables better performance. Compared to high thermal loads in Mosul, which are more difficult to eliminate or reduce, moderate thermal loads in Kuala Lumpur are simpler to reduce or even entirely eliminate by changing the proportions of the residential apartment spaces, In Kuala Lumpur, as opposed to Mosul, where there are significant climatic extremes, improving the geometry and proportions of residential apartment spaces has a greater impact on the spaces' thermal performance. This is because any changes made to the proportions can have a positive impact on the thermal performance of the spaces in Kuala Lumpur, which has a moderate climate.
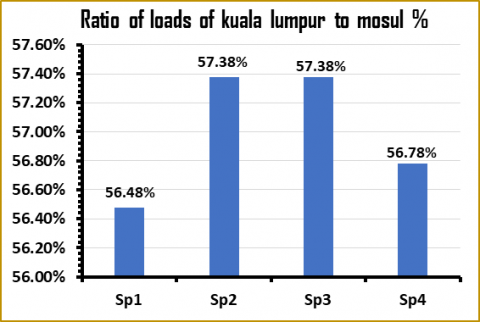
(3) The results of calculating the thermal load ratio between Kuala Lumpur, Malaysia, and Mosul, Iraq, are displayed in Table 5 above and Figure 9:
Figure 9. Ratio of thermal loads of Kuala Lumpur city to Mosul for the four spaces
It includes the results of figuring out the monthly thermal loads for the two cities, four locations, and the entire year. daily thermal loads for each transitional period as well as the number of transitional periods that were measured, which show how the thermal loads varied during each transitional period as follows:
(1) Following a year-long calculation, the monthly thermal loads for each of the research's designated spaces are as follows:
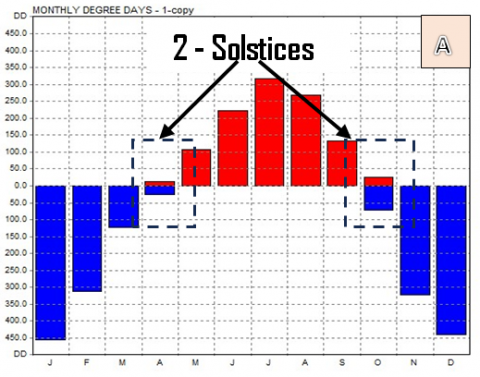
Figures 10, 11, and 12 show the number of yearly transitional periods that occur between two locations that are close to and far from the equator, specifically the cities of Mosul and Kuala Lumpur.
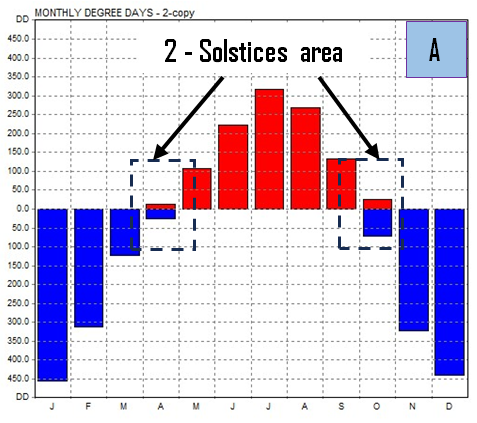
Figure 10. Monthly heat loads for the first space throughout the year in the Ecotect2011 Program:
A. Monthly heat loads in the city of Mosul-Iraq.
B. Monthly thermal loads in the city of Kuala Lumpur-Malaysia
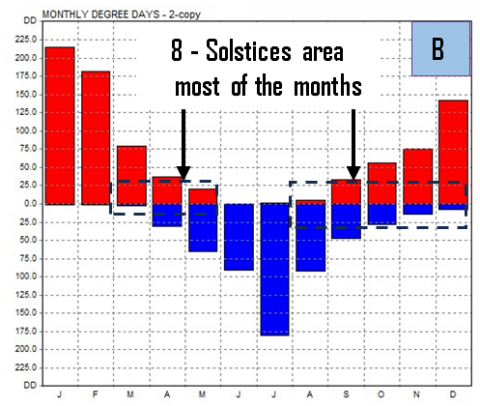
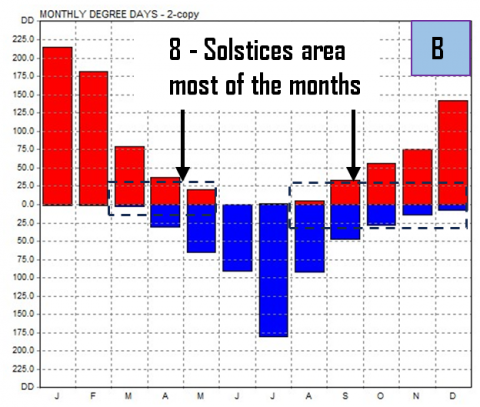
Figure 11. Monthly thermal loads for the second and third spaces throughout the year in the Ecotect 2011 program:
A. Monthly heat loads in the city of Mosul-Iraq.
B. Monthly thermal loads in the city of Kuala Lumpur-Malaysia
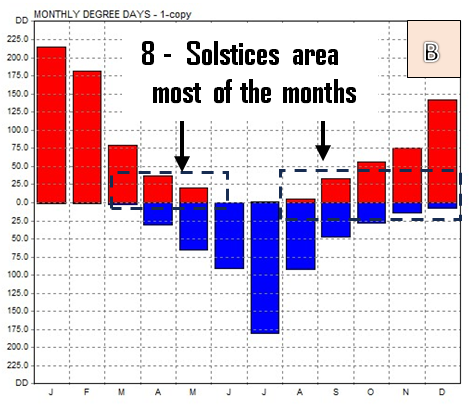
Figure 12. Monthly heat loads for the fourth space throughout the year in the Ecotect 2011 program:
A. Monthly heat loads in the city of Mosul-Iraq.
B. Monthly thermal loads in the city of Kuala Lumpur-Malaysia
The monthly and annual thermal loads for each of the two cities are shown in the aforementioned figures, and it is evident how different they are from one another. For instance, even though both cities share the same space and have the same geometry and shape, Mosul, in Iraq, which has the most extreme climate and is located farthest from the equator, requires higher loads than Kuala Lumpur, in Malaysia. The other spaces mentioned in the research have the same problem, needing higher loads than the others. However, the results above indicate that, as there are only two transitional zones in Mosul, the thermal loads are either heating or cooling loads, with the exception of the months during the transitional period. In Kuala Lumpur, the city has a variety of heating and cooling loads that are needed for the same month. These loads are distributed throughout the year on either side of thermal comfort zones. Figures 10-12 show that it has eight transitional zones. These transitional zones highlight how important it is to improve the shape factor and proportions of each space to improve its thermal performance. In semi-temperate climates and climate data, such as that of Kuala Lumpur, Malaysia, any modification to the shape factor ratio can help each of the understudied spaces experience more thermal rest days and less thermal load requirements.
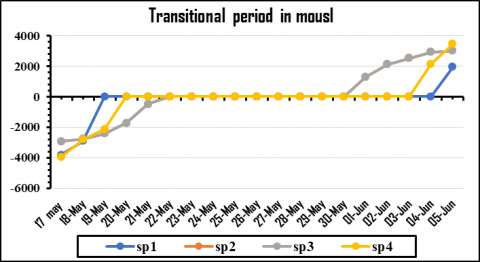
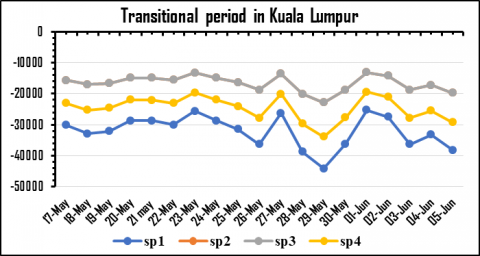
(2) As illustrated in Figures 13 and 14 and for the four rooms that comprise the residential apartment selected for the study, the results of the daily thermal load calculations for the first transitional period are as follows:
For instance, if we look at the procedure of measuring daily thermal loads at the detailed level for a portion of the year and for the four spaces during the transitional period between the two cities, the findings indicate as follows:
Figure 13. Daily heat loads (HVAC) for the city of Mosul in the first transitional period
Figure 14. Daily heat loads (HVAC) for Kuala Lumpur city in the first transition period
According to the research, the four apartment spaces on both sides of the thermal comfort zone in Figure 13 and the city of Mosul, which is the furthest from the equator, experienced high extremes in daily thermal loads during the transitional period. However, the results show that in the nearby city of Kuala Lumpur, there are variations in thermal loads, albeit with slightly lower load values. Compared to the city of Mosul, it is easier and more likely to improve the thermal performance based on the geometry of the spaces there because they are significantly away from the equator and do not experience extreme loads, as evidenced by the thermal performance of the spaces as shown in Figure 14. This is due to Kuala Lumpur's daily thermal loads during transitional periods being less extreme than those of Mosul. By altering or improving the proportions of the residential apartment spaces, the eight can be reduced or eliminated, in contrast to the extreme thermal loads in Mosul on both sides of the thermal comfort zones for the two transitional periods, which are difficult to eliminate or reduce.
(a) The results of the number of days of thermal rest, where (HVAC) for all spaces of the apartment is zero (in each city, as shown in Table 6), and as follows:
Table 6. The number of thermal comfort days
|
Mosul |
Kuala Lumpur |
|
22 |
30 |
It is evident from the above results that Mosul, which is far from the equator, has 22 thermal rest days, which are divided between the two regions of the summer and winter solstices. Nine days occur in May during the period of May 22-30, and three days occur in September during the same period (September 13-25). Kuala Lumpur, on the other hand, is close to the equator, with 30 days of thermal rest distributed throughout the year that are not isolated in areas without the others. This indicates that a more robust application of the coefficient of form and the geometry of spaces could be advantageous for every region. A change in the proportions of the spaces on its sides can improve thermal comfort and increase the number of thermal rest days because it has a greater variety of comfort areas than the rest areas in Iraq, which consisted of only two main areas with a larger size to influence.
(b) As indicated in Table 7, the following are the results of the highest value for environmental control systems, also referred to as HVAC (heating, ventilation, and air conditioning), which are engineering systems that aid in regulating and maintaining the conditions of the built indoor environment:
Table 7. The highest HVAC value for each city
|
Mosul |
Kuala Lumpur |
|
2647836 |
-58790 |
Table 7's results indicate that the value of HVAC (environmental control systems, or engineering systems that aid in controlling internal environmental conditions) is 2, 647, 836 in Mosul and -58,790 in Kuala Lumpur. This disparity highlights the significant differences in climate data between the two cities. they result from the disparity in location with respect to the equator.
(c) The results of the number of critical days, as the HVAC value does not exceed (3000wh) in each of the two cities, as shown in Table 8 as follows:
Table 8. The critical days
|
Mosul |
Kuala Lumpur |
|
17 |
22 |
Table 8's results indicate that there are 17 critical days in Mosul where the HVAC value is less than 3000wh. Kuala Lumpur has 22 critical days, which corroborates all of the earlier findings about the advantages of enhancing space engineering as a means of mitigating environmental damage. Temperature difference with respect to Mosul, the city furthest from the equator.
(1) Thermal performance in homes and apartments is regarded as one of the most important environmental elements that must exist in order to create an interior environment that is suitable for the comfort of the occupants.
(2) Temperatures are considered to have the largest and most significant impact among the variables listed above, as well as in relatively large proportions, regardless of how many environmental variables there are, including humidity, winds, and many others. For this reason, temperatures must be the first variables to be researched during the design and construction process, which is why the general field of research was chosen.
(3) The researcher was very interested in integrating computer programs into a mechanism for measuring and developing designs, both before and after the construction and implementation process, because computer design helps to prevent design errors in buildings. Computer programs are an important tool for measuring the design environment that reflects the reality of the performance of buildings and residential apartments. What is anticipated to happen should be addressed initially to avoid mistakes that could result in significant losses during the implementation process.
(4) Establish a goal for researchers to investigate and examine this area. 4- Ignorance of the geometry and proportions of spaces, particularly in places with varying climates, can lead to environmental design issues that are reflected in the thermal performance of apartments and residential buildings. These issues can be a major cause of many projects failing, their occupants leaving, or the demand for them declining.
(5) The latitude and geographic location of cities with respect to the equator play a major and influential role in the variation in climate data, which is reflected in the thermal performance of buildings in general and residential apartments in particular, where the demand for energy is highest because of the continuous (24-hour) use of the building.
(6) Mosul, the Iraqi city furthest from the equator, had the highest monthly heat loads for the entire year when compared to Kuala Lumpur, Malaysia, which is closest to the equator. This is a natural reflection of Mosul's highest annual heat loads and the differences in climate between the two cities. and for every apartment space included in the study, the overall thermal load percentage in Kuala Lumpur was approximately 57%, which is equivalent to the average thermal load in Mosul. This indicates how well space proportioning adjustments have worked to improve Kuala Lumpur's thermal performance in comparison to Mosul, a city known for its extreme heat.
(7) The transitional period in Mosul is unique and defined by two climatic regions because of the extremes in the local atmosphere, but in Kuala Lumpur, Malaysia, it is cyclical and spread over eight regions over the course of the year. This can be seen in the potential for higher gains in Kuala Lumpur than in Mosul from enhancing the geometry and proportions of spaces to improve thermal performance.
(8) One of the most crucial objectives of the research to improve thermal efficiency was the findings, which confirmed the need for future reviews of the sizes and proportions of spaces in any design and the reduction of the shape factor ratio to the greatest extent feasible.
(9) The fluctuation of daily heat loads during the transitional period in Kuala Lumpur as compared to the extreme daily heat loads in Mosul reflects the preference of engineering spaces for heat treatments in less extreme areas close to the equator rather than in more extreme areas like the city of Mosul or similar in climate. Kuala Lumpur also boasts the largest HVAC system, the highest HVAC values, and the most thermal rest days.
[1] Bugenings, L.A., Kamari, A. (2022). Bioclimatic architecture strategies in Denmark: A review of current and future directions. Buildings, 12(2): 224. https://doi.org/10.3390/buildings12020224
[2] Manzano-Agugliaro, F., Montoya, F.G., Sabio-Ortega, A., García-Cruz, A. (2015). Review of bioclimatic architecture strategies for achieving thermal comfort. Renewable and Sustainable Energy Reviews, 49: 736-755. https://doi.org/10.1016/j.rser.2015.04.095
[3] Taleb, H.M. (2014). Using passive cooling strategies to improve thermal performance and reduce energy consumption of residential buildings in UAE buildings. Frontiers of Architectural Research, 3(2): 154-165. https://doi.org/10.1016/j.foar.2014.01.002
[4] Alwetaishi, M.S. (2016). Impact of building function on thermal comfort: A review paper. American Journal of Engineering and Applied Sciences, 9: 928-945. https://doi.org/10.3844/ajeassp.2016.928.945
[5] Karlsen, L.R. (2016). Design methodology and criteria for daylight and thermal comfort in nearly-zero energy office buildings in Nordic climate. Aalborg Universitetsforlag. https://doi.org/10.5278/vbn.phd.engsci.00103
[6] Kameni Nematchoua, M., Vanona, J.C., Orosa, J.A. (2020). Energy efficiency and thermal performance of office buildings integrated with passive strategies in coastal regions of humid and hot tropical climates in Madagascar. Applied Sciences, 10(7): 2438. https://doi.org/10.3390/app10072438
[7] Tsoka, S., Velikou, K., Tolika, K., Tsikaloudaki, A. (2021). Evaluating the combined effect of climate change and urban microclimate on buildings’ heating and cooling energy demand in a Mediterranean City. Energies, 14(18): 5799. https://doi.org/10.3390/en14185799
[8] Pilli-Sihvola, K., Aatola, P., Ollikainen, M., Tuomenvirta, H. (2010). Climate change and electricity consumption-Witnessing increasing or decreasing use and costs? Energy Policy, 38(5): 2409-2419. https://doi.org/10.1016/j.enpol.2009.12.033
[9] Wakil, M., El Mghari, H., Kaitouni, S.I., El Amraoui, R. (2023). Thermal energy performance of compressed earth building in two different cities in Moroccan semi-arid climate. Energy and Built Environment, 5(5): 800-816. https://doi.org/10.1016/j.enbenv.2023.06.008
[10] Jabal, Z.K., Khayyun, T.S., Alawn, I.A. (2022). Integrated approach for land surface temperature assessment in different topography of Iraq. Engineering and Technology Journal, 40(11): 1465-1486. http://doi.org/10.30684/etj.2022.134581.1241
[11] Jamaludin, N., Mohammed, N.I., Khamidi, M.F., Wahab, S.N.A. (2015). Thermal comfort of residential building in Malaysia at different micro-climates. Procedia-Social and Behavioral Sciences, 170: 613-623. https://doi.org/10.1016/j.sbspro.2015.01.063
[12] Syafrina, A.H., Zalina, M.D., Norzaida, A. (2017). Climate projections of future extreme events in Malaysia. American Journal of Applied Sciences, 14(3): 392-405. https://doi.org/10.3844/ajassp.2017.392.405
[13] Flaih, A.O. (2021). The water-climatic balance of mosul station and al-kut station for the period from (2010-2020). Review of International Geographical Education Online, 11(5): 613-622. https://doi.org/10.33403/rigeo.791623
[14] Hassan Ali, T., Rashad Shaheen, B. (2013). Urban micro-climate in the city of Mosul, Iraq (The effect of urban space characters on air temperature) _ENG. Al-Rafidain Engineering Journal (AREJ), 21(2): 90-97. https://doi.org/10.33899/rengj.2013.72861
[15] Gupta, B., Shankar, P., Sharma, R., Baredar, P. (2016). Performance enhancement using nano particles in modified passive solar still. Procedia Technology, 25: 1209-1216. https://doi.org/10.1016/j.protcy.2016.08.208
[16] Younus, S. (2023). The effect of nano insulating materials on the thermal performance of residential apartments. International Journal of Design & Nature and Ecodynamics, 18(4): 893-903. https://doi.org/10.18280/ijdne.180416
[17] Al-Mashhadani, S.S.Y., Sanjary, H.A.H.A. (2021). The effect of geometrical characteristics and space layout on the efficient thermal performance in residential apartments. In IOP Conference Series: Materials Science and Engineering. IOP Publishing, 1090(1): 012046. https://doi.org/10.1088/1757-899X/1090/1/012046