Werenfridus Taena*![]() | Anggelina Delviana Klau
| Anggelina Delviana Klau![]() | Marce Sherly Kase
| Marce Sherly Kase![]() | Fried Markus Allung Blegur
| Fried Markus Allung Blegur![]() | Felisisima Afoan
| Felisisima Afoan![]()
© 2024 The authors. This article is published by IIETA and is licensed under the CC BY 4.0 license (http://creativecommons.org/licenses/by/4.0/).
OPEN ACCESS
This study aimed to analyze: (1) the causes of spatial interaction between the regencies in West Timor based on horticultural commodities, (2) the existing and optimizing benefits of spatial interactions between the regencies in West Timor based on horticultural commodities. The research was conducted in 5 regencies on Timor Island namely Kupang, TTS, TTU, Belu, and Malaka at wholesale markets which were determined purposive and snowball for traders. Purposive sampling with the criteria of traders who market horticultural products to 4 other districts in West Timor, followed by a snowball to trace traders who provide the intended horticultural products to the destination market. Data analysis uses gravity analysis, and the shortest path multi-object optimization model. The results showed that the variables of cost, population, price, and GDP had a significant effect on spatial interactions; while the transport capacity had no significant effect on spatial interactions. The total benefit of spatial interaction between the regencies in West Timor is IDR 1,055,467,000.-. The benefit of spatial interaction will increase by 65.60% to IDR 1,747,888,918,000.-. Therefore, interactions between regions must pay attention to the number of requests, selling prices, and transportation costs in order to maximize benefits. These findings are useful for policy makers and horticultural traders in determining the number of horticultural commodities marketed at each destination market in 4 districts in West Timor that provide optimum profits.
optimizing, horticultural commodities, spatial interaction, West Timor Indonesia
The Timor Island consists of East Timor (Democratic Republic of Timor Leste) and West Timor (Republic of Indonesia). There are 5 regencies in West Timor namely Kupang, South Central Timor, North Central Timor, Belu, and Malaka. The PDRB data for the 5 regencies is dominated by the agricultural sector with around 30% [1]. Each regency has different agricultural potential so the economic growth of each region will also be different, supported by its interactions with other regions [2]. Horticultural are commodities that have the potential to be developed in West Timor to meet consumption needs while providing economic benefits through added value from the flow of a commodity between regions [3].
The nature of horticultural commodities is generally easily damaged, so harvesting and marketing are carried out almost every day in an area and other areas that interact with that area. The condition is the cause of spatial interaction between the regencies on Timor Island. Interactions between regencies usually follow an urban hierarchy, namely district cities as centers and then redistributed to hinterland areas. The cities that are the centers of the 5 regencies in West Timor are Oelamasi, Soe, Kefamenanu, Atambua, and Betun. These regency cities serve the hinterland region according to their hierarchy [4, 5] stated that the hierarchical distribution differs between cities which encourages the transformation of the rural economy into urban areas, thereby spurring economic growth.
Spatial interactions between districts in West Timor are based on the potential of each district’s horticultural commodities which are marketed to all district capitals in West Timor. The main commodities for each district that meet these criteria include shallots (Kupang), chayote (Soe), carrots (Kefa), tomatoes (Belu) and bananas (Malaka). Studies [6, 7] emphasized that spatial interaction is a reciprocal relationship that influences each other between two or more regions because there is a supply-demand relationship that can affect the speed of development of a region. This spatial interaction can be influenced by demand (population), price, transportation network (distance and cost), transport capacity, and GDP.
The most widely method used for estimating the magnitude of spatial interactions is the gravity model. Gravity analysis measures interactions between regions based on factors that encourage and inhibit interactions between regions. He and Krishnamurthy [8] stated the gravity model has the advantage of analyzing interaction trends between regions based on the comparative advantages of each region.
Therefore, research on the benefits of horticultural commodities based on spatial interactions in West Timor is important to do. Research objectives include analyzing the determinants of spatial interactions between the regencies in West Timor based on horticultural commodities, and analyze the existing and optimizing benefits of horticultural based on spatial interactions between the regencies in West Timor.
2.1 Place and time of research
This research was conducted in West Timor, East Nusa Tenggara Province, which consists of 5 regencies, namely Kupang, South Central Timor, North Central Timor, Belu and Malaka regencies. Ghozali [9] found that several cities that are close to each other can benefit in the form of synergies from interactive city growth due to advanced regional information and transportation networks. The research was conducted from March to October 2022. The research locations are shown in Figure 1.
Figure 1. Location of research
2.2 Types and sources of data
The study uses 2 types of data, namely secondary and primary data. Secondary data were obtained from the Department of Agriculture, Department of Trade, SMEs, Cooperatives, BPS and other agencies. Primary data was obtained by conducting interviews and observations of the local community and government. The validity and reliability of the data refer to Dragan and Isaic-Maniu [10] who stated that a bivariate correlation value>0.3 means valid, and an alpha value >0.6 means reliable.
The primary data population is for traders in all markets in five regencies in West Timor. Sampling for primary data was carried out using the snowball sampling technique, namely tracing the trade flow of each horticultural commodity in the markets in regencies on West Timor. The sample horticultural commodities market includes Oesao Market in Kupang Regency, Soe Inpres Market in TTS Regency, Kefamenanu New Market in TTU Regency, Atambua New Market in Belu Regency and Beiabuk Betun Market in Malaka Regency. The sample of traders is estimated to be 10 people per Regency. Surya et al. [11] stated snowball as a tissue sampling technique in which data collection can be stopped by the researcher if the data meets the data requirements to answer the research objectives. Interviews and observations started first with horticultural commodity traders in the origin market and then conducted interviews and observations with recipient traders in destination markets in other regencies. The researcher conveyed openly to respondents that the data obtained was then analyzed and the research recommendations could be reused by business actors and policy makers.
2.3 Data analysis
Data analysis was carried out using gravity analysis to determine the effect of each variable on the spatial interaction of regencies in West Timor based on horticultural commodities. French [12] stated that the gravity model is a social physics that analyzes the interactions between regions. Variables related to interaction gains are analyzed further to obtain existing interaction benefits, and then an analysis of interaction gain optimization is carried out. The data analysis framework is shown in Figure 2.
Figure 2. Data analysis framework for the interaction of districts in West Timor based on horticultural commodities
2.3.1 Gravity analysis
The basic concept of gravity analysis is analyzing the size and distance between bilateral trade [13]. The gravity model continues to expand, including its application in cross-regional trade with more varied determining factors [14]. Gravity analysis is carried out in panels for the entire regency so that the equation is as follows:
$I=k \frac{X_1^{\beta_1} \cdot X_2^{\beta_2} \cdot X_3^{\beta_3} \cdot X_4^{\beta_4}}{X_5^{\beta_5}}$ (1)
The formula can be estimated using the linear regression method as follows:
Ln (I) = Ln (k) + β1 Ln (X1) + β2 Ln (X2) + β3 Ln (X3) + β4 Ln (X4)- β5 Ln (X5) (2)
Information:
I: Interaction between Regions;
K: Constant;
X1: The population of the i-th regency;
X2: The price of the jth commodity in the i-th regency;
X3: Transportation capacity of the j-th commodity from the i-th regency;
X4: GDP of the i-th regency;
X5: Economic distance to the i-th regency.
2.3.2 Shortest route optimization analysis
Data analysis uses the development of a transportation model to answer optimization problems. The transportation model is used to solve the problem of distributing a commodity from a number of sources (supply) to a number of destinations (demand) with minimum distribution costs [15]. The transportation model considers that each source is able to supply a certain number of commodity units and each destination has a certain demand [16].
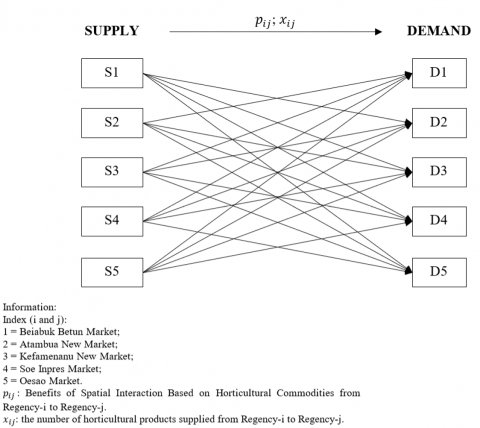
The shortest route optimization model is most suitable to use because it measures interactions from one point of origin to several destination points [17]. The shortest route is indicated by the shortest distance or can be replaced by the fastest travel time or minimum cost [18]. This research uses minimum distribution costs, which can provide maximum profits from the distribution of horticultural commodities to each district in West Timor, Indonesia. This research problem is solved using a transportation model that has been developed with the basic principles: (a) There is more than one commodity being distributed; (b) each commodity is distributed from a different source; (c) each source becomes the destination for the distribution of other commodities; (d) each regency in West Timor becomes a source for distribution of superior commodities and wholesale markets in different districts become distribution destinations; and (e) the objective of the model is to maximize profits. The illustration is shown in Figure 3.
Figure 3. Transportation model for optimizing spatial interactions of regencies in west Timor based on horticultural commodities
The general form of the shortest route optimization model is as follows [19]:
Objective Function
$\max Z=\sum_{i=1}^5 \sum_{j=1}^5 \sum_{k=1}^5 p_{i j k} x_{i j k}$
Information:
i: regency supply index, namely i=1, 2, …, 5;
j: regency demand index, i.e. i=1, 2, …, 5;
k: commodity index, namely i=1, 2, …, 5;
Z: maximum profit to be obtained (IDR);
P-ijk: net profit of commodity K supplied from regency i to regency j (IDR/kg);
X-ijk: the amount of commodity K supplied from regency i to regency j.
Constraint Function
Supply Constraints
Each district has a number of production/supply of certain superior commodities. This constraint is to ensure that the number of products distributed to each district does not exceed the existing production/supply.
$\sum_{j=1}^5 \sum_{k=1}^5 x_{i j k} \leq s_i, \forall i$
Demand Constraints
Each district has a certain demand for comparative commodities from each district in West Timor. This constraint is to ensure that the number of products that enter each district does not exceed the existing demand.
$\sum_{j=1}^5 \sum_{k=1}^5 x_{i j k} \leq d_i, \forall i$
Transport Capacity Constraints
Each district transports comparative products to be distributed to other regencies using transportation vehicles with a certain capacity with a certain frequency in a year. This constraint ensures that the total amount of product transported during a year does not exceed the annual transport capacity.
$\sum_{j=1}^5 \sum_{k=1}^5 x_{i j k} \leq c_i, \forall i$
Non-Negative Constraints
This constraint ensures that the number of products transported is not negative.
$x_{i j k} \geq 0, \forall i, j, k$
The optimization technique used to complete the shortest route optimization model is the simplex method [20], and is completed using LINGO 11 software [21]. Validate the results of optimizing horticultural commodity benefits from interactions between districts compared with existing benefits so that the percentage increase in benefits is known.
The results and discussion begin by describing the results of the complete model gravity analysis with variables that have a significant and insignificant effect on interactions between regions. The next section describes the benefits obtained by each region producing horticultural commodities as a result of its interactions with other regions. The benefits of this interaction can be increased through the allocation of the number of commodities in each trade destination area so that optimization profits are achieved. The results of the gravity analysis and the interaction benefits of each region and their optimization are the basis for recommending policies.
3.1 Spatial interaction based on horticultural agriculture in regencies on the Timor Island
Spatial interactions between regions spur economic growth in a region or other interacting regions. Economic development in one region is influenced by economic activity in that region and its interaction with other regions, which shows the importance of spatial linkages between regions. Anwar and Wicaksono [22] stated that interactions between economic sectors, space, and interactions between development actors within and between regions are important for regional development.
Spatial interactions are usually driven by several factors such as the number of requests for a product from other regions, population, distance, transportation costs, and regional income. The interaction between the regencies in West Timor based on horticultural commodities is measured by gravity analysis. The gravity model can estimate the attractiveness of an area compared to other areas around it. Studies [23, 24] use it to analyze trade patterns and spatial interactions. Inter-regional interactions can be seen from the number of trips to transport commodities between regions as the dependent variable, and the independent variables including economic distance or transportation costs (X1), population (X2), commodity prices (X3), commodity transport capacity (X4), and gross domestic product (X5).
The results of the classical assumption test show that the data is normally distributed (according to the P-Plot test where the data is spread along a diagonal line), there is no heteroscedasticity (according to the scatter plot the data is spread randomly), there is no multicollinearity (according to the results of partial correlation analysis where the tolerance value is>0.01), and there is no autocorrelation (according to the Durbin-Watson value which is 1.71 or close to 2). Sugestiadi and Basuki [25] stated that classical assumption tests are important to ensure that the results of subsequent analysis are not biased. The results of the analysis of the influence of spatial interactions between districts in West Timor based on agricultural commodities are shown in Table 1.
Table 1. Results of spatial interaction gravity model analysis between regencies in West Timor
|
Model |
Unstandardized Coefficients |
Standardized Coefficients |
T |
Sig. |
|
|
B |
Std. error |
Beta |
|||
|
(Constant) |
48.416 |
5.173 |
|
1.403 |
.170 |
|
Economic distance |
-.369 |
.339 |
-.464 |
3.090 |
.002 |
|
Population |
.004 |
.678 |
.004 |
3.006 |
.005 |
|
Price of commodity |
.160 |
.160 |
.198 |
2.998 |
.001 |
|
Capacity of transportation |
.425 |
18.500 |
-.236 |
3.374 |
.704 |
|
GDP |
.908 |
.647 |
-.073 |
-.116 |
.000 |
|
a. Dependent variable: the number of trips |
|||||
1. Goodness of Test
The results of the gravity analysis showed that the determinant coefficient (R-square) of the estimated function is 55%; which means that the independent variables included in the gravity model (distance economics, population, price, capacity, GRDP) are able to explain the variation of the dependent variable (spatial interaction) by 55%, while 45% are influenced by other variables outside the gravity model. The results of the F test show its significance at α=5%, which means that simultaneously the variable amount of production, population, commodity prices, GRDP, and distance has a significant effect on sales frequency.
2. Partial Test
The t test aims to determine each independent variable that individually has a significant effect on trip frequency (number of trips). Based on the results of the t test it can be seen that:
a. Cost
The cost variable has a significant effect (α=5%) on the frequency of trips with a coefficient value of -0.369 meaning that the higher the cost of interaction to a region will cause a decrease in the frequency of marketing of horticultural commodities between regions (reducing interaction between regions by 0.369%). Tomatoes produced in Belu Regency are marketed more in Atambua and Betun (Malaka Regency) due to lower transportation costs compared to other areas in West Timor. Likewise, Kupang shallots are marketed more in Kupang and TTS (the regency nearly Kupang Regency) compared to other areas in West Timor due to the low cost of transportation. This is in line with the researches [24, 26] stating that the physical and economic distance factors between regions greatly influence the amount of interaction, and the closer the distance between regions, the higher the interaction between regions. The implication is that the benefits obtained are smaller in areas that require much greater costs to carry out interactions compared to areas with smaller interaction costs.
b. Total population
The population is significant at α=0.05 with a coefficient value of 0.004 meaning that an increase in the population in a district increases the demand for agricultural commodities in other areas by 0.004%. The increase in the population in the interaction destination area (horticultural commodity marketing) in West Timor also encourages higher interaction between regions due to the increasing demand for horticultural commodities. As found by studies [27-29] that the amount of interaction or trade between regions is proportional to the size of the population and their activities. The consequence of a larger population is a higher demand for agricultural products, as research results show that the demand for horticultural commodities studied is dominated (53%) by Kupang and TTS Regencies which have a larger population than other districts in West Timor. The implication is that there is a need for growth centers in other districts to attract permanent or temporary population migration, thereby increasing demand for horticulture in a region.
c. Prices of agricultural commodities
Commodity prices are one of the variables that determine the level of interaction between regions. The results of the analysis explain that the price horticultural commodity variable has a significant effect (α=1%) on the dependent variable with a value of 0.160 meaning that every 1% increase in horticultural commodity prices in neighboring areas causes an increase in spatial interaction of 0.16%. The prices of horticultural commodities in West Timor differ between districts, which has implications for the marketing of horticultural commodities more to regions with higher commodity prices, but marketing to other regions is still maintained to maintain price stability. In line with previous findings from studies [30, 31] also shows that the price variable determines the interaction between regions.
d. Transport capacity
The transport capacity of horticultural commodities does not have a significant effect, because the horticultural commodities that are transported generally use vehicles with the same capacity with the aim of reducing damage to horticultural commodities due to displacement. The implication is that to increase transport capacity, it is necessary to carry out good packaging to reduce damage due to collisions and at the same time increase the added value of agricultural products. Stockwell et al. [32] stated that the transport capacity and movement of agricultural commodities causes collisions and vibrations which have an impact on damage to horticultural commodities so that packaging before transfer needs to be done properly.
e. GDP
The Gross Domestic Product (GDP) variable has a significant effect on interactions at 5% alpha with a coefficient value of 0.978, which means that a 1% increase in GDP increases interaction by 0.978%. GDP is significant because a higher GDP in an area also indicates a higher per capita income of the population so that people’s purchasing power also increases. The highest GRDP is in Belu and Kupang regencies, so sales of horticultural commodities are relatively high in these two regencies. The implication is that economic activity between sectors in the two regions will increase so that economic growth also increases, as studies [33, 34] explain that spatial linkages are determined by GDP and at the same time determine the growth of GDP per capita of a region and the other regions that are interacting.
3.2 Benefits of spatial interaction between regencies in West Timor based on horticultural commodities
3.2.1 Existing benefits of spatial interaction
Figure 4. The total existing benefits from regencies interaction in West Timor based on horticultural commodities
Table 2. Existing benefits of regencies interaction in West Timor based on horticultural commodities
|
Commodity |
Kupang (IDR) |
TTS (IDR) |
TTU (IDR) |
Belu (IDR) |
Malaka (IDR) |
|
Shallot |
720,576,240,000 |
11.720,800,000 |
7,612,800,000 |
7,612,800,000 |
5,690,880,000 |
|
Chayote |
5,023,200,000 |
17,013,440,000 |
4,979,520,000 |
2,839,200,000 |
712,920,000 |
|
Carrots |
64,000,000 |
67,500,000 |
72,555,000 |
64,000,000 |
64,000,000 |
|
Tomato |
6,661,200,000 |
6,624,800,000 |
6,610,240,000 |
40,542,112,000 |
5,001,360,000 |
|
Banana |
1,707,264,000 |
1,901,120,00 |
3,319,680,000 |
1,667,120,000 |
197,318,772,000 |
Spatial interactions based on horticultural commodities that are competitive in West Timor (such as Kupang onions, TTS chayote, TTU carrots, Belu tomatoes and Malaka bananas) provide added value for horticultural commodities. Spatial interactions, often depend on the potential of other locations that are neighboring [35]. The results of the analysis of the existing benefits of regencies interaction based on horticultural commodities in West Timor are shown in Table 2 and the total benefits interactions are shown in Figure 4.
Based on the results of the analysis, it is known that the total interaction value of horticultural commodities is IDR 1,054,056,247,000,- with the highest interaction value being shallots from Kupang Regency and the lowest being carrots from TTU Regency. Each district generally prioritizes the marketing of horticultural commodities in their own district, while the marketing of their commodities to other districts (spatial interaction) is still relatively low. This has an impact on low commodity prices in areas producing horticultural commodities so that the profits are also low. Juanda [36] stated that the price-quantity relationship is quite sensitive and differs between commodities and regions.
Some areas that are neighboring have the same potential so that the demand for these commodities from neighboring areas is relatively less than other districts in West Timor. For example, carrots from TTU Regency which is adjacent to TTS Regency. The same goes for tomatoes from Belu Regency, which is a neighboring area to Malaka Regency. The condition indicates that each regency obtains a spread effect from the interaction of horticultural commodities, with the largest spread effect being obtained by Kupang Regency due to economic agglomeration and ease of access as determining factors of competitiveness. Celik and Guldmann [37] stated that autocorrelation can also occur in Cross Section data (for example: neighboring areas); as Belu and Malaka Regencies in terms of tomato commodity, so do TTU and TTS Regencies for carrots because the adjacent sub-districts cultivate the same commodity with the same competitiveness.
3.2.2 Optimum benefits of spatial interaction
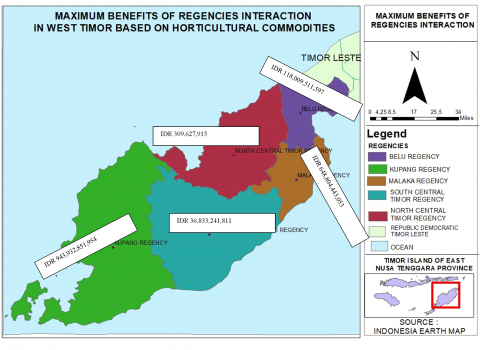
The optimization model for the distribution of horticultural products between Belu, Malaka, TTU, TTS and Kupang Regencies was built based on the following: (i) The model aims to determine the amount of horticultural products that must be sent to maximize benefit and meet the demands of each district, (ii) Each the district has one main commodity, namely tomatoes for Belu Regency, bananas for Malaka Regency, carrots for TTU Regency, chayote for TTS Regency, and shallots for Kupang Regency, (iii) Each district distributes its superior commodities to other regencies based on demand, and (iv) The revenue of each district is determined by the selling price and the cost of transporting the commodity. Irsyad and Syahnur [38] stated that the optimization model that takes into account the origin and destination of the commodity also determines the benefit earned. The maximum benefits of the spatial interaction of the regencies in West Timor based on the horticultural commodities are shown in Table 3 and the total benefits of each regencies interaction are shown in Figure 5.
Table 3. Maximum benefit of regencies interaction in West Timor based on horticultural commodities
|
Commodity |
Kupang (IDR) |
TTS (IDR) |
TTU (IDR) |
Belu (IDR) |
Malaka (IDR) |
|
Shallot |
111,946,500,000 |
25,956,580,679 |
197,112,841,530 |
206,525,999,262 |
402,390,930,482 |
|
Chayote |
11,550,485,054 |
3,126,000,000 |
5,742,354,030 |
16,032,773,077 |
381,629,650 |
|
Carrot |
56,248,500 |
67,219,250 |
99,420,000 |
26,095,875 |
60,644,290 |
|
Tomato |
62,465,852,459 |
25,141,200,000 |
18,894,791,300 |
3,070,080,000 |
8,437,587,838 |
|
Banana |
214,099,663,842 |
257,731,979,869 |
161,170,339,597 |
4,785,294,245 |
11,017,165,500 |
Figure 5. The total maximum benefits from regencies interaction in West Timor based on horticultural commodities
Production of horticultural commodities in West Timor is able to meet 80% of the demand with the lowest percentage being 72% for chayote and the highest percentage being 87% of bananas. The results of the optimization analysis show that the maximum benefit obtained from the interaction between the regencies in West Timor based on horticultural commodities is IDR 1,747,889,676,000.-. The percentage increase in spatial interaction gains in general is 65.83%. The details of economic growth each successively are bananas from Malaka Regency at 215.60%, tomatoes from Belu Regency at 81.68%, shallots from Belu Regency at 25.37%, chayote from TTS Regency at 21.52% and carrots by 0.01%; or in other words, the existing advantage of spatial interaction of the carrot commodity from TTU Regency is already optimal, while the interaction for other commodities from 4 Regencies in West Timor is not optimal. Conditions indicating that if the interaction is optimized it will spur an increase in regional income or regional economic growth; as stated by Hasanah [39] that spatial interaction has a positive impact on economic growth.
3.3 Spatial interaction and its implications for agricultural development
Spatial interactions occur due to differences in the competitiveness of horticultural commodities between districts in West Timor, Indonesia, so that it requires the optimal design of the shortest route for marketing agricultural products between regions. Optimizing spatial interactions that are able to increase the impact of inflows of funds to the regions encourages economic growth. Cong and Van [40] stated that the flow of funds from outside the region spurred economic growth in regions in Indonesia.
The spatial interaction of agricultural commodities spurs agricultural productivity growth, as found by Widyawati [41]. In addition, spatial interaction also indirectly encourages the growth of other economic sectors, such as transportation and trade, thereby increasing regional income multiplier. The spatial interaction of agricultural commodities in West Timor has implications for agricultural development policies as follows:
The results of the gravity analysis state that the variables that have a significant influence on the spatial interactions of districts in West Timor based on horticultural commodities include economic distance, population, horticultural commodity prices and GRDP; while the transportation capacity of horticultural commodities has no significant effect. The results of the analysis also show that the benefits of existing spatial interactions are IDR. 1,054,056,247,000,- which if optimized will increase the benefit to Rp. 1,747,889,676,000,- or economic growth of 65.83%. Therefore, in general, it is recommended to determine the competitiveness of horticultural commodities not only using conventional approaches (such as base sectors and growth shifts) but also considering the results of gravity models and optimization. In particular, appropriate decisions are needed in allocating the distribution of horticultural products per district in West Timor, so that they can provide optimal benefits. Likewise, it is important to increase the added value of horticultural products by packaging more attractively and reducing the risk of damage in interactions between regions. In addition, increasing cooperation between districts on Timor Island through the development of road infrastructure is needed to increase mutually beneficial interactions between districts. Further study is needed regarding the attractiveness of the origin area and the attractiveness of the destination area.
We would like to thank LPPM Timor University for funding this research.
[1] Badan Pusat Statistik Provinsi NTT. (2022). Provinsi Nusa Tenggara Timur Dalam Angka Tahun 2022. Bapan Pusat Statistik Provinsi NTT.
[2] Amelia, S., Rustiadi, E., Barus, B., Juanda, B. (2022). Spatial analysis of region interaction of west-east corridor’s strategic economic area of West Sumatera Province, Indonesia. Journal of Socioeconomics and Development, 5(1): 53-63. https://doi.org/10.31328/jsed.v5i1.3247
[3] Lestari, A.S., Santoso, E.B. (2018). Identifikasi aliran nilai tambah komoditas unggulan buah naga di Kabupaten Banyuwangi. Jurnal Teknik ITS (SINTA: 4, IF: 1.1815), 7(2): C119-C124. https://doi.org/10.12962/j23373539.v7i2.32485
[4] Kaya, H.S., Dökmeci, V. (2017). Development of urban hierarchies at the country and regional levels in Turkey. A/Z ITU journal of Faculty of Architecture, 14(2): 131-149. https://doi.org/10.5505/itujfa.2017.16878
[5] Mardiansjah, F.H., Sugiri, A., Ma’rif, S. (2021). Examining small-town growth and expansion in peri-urban areas of small cities: Evidence from peripheries of three small cities in Central Java. Journal of Regional and City Planning, 32(3): 216-232. https://doi.org/10.5614/jpwk.2021.32.3.2
[6] Rodrigue, M., Magnan, M., Boulianne, E. (2013). Stakeholders’ influence on environmental strategy and performance indicators: A managerial perspective. Management Accounting Research, 24(4): 301-316. https://doi.org/10.1016/j.mar.2013.06.004
[7] Cornils, B., Herrmann, W.A., Beller, M., Paciello, R. (2017). Applied homogeneous catalysis with organometallic compounds: A comprehensive handbook in four volumes.
[8] He, Z.G., Krishnamurthy, A. (2013). Intermediary asset pricing. American Economic Review, 103(2): 732-770. https://doi.org/10.1257/aer.103.2.732
[9] Ghozali, F. (2012). Pengaruh return on asset (ROA), earning per share (EPS), dan debt to equity ratio (DER) terhadap harga saham (studi pada perusahaan properti yang listing di bursa efek Indonesia tahun 2007-2011). Jurnal Ilmiah Mahasiswa FEB, 1(2).
[10] Dragan, I.M., Isaic-Maniu, A. (2013). Snowball sampling completion. Journal of Studies in Social Sciences, 5(2): 160-177.
[11] Surya, B., Ahmad, D.N.A., Sakti, H.H., Sahban, H. (2020). Land use change, spatial interaction, and sustainable development in the metropolitan urban areas, South Sulawesi Province, Indonesia. Land, 9(3): 95. https://doi.org/10.3390/land9030095
[12] French, S. (2017). Comparative advantage and biased gravity. UNSW Business School Research Paper, 2017(3): 1-46. https://doi.org/10.2139/ssrn.2913921
[13] Kabir, M., Salim, R., Al-Mawali, N. (2017). The gravity model and trade flows: Recent developments in econometric modeling and empirical evidence. Economic Analysis and Policy, 56: 60-71. https://doi.org/10.1016/j.eap.2017.08.005
[14] Taha, R., Al-Harthy, A., Al-Shamsi, K., Al-Zubeidi, M. (2002). Cement stabilization of reclaimed asphalt pavement aggregate for road bases and subbases. Journal of Materials in Civil Engineering, 14(3): 239-245. https://doi.org/10.1061/(ASCE)0899-1561(2002)14:3(239)
[15] Taylor, B.D., Fink, C.N.Y. (2013). Explaining transit ridership: what has the evidence shown? Transportation Letters, 5(1): 15-26. https://doi.org/10.1179/1942786712Z.0000000003
[16] Coco, M.I., Dale, R. (2014). Cross-recurrence quantification analysis of categorical and continuous time series: An R package. Frontiers in Psychology, 5: 510. https://doi.org/10.3389/fpsyg.2014.00510
[17] Sun, Y.H., Halgamuge, S. (2019). Minimum-cost heterogeneous node placement in wireless sensor networks. IEEE Access, 7: 14847-14858. https://doi.org/10.1109/ACCESS.2019.2894117
[18] Sarker, R.A., Newton, C.S. (2007). Optimization modelling: A practical approach. CRC press.
[19] Goldfarb, C.F. (1990). The SGML handbook. Oxford University Press.
[20] Khalid, R., Mohd Nawawi, M.K., Baten, M.A., Ishak, N. (2018). Analyzing and optimizing pedestrian flow through a single route in a topological network. International Journal of Engineering & Technology, 7(2.14): 43-47. https://doi.org/10.14419/ijet.v7i2.14.11152
[21] Rustiadi, E. (2018). Perencanaan dan pengembangan wilayah. Yayasan Pustaka Obor Indonesia.
[22] Anwar, A.A., Wicaksono, A. (2022). Gravity model to understand China international trade. Valuta Jurnal Administrasi Bisnis, Manajemen dan Ekonomi, 8(2): 77-84. https://doi.org/10.25299/valuta.2022.v8i2.10113
[23] Cai, M. (2023). A calibrated gravity model of interregional trade. Spatial Economic Analysis, 18(1): 89-107. https://doi.org/10.1080/17421772.2022.2081715
[24] Gujarati, D.N., Porter, D.C. (2013). Basics of econometrics edition 5 book 2. Jakarta: Salemba Empat.
[25] Sugestiadi, M.I., Basuki, Y. (2019). Pengaruh interaksi spasial antara kota Surakarta dengan Kawasan perkotaan sekitarnya terhadap pertumbuhan perkotaan. Jurnal Pembangunan Wilayah dan Kota, 16(3): 173-186. https://doi.org/10.14710/pwk.v16i3.21948
[26] Tan, H.S.G., van den Berg, E., Stieger, M. (2016). The influence of product preparation, familiarity and individual traits on the consumer acceptance of insects as food. Food Quality and Preference, 52: 222-231. https://doi.org/10.1016/j.foodqual.2016.05.003
[27] Mulyawan, T.I., Barus, B., Firdaus, M. (2015). Potensi ekonomi dan arahan pengembangan perekonomian wilayah di Desa-Desa Penyangga Taman Nasional Ujung Kulon. Jurnal Ilmu Tanah Dan Lingkungan, 17(1): 25-32. https://doi.org/10.29244/jitl.17.1.25-32
[28] Hassan Khayat, S. (2019). A gravity model analysis for trade between the GCC and developed countries. Cogent Economics & Finance, 7(1): 1703440. https://doi.org/10.1080/23322039.2019.1703440
[29] Maimun, P.A. (2022). The effect of product quality on consumer satisfaction at Bakso Cuanki Serayu in Bandung, Indonesia. International Journal Administration Business & Organization, 3(3): 46-57. https://doi.org/10.61242/ijabo.22.223
[30] Lu, J.Y., Carbone, G.J., Gao, P. (2017). Detrending crop yield data for spatial visualization of drought impacts in the United States, 1895-2014. Agricultural and Forest Meteorology, 237: 196-208. https://doi.org/10.1016/j.agrformet.2017.02.001
[31] Aba, I.P., Gana, Y.M., Ogbonnaya, C., Morenikeji, O.O. (2012). Simulated transport damage study on fresh tomato (lycopersicon esculentum) fruits. Agricultural Engineering International: CIGR Journal, 14(2): 119-126.
[32] Stockwell, C.E., Jayarathne, T., Cochrane, M.A., Ryan, K.C., Putra, E.I., Saharjo, B.H., Nurhayati, A.D., Albar, I., Blake, D.R., Simpson, I.J., Stone, E.A., Yokelson, R.J. (2016). Field measurements of trace gases and aerosols emitted by peat fires in Central Kalimantan, Indonesia, during the 2015 El Niño. Atmospheric Chemistry and Physics, 16(18): 11711-11732. https://doi.org/10.5194/acp-16-11711-2016
[33] Wajdi, N., Adioetomo, S.M., Mulder, C.H. (2017). Gravity models of interregional migration in Indonesia. Bulletin of Indonesian Economic Studies, 53(3): 309-332. https://doi.org/10.1080/00074918.2017.1298719
[34] Rinaldi, A., Djuraidah, A., Wigena, A.H., Mangku, I.W., Gunawan, D. (2017). Spatial extreme models with copula to determine extreme rainfall zone. Applied Mathematical Sciences, 11(27): 1327-1336. https://doi.org/10.12988/ams.2017.74124
[35] Sanyal, R.K., Mukhopadhyay, N., Mitra, A. (2021). Demand and supply cross-explanation and their magnitude in changing open market economy. International Journal of Recent Scientific Research, 12(3): 41163-41171. https://doi.org/10.24327/ijrsr.2021.1203.5839
[36] Juanda, B. (2009). Ekonometrika pemodelan dan pendugaan. Klaten : IPB Press.
[37] Celik, H.M., Guldmann, J.M. (2007). Spatial interaction modeling of interregional commodity flows. Socio-Economic Planning Sciences, 41(2): 147-162. https://doi.org/10.1016/j.seps.2005.10.003
[38] Irsyad, M., Syahnur, S. (2018). Interaksi spasial ekonomi di Indonesia. Jurnal Ilmiah Mahasiswa Ekonomi Pembangunan, 3(4): 475-483.
[39] Hasanah, R.S. (2020). The role of capital inflow through saving-investment framework: The case of Indonesia. Jurnal Perencanaan Pembangunan: The Indonesian Journal of Development Planning, 4(1): 1-26. https://doi.org/10.36574/jpp.v4i1.95
[40] Cong, B.T., Van, T.Q. (2021). The impacts of spatial interaction on agricultural productivity and average income: A case of Vietnam. Journal La Sociale, 2(2): 12-20. https://doi.org/10.37899/journal-la-sociale.v2i2.372
[41] Widyawati, R.F. (2017). Analisis keterkaitan sektor pertanian dan pengaruhnya terhadap perekonomian Indonesia (analisis input ouput). Jurnal Economia, 13(1): 14-27.