Merad Boudia Mehdi![]() | Nassera Ghellai
| Nassera Ghellai![]() | Miloud Benmedjahed*
| Miloud Benmedjahed*![]() | Abdeldjalil Dahbi
| Abdeldjalil Dahbi![]()
© 2024 The authors. This article is published by IIETA and is licensed under the CC BY 4.0 license (http://creativecommons.org/licenses/by/4.0/).
OPEN ACCESS
In this paper, the wind potential of Tindouf located in southern Algeria has been estimated; to determine wind characteristics (distributions and wind rose) and evaluate the wind energy density, the Weibull distribution model is a widely used method for calculating wind frequency distribution. The study used the maximum likelihood method to estimate the wind speed and direction. The wind speed class was found to be the most prevalent in autumn and winter, with the highest percentage in spring and summer. The wind power density of Tindouf was found to be 224.37 W/m2, with the dominant sector being the west, accounting for 29.4% of wind time. The wind speed classes were most prevalent in the eastern sector, accounting for 20.4% of wind time. The wind power density varied from 121.60 W/m2 in August to 335.85 W/m2 in April, with the average seasonal density varying from 161.38 W/m2 in autumn to 280.87 W/m2 in spring. Tindouf location is classified as part of the PNL 4th classes, making it an ideal location for wind farms. Wind turbine rows must be oriented perpendicular to the west, generating energy continuously from January until peaking in May.
wind, Weibull, wind rose, wind energy, Algeria
In the pandemic (COVID-19) period, the instability of energy market is notable due to demand increasing, on one hand, and to the inevitable depletion of fossil fuel resources, on the other hand. Renewable energies offer a fresh approach to deploynew clean and renewable resources to fulfill the world's growing energy demands [1].
Wind energy is a renewable energy source, clean and safe, sustainable and efficient. However, the wind potential study is mandatory tachometer suitable wind farm and its orientation, also to estimate its energy production before its installation Additionally, understanding the potential challenges and limitations of wind energy in Tindouf will contribute to the overall goal of transitioning away from fossil fuels and addressing climate change. By examining the relationship between the global energy market, renewable energy importance, and specifically focusing on wind energy in southern Algeria, this research aims to provide valuable insights for policymakers and stakeholders in promoting sustainable energy solutions [2].
There is a significant wind potential in south of Algeria. So, it is very important to estimate it for exploiting this wind potential to produce the energy answer population's energy needs. Several Algerian studies on wind energy resources have been conducted: Merzouk [3] and Merzouk [4], Challali et al. [5] are among the first researchers who contributed to build the Algerian wind atlas. As well as Himri et al. [6-8]; Kheder-Haddouche et al. [9], Boudia et al. [10-12], Guerri et al. [13], Abderrahim et al. [14], and Benmedjahed et al. [15-29] are also worth a mention for their research on wind potential in Algeria.
Tindouf, located in Southern Algeria, is a region known for its vast expanse of desert and limited access to traditional energy sources. However, this challenging environment has also presented an opportunity for harnessing wind energy as a renewable resource. Wind energy has gained significant importance globally due to its ability to provide clean and sustainable power, reducing reliance on fossil fuels and mitigating the impacts of climate change. The abundance of wind in Tindouf makes it an ideal location for the development of wind energy.
The study analyzes wind data from 74 years to determine the optimal wind turbine direction in Tindouf. The wind speed distribution is used to calculate the available energy, which is proportional to the wind potential. The Weibull distribution model is used to calculate the frequency distribution. The wind rose, a polar graphic illustration of wind direction, is used to estimate wind power.
2.1 Location presentation
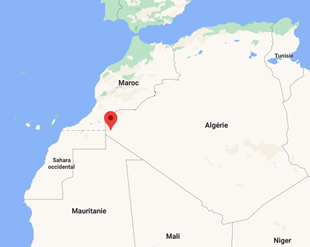
Tindouf region is located in southwest of Algeria, bordering by Morocco in northwest, Bechar region in north and northeast, Western Sahara in the west, Adrar in the east and Mauritania in the south. It has a total size of 159,000 m². Tindouf weather station and position details are illustrated in Table 1 and Figure 1 [30].
Table 1. Tindouf weather station's geographic details
|
Location |
Longitude |
Latitude |
Altitude (m) |
Measurement Period |
|
Tindouf |
W°8.167 |
N°27.7 |
442.9 |
19/03/1943 31/12/2017 |
Figure 1. Tindouf weather station location
2.2 Wind data analysis
The Weibull wind distribution is a probability distribution used to model wind speeds. It is commonly used in the field of renewable energy to assess the potential for wind power generation. The Weibull distribution takes into account both the average wind speed and the variability of wind speeds, making it a useful tool for estimating energy production and planning wind farm layouts. Additionally, the shape parameter of the Weibull distribution allows for tailoring the model to specific locations, taking into account local climate conditions and topography, defined as [31]:
$f\left( v \right)=\frac{k}{C}{{\left( \frac{v}{C} \right)}^{k-1}}\exp \left( -{{\left( \frac{v}{C} \right)}^{k}} \right)$ (1)
To estimate the values of k and C based on the available wind data. The maximum likelihood method is a statistical approach that allows us to find the most likely values of these parameters by maximizing the likelihood function. Additionally, this method takes into account the inherent variability in the wind data, providing more accurate estimates for k and C [31]:
$k={{\left[ \frac{\sum\limits_{i=1}^{n}{v_{i}^{k}\ln \left( {{v}_{i}} \right)}}{\sum\limits_{i=1}^{n}{v_{i}^{k}}}-\frac{\sum\limits_{i=1}^{n}{\ln \left( {{v}_{i}} \right)}}{n} \right]}^{-1}}$ (2)
$C={{\left[ \frac{1}{n}\sum\nolimits_{i=1}^{n}{{{v}^{k}}} \right]}^{\frac{1}{k}}}$ (3)
The wind rose provides valuable information about the prevailing wind patterns in a specific location. It helps in understanding the distribution of wind direction and its frequency, aiding in various fields such as meteorology, urban planning, and renewable energy assessment [15].
The following equation [16, 17, 32-34] can be used to estimate the wind power:
$P\,=\,\frac{1}{2}\rho S{{C}^{3}}\Gamma \left( 1+\frac{3}{k} \right)$ (4)
Factors like wind speed and the rotor area of the wind turbine are factored into the wind power estimation equation. In the realm of renewable energy, this equation is frequently used to calculate the potential energy that may be extracted from wind.
Weibull parameters have been calculated and plotted. The annual, seasonal, and monthly, frequency histograms and Weibull curves are presented based on data base at ten meters above the ground for Tindouf (Figures 2-4).
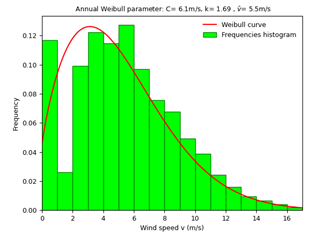
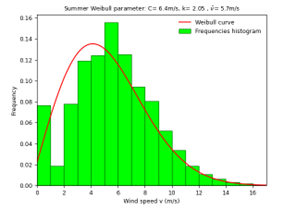
Figure 2. Annual Weibull curves and frequency histograms
From Figure 2, it can be said that the annual scale parameter C is 6.6 m/s, the annual shape parameter k is 1.68, and the wind velocity is 5.5 m/s. We also noted that the greatest percentage of the wind speed class [6, 7] is equal to 12.70%, while the proportion of calm wind is equal to 11.69%. Thus, it is concluded that the distribution is dispersed and that this location is suitable for wind power development due to the consistent and relatively high wind speeds. The combination of the annual scale and shape parameters, along with the observed wind speed distribution, indicates a favorable environment for harnessing wind energy efficiently.
This means that the wind at this location is consistently strong and reliable, making it ideal for generating wind power. The high percentage of wind speeds [6, 7] class further supports this conclusion. Additionally, the proportion of calm wind is relatively low, indicating that there is rarely a lack of wind, which is crucial for efficient wind energy production. Overall, these findings suggest that this location has great potential for successful wind power development.
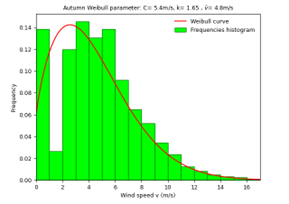
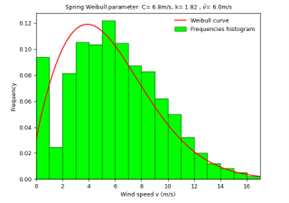
The seasonal distribution is distributed based on the values of the seasonal shape parameter, with the exception of the summer, when the distribution stabilizes at about 2.05. The other seasonal k values, on the other hand, ranged from 1.82 (spring) to 1.59 (winter). The seasonal scale parameter fluctuates between 5.4 m/s in the fall and 6.8 m/s in the spring. In fall, the velocity is 4.8 m/s; in spring, it is 6 m/s.
Figure 3. Seasonal Weibull curves and frequency histograms
In autumn (14.46%) and winter (13.55%), the wind speed class [3, 4] received the highest proportion of quiet frequencies, which varied from 6.66% in summer to 14.28% in winter. However, [5, 6] has the highest percentages in the summer (15.57%) and spring (12.17%). The seasonal variation in wind speed and distribution is evident in the data. During the summer, the wind speed stabilizes at around 2.05, indicating a more consistent and predictable pattern. In contrast, the wind speed fluctuates between 1.82 in spring and 1.59 in winter, suggesting more variability in these seasons. The scale parameter also varies seasonally, with a range of 5.4 m/s in the fall to 6.8 m/s in the spring. Interestingly, the wind speed class [3, 4] receives the highest proportion of quiet frequencies in autumn and winter, while [5, 6] has the highest percentages in summer and spring.
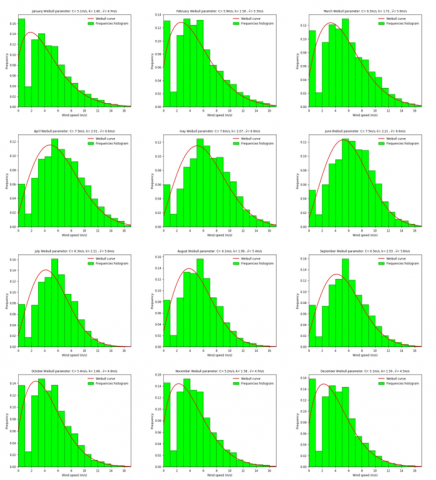
For the monthly distribution, the monthly shape parameter ranges from 1.46 (January) to 2.11 (June). The distribution appears to be steady from April through September. But it's scattered for the remainder of the year. The monthly velocity varies from 4.5 m/s (December) to 6.8 m/s (May), indicating that the location is windy, whereas the monthly scale parameter ranges from 5.1 m/s (January and December) to 7.6 m/s (May). The wind speed class [5, 6] has the highest percentage from March to September, ranging from 12.38% in May to 16.21% in July, while the proportion of calm wind varies from 5.24% in June to 16.90% in January. In the remaining months of the year, the wind speed class [5, 6] has the highest percentage, ranging from 13.43% in February to 15.34% in November. Overall, the wind conditions at this location are characterized by a significant range in both velocity and scale parameters throughout the year. The months of May and June experience the highest wind speeds, with velocities reaching up to 6.8 m/s. Conversely, January and December have the lowest wind speeds, averaging 4.5 m/s. The wind speed class [5, 6] dominates the majority of the year, constituting the highest percentage of wind speeds from March to September. However, the proportion of calm winds varies greatly, with January having the highest percentage at 16.90% and June having the lowest at 5.24%. In the remaining months, the wind speed class [5, 6] still remains the most popular.
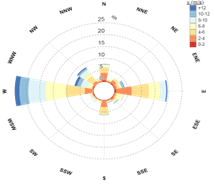
The annual and seasonal wind roses have been also respectively plotted for Tindouf location at ten meters above the ground, Figure 5 and Figure 6.
The dominant sector is in the west, which accounts for 29.4% of wind time. The wind speed classes [4-6] and [6-8] for this sector are estimated to account for 7% and 7.5% of wind time, respectively, while the eastern sector is predominant, which represents 20.4% of wind time. The wind speed classes [2-4] and [4-6] are the most prevalent for the eastern sector, respectively accounting for 5.7% and 6.4% of wind time. The wind speed classes [6-8] and [8-10] for the eastern sector are estimated to account for 4.6% and 4.2% of wind time, respectively. Overall, the western sector has a slightly higher percentage of wind time, but the eastern sector has a wider variety of wind speed classes.
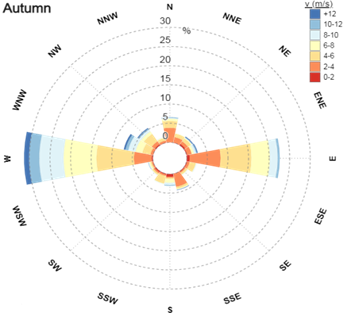
In autumn, the dominant sector is in the west, which accounts for 32% of wind time. The wind speed classes [4-6] and [6-8] for this sector are estimated to account for 7.8% and 6.3% of wind time, respectively. While the eastern sector is second-most dominant, it properly accounts for 24.2 percent of wind time. The wind speed classes [2-4] and [4-6] are the most prevalent for the eastern sector, accounting for 8.2% and 6.8% of wind time, respectively. Overall, the distribution of wind sectors and wind speed classes vary throughout the year.
Figure 4. Monthly Weibull curves and frequency histograms
In winter, the western sector becomes the dominant sector, accounting for 37% of wind time. The wind speed classes [4-6] and [6-8] in this sector make up 9.1% and 7.5% of wind time, respectively. The eastern sector remains the second-most dominant in winter, accounting for 26.3% of wind time. Interestingly, the wind speed classes [2-4] and [4-6] are still the most prevalent for the eastern sector, representing 8.9% and 7.3% of wind time, respectively.
The predominant wind direction in winter is west, accounting for 26.4 % of wind time. The wind speed classes [4-6] and [6-8] are expected to account for 7.3% and 5.7% of wind time for this sector, respectively. The other major direction is east, which accounts for 21.3% of wind time; the wind speed classes [2-4] and [4-6] are the most common in the eastern sector, accounting for 8.1% and 9.5% of wind time, respectively. In contrast, the western sector experiences a different wind pattern. The prevailing wind direction in winter is east, accounting for 19.8% of wind time. The wind speed classes [2-4] and [4-6] are also dominant in this sector, representing 10.2% and 9.6% of wind time, respectively. However, the wind speed classes [6-8] and [8-10] are expected to increase in frequency, accounting for 5.3% and 3.9% of wind time for the western sector, respectively. Overall, these findings highlight the variability in wind patterns and speed classes across different sectors.
Figure 5. Annual wind rose
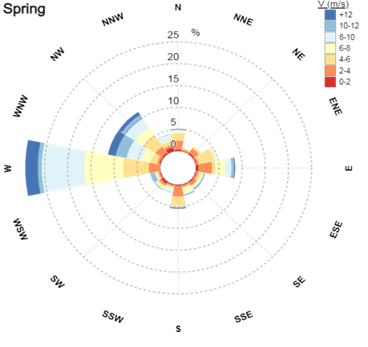
In spring, the dominant wind direction is west, which equals 28.4% of wind time. The wind speed classes [6-8] and [8-10] are predicted for this sector at 8% and 9.2% of wind time, respectively. The second dominant directions are west-northwest (WNW) and northwest (NW), which have respectively 11.3% and 11.4% of wind time; the wind speed classes [6-8] for west-northwest (WNW) and northwest (NW) account for respectively 1.9% and 2.2%, while the wind speed classes [8-10] account for respectively 3.6% and 2.3%. The wind patterns and speed classes vary significantly across different sectors. In spring, the prevailing wind direction is west, accounting for approximately 28.4% of the total wind time. Within this sector, wind speeds fall into the [6-8] and [8-10] classes, representing 8% and 9.2% of the wind time, respectively. However, the second most dominant wind directions, west-northwest (WNW) and northwest (NW), have a slightly lower wind time, at 11.3% and 11.4%, respectively. In these directions, the wind speed classes [6-8] account for 1.9% and 2.2% of the wind time.
In summer, the west sector accounts for 24.6% of wind time, whereas the east sector accounts for roughly 12.6% of wind time; the wind speed classes [4-6], [6-8], and [8-10] are expected to account for 6.4%, 6.5%, and 6.1% of wind time for the western sector, respectively, while the wind speed classes [2-4] and [4-6] are the most prevalent for the eastern sector, accounting for 5% and 5.9% of wind time, respectively.
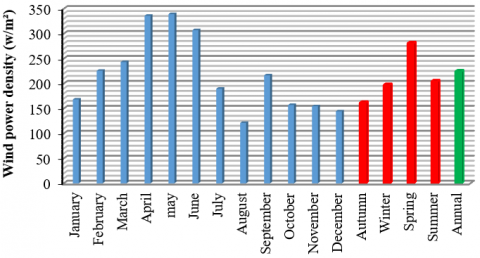
The monthly, seasonal and annual wind power density of Tindouf region at ten meters above the ground is shown in Figure 7.
Figure 7. Monthly, seasonal, and annual wind power density
In May, there was a good wind energy density (339.20 W/m2) at the Tindouf site. The average seasonal density changes from 161.38 W/m2 in the fall to 280.87 W/m2 in the spring. For the remainder of the year, the monthly density varies from 121.60 W/m2 in August to 335.85 W/m2 in April. Consequently, the density per year is 224.37 W/m2. As is evident, the Tindouf location is classified as part of the PNL 4th class [35]. This indicates that it is an ideal location for wind farms. It is needed to harness energy as much as possible by utilizing the strong westerly winds. As a result, the wind turbine rows must be oriented perpendicular to the west. We may generate a quantity of energy that continuously grows from January until it reaches its peak in May and then begins to decrease in the following months, except for September and spring, which are the optimum seasons for wind energy production overall. During these months, the wind speeds are consistently high, allowing for maximum energy generation. Additionally, the Tindouf location's favorable climate and vast open spaces provide ample opportunities for the installation of a large number of wind turbines. With careful planning and efficient use of resources, the wind farms in Tindouf have the potential to become a significant source of renewable energy for the region, reducing dependence on fossil fuels and contributing to a greener future.
This paper uses wind data from 74 years to estimate the wind energy resource of Tindouf, Southern Algeria. The distribution of wind speed changes significantly from January to June, but remains stable from April to September. The region experiences strong winds, making it suitable for wind energy generation or sailing. The high wind energy density in April is ideal for wind power production, while low density in August may not be optimal.
The annual average density of 224.37 W/m2 indicates a relatively consistent wind resource, making Tindouf a promising location for long-term wind energy production. This consistent wind resource can reduce reliance on fossil fuels and contribute to a sustainable future. However, further studies are needed to determine feasibility and potential challenges of implementing wind energy projects in the region.
I want to express my gratitude to the research center“Unité de Recherche en Energies renouvelables en Milieu Saharien (URERMS)” for providing a perfect setting in which to conduct research and provide the required infrastructure for the successful training. It is my joy also to express my heartfelt appreciation to all of my colleagues at the “Unité de Recherche Matériau et Energies Recoverable (URMER) for their precise and invaluable assistance, which has been invaluable to my research in theoretical terms.
|
C |
Scale parameter (m/s) |
|
k |
Shape parameter |
|
P |
Power (W) |
|
S |
Wind turbine section (m²) |
|
v |
Wind speed (m/s) |
|
$\overline{\boldsymbol{v}}$ |
Velocity (m/s) |
|
Greek symbols |
|
|
ρ |
Standard air density (kg/m3) |
|
Γ |
Gamma fonction |
|
Subscripts |
|
|
$f(v)$ |
Frequency distribution |
[1] Dmytrów, K., Landmesser, J., Bieszk-Stolorz, B. (2021). The connections between COVID-19 and the energy commodities prices: Evidence through the dynamic time warping method. Energies, 14(13): 4024. https://doi.org/10.3390/en14134024
[2] Tong, W. (2010). Fundamentals of Wind Energy. Southampton, UK: WIT Press. https://doi.org/10.2495/978-1-84564-205-1/01
[3] Merzouk, N.K. (2006). Evaluation du Gisement Energétique Eolien-Contribution à la détermination du profil Vertical de la vitesse du vent en Algérie, thesis, University of Tlemcen, Tlemcen, Algeria.
[4] Merzouk, N.K. (2000). Wind energy potential of Algeria. Renewable Energy, 21: 553-562. https://doi.org/10.1016/S0960-1481(00)00090-2
[5] Chellali, F., Khellaf, A., Belouchrani, A., Recioui, A. (2011). A contribution in the actualization of wind map of Algeria. Renewable and Sustainable Energy Reviews, 15(2): 993-1002. https://doi.org/10.1016/j.rser.2010.11.025
[6] Himri, Y., Himri, S., Stambouli, A.B. (2009). Assessing the wind energy potential projects in Algeria. Renewable and Sustainable Energy Reviews, 13(8): 2187-2191. https://doi.org/10.1016/j.rser.2009.03.003
[7] Himri, Y., Malik, A.S., Stambouli, A.B., Himri, S., Draoui, B. (2009). Review and use of the Algerian renewable energy for sustainable development. Renewable and Sustainable Energy Reviews, 13(6-7): 1584-1591. https://doi.org/10.1016/j.rser.2008.09.007
[8] Himri, Y., Rehman, S., Draoui, B., Himri, S. (2008). Wind power potential assessment for three locations in Algeria. Renewable and Sustainable Energy Reviews, 12(9): 2495-2504. https://doi.org/10.1016/j.rser.2007.06.007
[9] Kheder-Haddouche, S., Boudia, S.M. (2019). Wind Resource Assessment at Illizi Site in the Algerian Sahara, with Environmental Analysis. In 2019 7th International Renewable and Sustainable Energy Conference (IRSEC), pp. 1-6. https://doi.org/10.1109/irsec48032.2019.9078262
[10] Boudia, S.M., Santos, J.A. (2019). Assessment of large-scale wind resource features in Algeria. Energy, 189: 116299. https://doi.org/10.1016/j.energy.2019.116299
[11] Boudia, S.M., Benmansour, A., Ghellai, N., Benmedjahed, M., Tabet Hellal, M.A. (2012). Monthly and seasonal assessment of wind energy potential in Mechria region, occidental highlands of Algeria. International Journal of Green Energy, 9(3): 243-255. http://doi.org/10.1080/ 15435075.2011.621482
[12] Boudia, S.M., Benmansour, A., Ghellai, N., Benmedjahed, M., Hellal, M.A.T. (2013). Temporal assessment of wind energy resource at four locations in Algerian Sahara. Energy Conversion and Management, 76: 654-664. http://doi.org/10.1016/j.enconman.2013.07.086
[13] Guarienti, J.A., Almeida, A.K., Neto, A.M., de Oliveira Ferreira, A.R., Ottonelli, J.P., de Almeida, I.K. (2020). Performance analysis of numerical methods for determining Weibull distribution parameters applied to wind speed in Mato Grosso do Sul, Brazil. Sustainable Energy Technologies and Assessments, 42: 100854. https://doi.org/10.1016/j.seta.2020.100854
[14] Abderrahim, A., Ghellai, N., Bouzid, Z., Menni, Y. (2019). Wind energy resource assessment in south western of Algeria. Mathematical Modelling of Engineering Problems, 6(2): 157-162. https://doi.org/10.18280/mmep.06020
[15] Benmedjahed, M., Maouedj, R. (2019). Assessment of Acoustic impact for the wind farm in Algeria. In 2019 1st Global Power, Energy and Communication Conference (GPECOM), pp. 316-320. https://doi.org/10.1109/gpecom.2019.8778498
[16] Benmedjahed, M., Ghellai, N., Benmansour, A., Boudai, S.M., Hellal, M.T. (2014). Assessment of wind energy and energy cost in Algeria. Journal of Renewable Energy and Smart Grid Technology, 9(1): 31-40. https://ph01.tci-thaijo.org/index.php/RAST/article/view/26347.
[17] Benmemdejahed, M., Mouhadjer, S. (2016). Evaluation of wind energy cost and site selection for a wind-farm in the south of Algeria. In AIP Conference Proceedings, 1758(1): 030001. https://doi.org/10.1063/1.4959397
[18] Benmedjahed, M., Ghellai, N., Bouzid, Z., Chiali, A. (2015). Temporal assessment of wind energy resource in “Adrar” (south of Algeria); calculation and modeling of wind turbine noise. In 2nd International Congress on Energy Efficiency and Energy Related Materials (ENEFM2014) Proceedings, Oludeniz, Fethiye/Mugla, Turkey, October 16-19, 2014, pp. 33-42. https://doi.org/10.1007/978-3-319-16901-9_5
[19] Benmedjahed, M., Boudaoud, L. (2015). Temporal assessment of wind energy resource in Algerian desert sites: Calculation and modelling of wind noise. Journal of Fundamentals of Renewable Energy and Applications, 5(3): 1-4. https://doi.org/10.4172/2090-4541.1000160
[20] Benmedjahed, M., Bouzid, Z., Ghellai, N. (2015). Wind potential assessment of AIN salah in Algeria; calculation of the cost energy. International Journal of Energy and Power Engineering, 4(2): 38. http://doi.org/10.11648/j.ijepe.20150402.14
[21] Benmedjahed, M., Ghellai, N., Benmansour, A. (2012). Wind potential assessment of three coastal sites in Algeria: Calculation and modeling of wind turbine noise using Matlab. International Journal of Computer Applications, 56(2): 20-25. http://doi.org/10.5120/8864-2827
[22] Benmedjahed, M., Maouedj, R. (2017). L’impacte d’un parc éolien sur l’environnement au sud Algérien. Editions Universitaires Europeennes.
[23] Benmdjahed, M., Maouedj, R. (2017). The wind farm impact on the environment in Tindouf. LAP LAMBERT Academic Publishing.
[24] Benmedjahed, M., Dahbi, A., Hadidi, A., Mouhadjer, S. (2021). Temperature and wind distribution effects on wind energy production in Adrar Region (Southern Algeria). International Journal of Sustainable Development and Planning, 16(8): 1473-1477. https://doi.org/10.18280/ijsdp.160808
[25] Benmedjahed, M., Bouzid, Z., Ghellai, N. (2015). Wind potential assessment of AIN salah in Algeria; calculation of the cost energy. International Journal of Energy and Power Engineering, 4(2): 38. http://doi.org/10.11648/j.ijepe.20150402.14
[26] Benmedjahed, M., Maouedj, R. (2018). Wind power assessment in Algeria; methods development. In 2018 International Conference on Wind Energy and Applications in Algeria (ICWEAA), pp. 1-6). https://doi.org/10.1109/icweaa.2018.8605049
[27] Benmedjahed, M., Maouedj, R. (2018). Technical and economic analysis of wind turbine system for isolated location at Adrar in Algeria. In 2018 6th International Renewable and Sustainable Energy Conference (IRSEC), pp. 1-4. https://doi.org/10.1109/irsec.2018.8702948
[28] Benmedjahed, M., Maouedj, R., Mouhadjer, S., Dahbi, A., Saba, D., Touahri, T. (2020). Wind energy source assessment for four locations in the Adrar Region: Southern Algeria. In Proceedings of the 10th International Conference on Information Systems and Technologies, pp. 1-6. https://doi.org/10.1145/3447568.3448535
[29] Benmedjahed, M., Maouedj, R., Mouhadjer, S. (2020). Wind energy resource assessment of desert sites in Algeria: Energy and reduction of CO2 emissions. International Journal of Applied Power Engineering (IJAPE), 9(1): 22-28. https://doi.org/10.11591/ijape.v9.i1.pp22-28
[30] GoogleMaps. (2007). https://www.google.dz/maps/place/ Tindouf/@27.2084143,8.5776126,7z/data=!3m1!4b1!4m5!3m4!1s0xdc8f543a42dd5fb:0x77f07f133f79f497!8m2!3d27.6719159!4d-8.1398003?hl=fr
[31] Wind energy: Fundamentals, resource analysis and economics. https://doi.org/10. 1007/3-540-30906-3
[32] Benmedjahed, M., Dahbi, A., Khelfaoui, A., Hadidi, A., Mouhadjer, S., Djaafri, O. (2023). Statistical examination of wind energy’s contribution to carbon dioxide emissions reduction*:* Study: Adrar, located in Southern Algeria. In 2023 International Conference on Advances in Electronics, Control and Communication Systems (ICAECCS), pp. 1-5. https://doi.org/10.110 9/ icaeccs 56710.2023.10105015
[33] DAHBI, A., Benmedjahed, M., Khelfaoui, A., et al. (2022). A comparative study between MPPT using PI and fuzzy logic control for wind turbine system. In 2022 19th International Multi-Conference on Systems, Signals & Devices (SSD), pp. 1228-1233. https://doi.org/10.1109/ssd54932.2022.9955879
[34] Dahbi, A., Benlahbib, B., Benmedjahed, M., et al. (2023). A comparative experimental investigation of MPPT controls for variable speed wind turbines. International Journal of Electrical and Computer Engineering Systems, 14(6): 703-711. https://doi.org/10.32985/ijeces.14.6.10
[35] Benmedjahed, M., Maouedj, R., Mouhadjer, S., et al. (2021). Analysis of the wind resources in Saharan Atlas of Algeria: Adrar region as a case study. Iranian (Iranica) Journal of Energy & Environment, 12(2): 155-160. https://doi.org/10.5829/ijee.2021.12.02.08