Ridwan Iskandar*![]() | Bagus Putu Yudhia Kurniawan
| Bagus Putu Yudhia Kurniawan![]() | Taufik Hidayat
| Taufik Hidayat![]() | Uyun Erma Malika
| Uyun Erma Malika![]() | Andarula Galushasti
| Andarula Galushasti![]()
© 2024 The authors. This article is published by IIETA and is licensed under the CC BY 4.0 license (http://creativecommons.org/licenses/by/4.0/).
OPEN ACCESS
Local agricultural commodities in Indonesia require efforts to improve performance as well as soybean commodities. The prolonged deficit of local soybeans in meeting national soybean needs raises the suspicion that the imported soybean option is a more reliable deficit solution. This raises the fundamental question of how sustainable local soybean production will be in the future. The multidimensional scaling analysis method was used to assess each attribute on an ordinal scale based on sustainability criteria using the Rap+ application. The study was conducted in 6 provinces in Indonesia, which were determined deliberately by considering the level of productivity. The diagnosis results showed that the average sustainability index value ranged from 38.67-49.54. This shows that the sustainability status is in the less sustainable category. In the social dimension, the most sensitive attribute, namely the leverage attribute that if intervened will cause an increase in the sustainability status of the social dimension is agricultural extension. Research findings related to agricultural extension are suspected that the better the condition of agricultural extension services, the higher the average soybean production. Follow-up to the diagnosis results can be done by clustering measures. This is a rational action to achieve effective mutual development between provinces.
agricultural commodities, local soybeans imported soybeans, sustainability, multidimensional scaling
Indonesia produces a variety of local agricultural commodities that have great potential to be developed, such as soybeans, dragon fruit, porang, sweet potatoes, papaya, and many more. One of these local commodities is soybeans which require development efforts. Indonesia has been running a soybean production deficit for years. Data from FAO [1] and BPS [2] shows that in 2019 the production deficit reached 2.67 million tons. This deficit was then met by imported soybeans.
In the 2015-2019 period, soybean imports increased significantly in line with the decline in Indonesian soybean production [3, 4]. This condition raises allegations that Indonesia relies more on imported soybeans than developing local soybeans to meet domestic soybean needs. At present soybean imports are still needed but in the long run import policy must be directed to encourage domestic production to meet increasing domestic demand this is still unable to materialize [5]. This further poses a threat to the sustainability aspects of Indonesia's soybean production. In Indonesia, soybeans are the third most important food commodity after rice and corn. Most soybeans are used as the main raw materials for the manufacture of tofu and tempeh, a staple of traditional fermented food of the Indonesian nation. Currently, Indonesia has not achieved self-sufficiency in soybeans, according to Harsono et al. [6], there are three main challenges to soybean self-sufficiency, namely low land fertility, low competition between soybean varieties, and low selling prices of local soybeans.
Many efforts have been made and studies have been carried out but none have been able to touch the root of the problem. Therefore, it is necessary to emphasize the problem first through diagnosis efforts, to provide a true picture of the sustainability of Indonesian soybeans. Diagnosis is taken from medical terms, in this study diagnosis means understanding the problem, identifying the underlying cause, and choosing the appropriate intervention [7]. The overall objective of this study is to identify strategies to improve the sustainability of local soybean production. The potential implications of increasing the sustainability of local soybean production are reducing import dependence, creating economic opportunities, and promoting environmental preservation. This study tries to find a solution by finding leverage attributes in 3 dimensions of sustainability, namely social, economic, and environmental dimensions [8, 9]. The sustainability of the social dimension is identified through the level of education, health, agricultural extension, poverty, and human development index [10, 11].
The sustainability of the economic dimension is identified through the contribution of the agricultural sector to GDP, soybean productivity levels, soybean marketing reach, farmer exchange rates, and government assistance [12, 13]. The sustainability of the environmental dimension includes the quality attributes of environmental resources, residues, natural disasters, settlements, and participation [14, 15]. This phenomenon will be identified using secondary data in 6 provinces as units of analysis which are production centers that contribute greatly to meeting the needs of Indonesian soybeans, namely the provinces of Central Java [16], South Sulawesi [17], South Sumatra [18], West Java [19], East Java [20], and Central Sulawesi [21]. These six provinces were selected based on their highest level of productivity compared to other provinces [22].
2.1 Multidimensional scaling analysis
The Multidimensional Scaling (MDS) technique was used to assess each attribute on an ordinal scale based on the sustainability criteria of Table 1, to find the sensitive leverage attributes on which alternative strategies are based [23]. MDS requires data input in the form of a similarity matrix between objects based on several comparison criteria determined by the user. The user visualizes the results obtained by MDS and traces the conclusions by analyzing the relative positions of points and groups appearing in the representation [24]. As illustrated in Figure 1, the scores of each attribute on each dimension are examined multidimensionally to establish points that indicate sustainability concerning two reference points, namely the bad point and the good point [25].
Figure 1. Two reference points bad and good
Then, ordination analysis is carried out to facilitate visualization of the distance between two reference points by entering all attributes in each dimension. The findings obtained show the extent of sustainability status in each dimension. After examining each dimension, a kite diagram is created that can be used to compare sustainability between dimensions, as in the guidelines that have been drawn up [26].
The Monte Carlo analysis is carried out to evaluate the effect of random errors, and then the value of this Monte Carlo is compared with the results of the MDS analysis. If the difference value is small, the scoring error is relatively small, and the scoring variation is relatively small [27]. Furthermore, regarding the stress value and R² value, Kavanagh and Pitcher [28] stated that all attributes used in the sustainability status assessment are considered quite accurate and reliable if they have a stress value of < 0.25 and a coefficient of determination (R²) close to the value of 1.0. The stress value is determined using the most commonly used Kruskal's stress function [29]:
Stress $=S=\sqrt{\frac{\sum_{i j}\left(\delta_{i j}-d_{i j}\right)^2}{\sum_{i j} d_{i j}{ }^2}}$ (1)
Note: dij is the proximity value between items i and j, and dij is the spatial distance between them.
2.2 Sustainability diagnosis
Sustainability diagnosis is a rapid assessment of a system in sustainability indicators. The results of the diagnosis are developed with advanced research to establish the best solution. As in the medical field, sustainability diagnosis is aimed at obtaining an idea of whether a system is in a healthy condition or not. Research on sustainability diagnosis, especially in local soybeans, has not been carried out at least until early 2023. The existing research is a diagnosis of sustainability in agriculture in general, namely research [30]. Several indicators have been developed as an early stage of diagnosis. This research, which was carried out in Italy, is then presented as a model for integrated sustainability assessment on an agricultural scale covering 3 dimensions, namely the dimensions of Agronomy, Economy, and Ecology. These three dimensions are further broken down into 12 sub-dimensions and 37 basic indicators.
The research findings suggest that the assessment model (SOTARE) can react to the different types of farm management studied in the agricultural reference sample and agricultural performance weaknesses can be identified. In addition, its application over time provides information that can be used to assess and monitor policy performance at the regional level. SOTARE's link to local soy sustainability diagnosis lies in assessment models that are identical to each other based on a set of sustainability indicators or attributes. According to Saeed and Wang [31], A complete diagnosis not only checks current health but also suggests corrective measures. This study also presents the concept of sustainability in a diagnosis and summarizes and compares 6 models to create a continuous diagnostic model. In research on organizational diagnosis, McFillen et al. [7] presented a model of an evidence-based diagnosis process that starts from data collection, interpretation, preliminary diagnosis, testing, and final diagnosis accompanied by feedback. It is intended by the researcher that the process of diagnosing the organization becomes more scientific, the intervention chosen is more appropriate, and better prepares the process of change that the organization wants.
The diagnosis of the sustainability of local soybean production is carried out to assess the sustainability and performance of local soybean production in Indonesia through the following process: Determine the dimensions to be analyzed, namely economic, social, and environmental dimensions; Determine the attributes of each dimension, each of the 5 attributes in each dimension as presented in Table 1; Data collection (the data collected is secondary data from BSP Statistics Indonesia, if secondary data is not available, information in the form of primary data is sought); Data interpretation, preliminary diagnosis, testing and final diagnosis; Provide feedback and intervention.
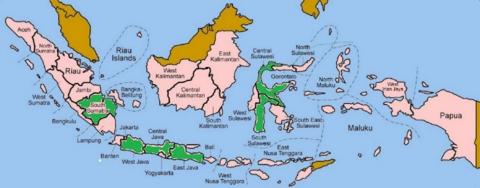
The study was conducted on six units of analysis (provinces) in Indonesia (Figure 2 blocks in green) which were deliberately selected by considering the average productivity level above 15 kw/ha, namely the provinces of Central Java, South Sulawesi, South Sumatra, West Java, East Java, and Central Sulawesi. The study will be conducted from January to May 2023. The average productivity level of the six provinces is above 15 kw/ha which indicates that it is the main production center of local soybeans in Indonesia.
Figure 2. Analysis unit of Indonesian soybean production center
Table 1. Sustainability criteria on each dimension
|
Dimensions/Attributes |
Skor |
Min |
Max |
Information |
|||||
|
0 |
1 |
2 |
3 |
4 |
5 |
|
|||
|
Social Dimension |
|||||||||
|
Health |
< 30 |
30-35 |
36-40 |
> 40 |
|
|
0 |
3 |
% of the population has health insurance |
|
Human Development Index (HDI) |
0.350–0.549 (low) |
0.550–0.699 (medium) |
0.700–0.799 (high) |
0.800–1.000 (very high) |
|
|
0 |
3 |
HDI explains how people can access development outcomes in earning income, health, education, etc. |
|
Agricultural extension |
No extension activities |
A limited number of extension workers |
Extension materials as needed |
There are forums and counselling agencies |
|
|
0 |
3 |
|
|
Poverty |
> 16 |
14.6-16 |
13.1-14.5 |
11.6-13 |
10-11.5 |
< 10 |
0 |
5 |
% of the poor population |
|
Education level |
SD |
SMP |
SMA |
S1 |
S2 |
S3 |
0 |
5 |
The average education level of the population |
|
Economic Dimension |
|||||||||
|
Distribution of percentage of GDP by business field |
< 10% |
11-15% |
16-20% |
21-25% |
>25% |
|
0 |
4 |
% contribution of the agri-food sector to GDP |
|
Soybean productivity rates |
< 14 |
14-14.5 |
14.6-15 |
15.1-15.5 |
15.6-16 |
>16 |
0 |
5 |
Soybean productivity kw/ha |
|
Soybean marketing reach |
Local market |
District market |
Provincial needs |
Provincial needs outside |
Export market |
|
0 |
4 |
|
|
Farmer Exchange Rate (FER) |
<100 |
=100 |
>100 |
|
|
|
0 |
2 |
Provincial-level FER composite index |
|
Government assistance |
None |
There is 1 help |
There are 2 helps |
More 2 helps |
|
|
0 |
3 |
Fertilizer assistance, BPJS, social, food, etc. |
|
Environmental Dimensions |
|||||||||
|
Environmental conditions and quality |
1.072.468-1.338.584 |
806.351-1.072.467 |
540.234-806.350 |
274.117-540.233 |
8.000-274.116 |
|
0 |
4 |
Area and distribution of critical land (ha) |
|
Residue |
0-25 |
26-50 |
51-75 |
76-100 |
|
|
0 |
3 |
% waste treatment against GDP |
|
Natural disasters |
< 100 |
101-150 |
151-200 |
201-250 |
>250 |
|
0 |
4 |
Number of natural disasters |
|
Settlement |
< 10 |
11-20 |
21-30 |
31-40 |
>40 |
|
0 |
4 |
% of households that have waste treatment transported by officers |
|
Participation |
< 10 |
11-20 |
21-30 |
31-40 |
>40 |
|
0 |
4 |
Environmental institutional forms |
Data collection was carried out through secondary data tracing from trusted sources, namely the Indonesian Central Bureau of Statistics related to the sustainability attributes of soybean commodity development including social, economic, and environmental dimensions. In Indonesia, this data source is valid and reliable because it is updated annually through the publication of the Province in Numbers book and its implementation refers to the FAO program. In addition, data collection is carried out by observation and documentation.
Data processing based on MDS techniques is carried out using the Rap+ application, while for visualization between units of analysis, the Orange application is used. The MDS method aims to determine the sustainability of Indonesian soybeans in the future. The orange method is used not only to evaluate visualization between units of analysis but also to diagnose the sustainability of Indonesian soybeans.
The stages of research with the MDS method include: (1) mapping the results of the assessment on each attribute (coordination analysis) so that the sustainability status of each dimension can be determined; (2) determining sensitive attributes (leverage analysis); (3) estimating the effect of research instruments on 95% confidence levels (Montecarlo analysis); and (4) determine sustainability index values on all dimensions (kite diagram analysis). The visualization stages of the analysis unit using the Orange application are as follows: (1) sustainability matrix input; (2) creation of an application link with a sustainability matrix; (3) evaluation and classification of research dimensions. The stages of diagnosis include (1) data collection and analysis; (2) identification and interpretation of data; and (3) validation and diagnosis. The sustainability criteria of each dimension are summarized in Table 1. The selection of attributes in Table 1 is done by identifying the attributes in each dimension, then ranking by importance and selecting the most important attributes of each dimension.
4.1 Sustainability index
The diagnosis of sustainability index is based on the ordination process, which is a process to visualize the position of sustainability points in two dimensions based on the results of attribute scores. The distance between attribute points, horizontal and vertical reference points, and anchor reference points is calculated using the Euclidian distance formula [32] as follows:
$d i j=\sqrt{\sum_a(X i a-X j a)^2}$ (2)
Note: xi and xj determine the coordinates of points i and j on dimension a, respectively.
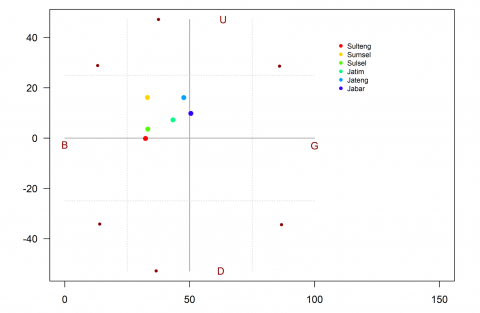
Based on secondary data from the six provinces analyzed related to the attributes determined, it has produced a sustainable performance status of soybean development based on economic, social, and environmental dimensions (Figure 3). Sustainability performance is visualized in the form of the position of the attribute points of each dimension. The six units of analysis in question are the provinces of Central Java, South Sulawesi, South Sumatra, West Java, East Java, and Central Sulawesi. The sustainability status for the six provinces can be seen in Table 2.
(a) Social performance
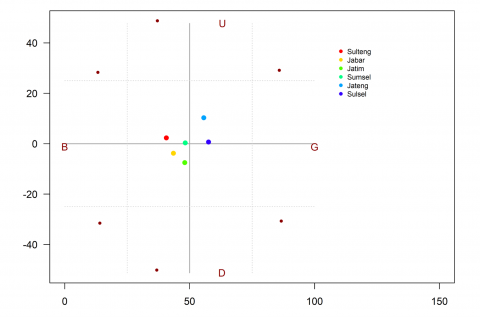
(b) Economic performance
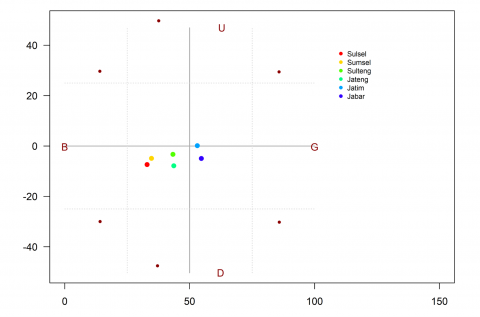
(c) Environmental performance
Figure 3. Performance of analysis units
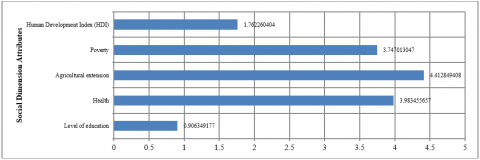
Based on Figure 3 on the social dimension, most provinces are in the less sustainable category. This result is certainly quite surprising, especially when compared to other food commodities or horticultural commodities which are generally in the category of quite sustainable or even very sustainable [25, 33]. Only one province has the category of quite sustainable and 5 other provinces are less sustainable. Based on the results of secondary data analysis, the social performance of West Java and Central Java provinces is the highest (see Table 2). This is in line with the results of a total assessment of 5 attributes in the social dimension which places these two provinces in the top position. The leverage attributes of the social dimension lie in the agricultural extension attributes (Figure 4). This attribute is at the highest condition which indicates the existence of adequate extension forums and institutions and extension materials according to needs. In addition, other levers whose value is close to the attributes of agricultural extension are health and poverty attributes. Thus, policy interventions can be carried out on the three attributes mentioned above which will be able to improve the sustainability performance of the social dimension. The very sustainable category in the social dimension has characteristics: there are adequate forums and extension institutions in each district, the percentage of the population has health insurance above 40%, the percentage of poor people is below 10%, the human development index / HDI is very high (above 0.8). HDI explains how residents can access development outcomes in earning income, health, and education [34].
Table 2. Analysis unit sustainability index value
|
Unit of Analysis |
Social Performance |
Economic Performance |
Environmental Performance |
Mean |
Rank |
|
West Java |
50.45342 |
43.46876 |
54.68475 |
49.53564 |
1 |
|
Central Java |
47.65487 |
55.64247 |
43.63319 |
48.97684 |
2 |
|
East Java |
43.28884 |
48.02618 |
53.05565 |
48.12356 |
3 |
|
South Sulawesi |
33.25196 |
57.54077 |
32.93301 |
41.24192 |
4 |
|
Central Sulawesi |
32.33739 |
40.65173 |
43.29634 |
38.76182 |
5 |
|
South Sumatra |
33.09372 |
48.22606 |
34.68475 |
38.66818 |
6 |
(a) Social dimension attributes
(b) Economic dimension attributes
(c) Environmental dimension attributes
Figure 4. RMS value of leverage attributes
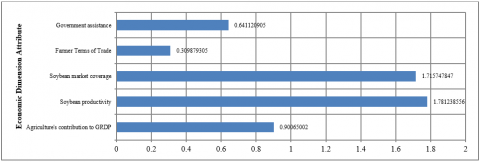
In the economic dimension, just like in the social dimension, all units of analysis are between the values of 25-75%, meaning that they are located between the status of quite sustainable and less sustainable. However, the economic dimension is better because there are 2 points located in less sustainable, namely South Sulawesi and Central Java. This is reflected in the high percentage of contribution of the agri-food sector to GDP (>10%), namely South Sulawesi (22.55%) and Central Java (13.86%). The lever attribute in the economic dimension is the productivity attribute of crops, in both provinces this attribute is quite significant above 15 kws per ha [22]. In the second layer, there is a product marketing reach attribute (soybeans) whose root mean square (RMS) value is close to the crop productivity attribute (Figure 4). The leverage/sensitive attribute refers to the RMS value, which is the value obtained from the calculated squaring error (predicted – observed) divided by the amount of data (average) and rooted. Policy interventions on these sensitive attributes will be able to improve the sustainability performance of the economic dimension. The very sustainable category in the economic dimension includes the characteristics: high productivity above 15 kw/ha, implemented reference prices for purchases and sales, there are already industrial-scale soybean processors, do not depend on government assistance, and marketing reach has been outside the province and even exports.
In the ecological dimension, West Java and East Java are the leading provinces included in the status of quite sustainable (Table 2). The leverage attribute in the ecological dimension is the quality attribute and environmental conditions with an RMS value of 3.68. One of the important points on this attribute is the area and distribution of critical land by province (hectares), where in 2018 West Java had a critical land area of 231,445 ha and East Java an area of 86,937 ha, these figures are relatively low compared to other provinces in the same year [35]. Rehabilitation of critical lands is one of the efforts to improve the performance of the ecological dimension. The status of 'very sustainable' in the ecological dimension will be achieved if the system already has the following characteristics: decreasing critical land area from year to year, the percentage of households in each settlement that wraps household waste for officers to handle >40%, the number of flood events <100 events per year due to continuous drainage improvements, and the number of environmental institutions participating in ecological development >40 institutions/year.
Overall, based on the performance of social, economic, and ecological dimensions, the sustainability status of the West Java analysis unit is the highest (Table 2). All units of analysis are in the same category, namely in the less sustainable category. In general, based on the mean sustainability status can be grouped on the one hand, West Java, Central Java, and East Java have adjacent values, on the other hand, Central Sulawesi and South Sumatra are in the same group. This will be discussed in the last section.
4.2 Leverage attributes
Diagnosis of 15 attributes using Rap+ results in 6 attributes that have the largest RMS value in each dimension (Figure 4). Sensitivity analysis shows which attributes contribute to sustainability value [36]. These attributes are sensitive leverage factors and play an important role in increasing or decreasing the value of Indonesia's soybean sustainability index. The research team diagnosed the attributes of levers in each dimension and grouped them into 2 parts, namely the main and supporting levers. The main leverage attributes consist of agricultural extension, soybean productivity, and environmental conditions and quality. Supporting attributes consist of health, soybean market coverage, and settlement.
The first intervention is to intervene on the main attribute. If it is felt that there is still a need for intervention to improve the sustainability index, intervention is carried out on supporting attributes. The leverage attribute that has the largest RMS value on the social dimension is the agricultural extension attribute (Figure 4a). This attribute is a sensitive attribute that if intervened will be able to increase the value of the social dimension sustainability index. In Table 2 it can be seen that there are 3 provinces, namely West Java, Central Java, and East Java, which are provinces ranked 1-3 in the social dimension. The agricultural extension attribute score (Table 1) for these three provinces is the score in column 3, namely "there are forums and extension agencies" which shows that agricultural extension activities in the three provinces have been running very well. Based on BPS data [37], the three provinces are soybean production centers with the largest average annual production compared to other provinces. Thus, there is a relationship between agricultural extension conditions and local soybean production levels. This is research finding. It is suspected that the better the conditions of agricultural extension, the higher the average soybean production. This is in line with Neves et al. [38]’s study that the provision of extension services and credits separately and together results in greater value of agricultural production. The research on agricultural extension in Indonesia shows that agricultural extension has an important role in increasing the competence and income of rice farmers [39].
In the economic dimension, the soybean productivity attribute is the attribute with the largest RMS value so it needs to be intervened (Figure 4b). Based on BPS data [40], the highest soybean productivity in Indonesia is achieved by 3 provinces, namely South Sulawesi, South Sumatra, and Central Java, with productivity above 15 kw/ha. On the other hand, the contribution of the agri-food sector to the GDP (Gross Regional Domestic Product) in 2022 from the three provinces showed the highest figure above the figures of other provinces, respectively 22.55%, 15.12% and 13.86% [16-18]. Based on the data above, it can be hypothesized that there is a relationship between the contribution to GDP and soybean productivity. The finding is that it is suspected that the greater the contribution of GDP, the higher the productivity of soybeans. According to Amato et al. [41], the relationship between GDP contribution and productivity is that GRDP contribution is one indicator of productivity with a positive relationship. In Indonesia, according to Ikhsan et al. [42], increased productivity can result in higher economic growth and a greater contribution to the GDP of a country or region.
Data processing on the environmental dimension produces attributes with the highest RMS value, namely attributes of environmental conditions and quality, especially related to the area and distribution of critical land. Search results of critical land area data in 2018 [35] show that the provinces of West Java and East Java are the 2 provinces that have the highest amount of land classified as 'very critical'. This attribute needs to be intervened in at least the 2 provinces above to improve the sustainability of the environmental dimension. Handling critical land in the long term will improve environmental protection [43] and increase the area of productive land to increase food production [44].
4.3 Model feasibility
The determination of MDS ordination is supported by model feasibility normalization tests and Monte Carlo analysis. The normalization test of model feasibility (goodness of fit) uses the stress value (S) and coefficient of determination (R2), if the S value is less than 0.25 per cent and the R2 value is close to 1 the model is said to be good or means the data is normally distributed. This model feasibility test is carried out to determine whether or not it is necessary to add attributes to the model and test the accuracy of the model compared to the actual situation. The test results are presented in Table 3.
Table 3. Validation of sustainability index
|
Dimensions |
Difference between the MDS Index and MDS Montecarlo (%) |
Stress S value |
R2 value |
|
Social |
2.36 |
0.1495788 |
0.9443457 |
|
Economic |
1.21 |
0.1445712 |
0.9462920 |
|
Ecological |
0.95 |
0.1432576 |
0.9484763 |
Based on Table 3 the value of S < 0.25% and the value of R2 close to 1 can be concluded that the model for all dimensions is rated good (good of fit). Thus, there is no need to add attributes to get close to the actual state. Monte Carlo analysis results conducted as many as 25 iterations with a 95% confidence interval on each dimension showed average results that were not significantly different when compared to MDS ordination results. This shows errors in scoring each attribute and very small errors in the analysis method procedure where the results of this Monte Carlo analysis support the accuracy of determining the ordination of sustainability status that has been reviewed. The sustainability index is declared valid and considered accepted if the difference is not more than 5% [28].
4.4 Sustainability visualization
Visualize the sustainability index value of each unit of analysis and then depict it in one overlay so that it will look like in a kite diagram (Figure 5).
Based on Figure 5, it can be seen that West Java province is superior in social and environmental dimensions compared to other provinces except for the economic dimension outperformed South Sulawesi. A province is said to be superior because it has a high sustainability index and has the largest cross-sectional area. In the picture above, it can also be seen that the social dimension has the lowest average sustainability index compared to other dimensions, so there needs to be improvements in this dimension. The intervention that needs to be done on the social dimension is on the attribute with the largest RMS value, namely the agricultural extension attribute.
Priority improvements to this attribute include increasing the quantity and quality of forums and extension agencies. Agricultural extension programs that are much needed at this time are extension programs that provide facilitation and solve the problems faced. On the other hand, extension workers do not do too many administrative activities that take a lot of time. According to Baig and Aldosari [45], future agricultural extension must be able to take a demand-based and participatory approach and bridge the linkage between the farming system and marketing.
The superiority of one province over another is not the main concern in this diagnosis, but how this advantage can be transferred to other provinces around which it is not yet superior. This can only be achieved through intervention and guidance from central-level agencies. In Figure 6 the following is depicted the average productivity of soybeans in 6 units of analysis and all provinces in Indonesia using the orange application.
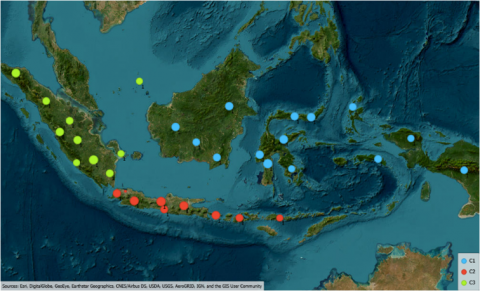
The visualization of the average productivity of the 2006-2015 period is the basis for the development of Indonesian soybeans where the provinces with the highest productivity can be used as centers of excellence. Geographically, the location of the 6 provinces with productivity levels between 15.00 to 17.50 kw/ha is not evenly distributed (yellow dots), therefore it is necessary to cluster provinces as in Figure 7. Furthermore, this clustering is directed to form clusters, namely geographical concentrations of provinces that work together, are complementary and interrelated, and even compete with each other. According to Porter [46], competition occurs in three ways, namely increasing productivity, the pace of innovation, and the formation of new businesses in clusters.
Figure 5. Kite diagram of the performance of Indonesia's local agricultural commodity system
Figure 6. Productivity map
Figure 7. Provincial clustering
Clustering is aimed at the effectiveness of interventions and all interventions come from superiors to subordinates or from the center to the command area. This follows the opinion of Lewis et al. [47] that interventions are essentially 'top-down'. The provinces of South Sulawesi and Central Sulawesi handle development in cluster 1 (blue C1) covering the islands of Kalimantan, Sulawesi, Maluku, and Papua. The provinces of West Java, Central Java, and East Java are responsible for the development of cluster 2 (red C2) covering the islands of Java, Bali, West Nusa Tenggara, and East Nusa Tenggara. South Sumatra Province handles development in cluster 3 (yellow C3) covering the islands of Sumatra and Riau Islands. Because South Sumatra only handles the island of Sumatra, West Java as the westernmost province on the island of Java can be transferred to help South Sumatra cover the island of Sumatra. Furthermore, modifications can be made as needed.
Overall, based on the performance of social, economic, and ecological dimensions, the sustainability status of the analysis unit is in the same category, namely in the less sustainable category. It takes hard work and concerted effort to improve the sustainability and performance of these three dimensions. The main leverage attributes consist of agricultural extension, soybean productivity, and environmental conditions and quality. The social dimension has the lowest average sustainability index compared to other dimensions, so intervention is needed, especially on the attribute with the largest RMS value, namely the agricultural extension attribute. Agricultural extension programs that are much needed at this time are extension programs that provide facilitation and solve the problems faced. If agricultural extension services are implemented adequately, it is expected to increase local soybean production and will increase the sustainability index of the social dimension.
Suggestions that must be implemented are empowering farmers through agricultural extension, the use of superior varieties to increase productivity, and the conservation of critical areas. It is necessary to establish centers of excellence consisting of provinces with the highest productivity based on provincial clustering to effectively intervene.
[1] FAO. (2022). Food Balances. https://www.fao.org/faostat/en/#data/FBS.
[2] BPS. (2023). Imports of Soybean by Major Country of Origin, 2017-2022. https://www.bps.go.id/en/statistics-table/1/MjAxNSMx/impor-kedelai-menurut-negara-asal-utama--2017-2022.html.
[3] Ningrum, I.H., Irianto, H., Riptanti, E.W. (2018). Analysis of soybean production and import trends and its import factors in Indonesia. IOP Conference Series: Earth and Environmental Science, 142(1): 012059. https://doi.org/10.1088/1755-1315/142/1/012059
[4] Azizah, M.A., Syafrial, S., Suhartini, S. (2015). Analysis import policy of soybean on economics performance of Indonesian soybean. Habitat, 26(1): 47-56. https://doi.org/10.21776/ub.habitat.2015.026.1.6
[5] Zikri, I., Safrida, S., Susanti, E., Putri, R.A. (2020). Analysis of trend and determinant factors of imported soybean in the period of 2003-2022. Advances in Food Science, Sustainable Agriculture and Agroindustrial Engineering (AFSSAAE), 3(1): 17-24. https://doi.org/10.21776/ub.afssaae.2020.003.03
[6] Harsono, A., Harnowo, D., Ginting, E., Elisabeth, D.A.A. (2021). Soybean in Indonesia: Current status, challenges and opportunities to achieve self-sufficiency. IntechOpen. https://doi.org/10.5772/intechopen.101264
[7] McFillen, J.M., O'Neil, D.A., Balzer, W.K., Varney, G.H. (2013). Organizational diagnosis: An evidence-based approach. Journal of Change Management, 13(2): 223-246. https://doi.org/10.1080/14697017.2012.679290
[8] Rahma, H., Fauzi, A., Juanda, B., Widjojanto, B. (2019). Development of a composite measure of regional sustainable development in Indonesia. Sustainability, 11(20): 5861. https://doi.org/10.3390/su11205861
[9] Fauzi, A., Widjayanti, D.S., Murniningtyas, E., Wardojo, N.A., Lubis, S., Pratiwi, S. (2012). Overview of Indonesia’s Sustainable Development. Jakarta: Government of Republic of Indonesia.
[10] Firmansyah, I., Pramudya, B., Budiharsono, S. (2016). Sustainability status of rice fields in the rice production center of Citarum Watershed. Advances in Agriculture & Botanics, 8(1): 13-25
[11] Pratiwi, D.A.G., Susiyanto, D. (2021). Dimensions of social development in the era of regional autonomy. Indonesian Journal of Social Work, 5(1): 60-76. https://doi.org/10.31595/ijsw.v5i1.410
[12] Retnowati, N., Iskandar, R. (2021). Policy scenario of sustainable local soybean development in Banyuwangi regency. IOP Conference Series: Earth and Environmental Science, 672(1): 012030. https://doi.org/10.1088/1755-1315/672/1/012030
[13] Noo-urai, N., Jaroenwisan, K. (2016). Sustainability marketing: A changing of marketing concept lead to sustainable business. International Journal of Business and Social Science, 7(4): 114-119.
[14] Korhonen, J. (2004). Industrial ecology in the strategic sustainable development model: Strategic applications of industrial ecology. Journal of Cleaner Production, 12(8-10): 809-823. https://doi.org/10.1016/j.jclepro.2004.02.026
[15] FDES. (2017). Framework for The Development of Environment Statistics (FDES 2013) (New York: United Nations Statistics Division (UNSD)). https://unstats.un.org/unsd/envstats/fdes.cshtml.
[16] BPS-Statistics of Jawa Tengah Province. (2022). Jawa Tengah Province in Figures 2018-2022 (Semarang: BPS-Statistics of Jawa Tengah Province). https://jateng.bps.go.id/publication/2022/02/25/431f4f4bbe02b47866b357cc/provinsi-jawa-tengah-dalam-angka-2022.html.
[17] BPS-Statistics of Sulawesi Selatan Province. (2022). Sulawesi Selatan Province in Figures 2018-2022 (Makassar: BPS-Statistics of Sulawesi Selatan Province). https://sulsel.beta.bps.go.id/id/publication/2022/02/25/d01e0faa0c453705064bcfc9/provinsi-sulawesi-selatan-dalam-angka-2022.html.
[18] BPS-Statistics of Sumatera Selatan Province. (2022). Sumatera Selatan Province in Figure 2018-2022 (Palembang: BPS-Statistics of Sumatera Selatan Province). https://sumsel.beta.bps.go.id/en/publication/2022/02/25/f9646f2d59150d7c3e1201c2/provinsi-sumatera-selatan-dalam-angka-2022.html.
[19] BPS-Statistics of Jawa Barat Province. (2022). Jawa Barat Province in Figures 2018-2022 (Bandung: BPS-Statistics of Jawa Barat Province). https://jabar.bps.go.id/publication/2022/02/25/0d261f828b581d8082bbc6c1/provinsi-jawa-barat-dalam-angka-2022.html.
[20] BPS-Statistics of Jawa Timur Province. (2022). Jawa Timur Province in Figures 2018-2022 (Surabaya: BPS-Statistics of Jawa Timur Province). https://jatim.beta.bps.go.id/id/publication/2022/02/25/33699f6fcd84e0e2a0ad96f0/provinsi-jawa-timur-dalam-angka-2022.html.
[21] BPS-Statistics of Sulawesi Tengah Province. (2022). Sulawesi Tengah Province in Figures 2018-2022 (Palu: BPS-Statistics of Sulawesi Tengah Province). https://sulteng.beta.bps.go.id/en/publication/2022/02/25/d8cccf7c0b42c3d9ff80b8c6/provinsi-sulawesi-tengah-dalam-angka-2022.html.
[22] BPS-Statistics Indonesia. (2023). Statistical Yearbook of Indonesia 2023 (BPS-Statistics Indonesia). https://www.bps.go.id/en/publication/2023/02/28/18018f9896f09f03580a614b/statistik-indonesia-2023.html.
[23] Rosyani, Edison, Asmadi. (2019). Study on sustainability status of smallholder oil palm plantations Jambi Province, Sumatra Indonesia. IOP Conference Series: Earth and Environmental Science, 314: 012055. https://doi.org/10.1088/1755-1315/314/1/012055
[24] Tenreiro Machado, J.A., Mata, M.E. (2013). Multidimensional scaling analysis of the dynamics of a country economy. The Scientific World Journal, 2013: 594587. https://doi.org/10.1155/2013/594587
[25] Iskandar, R. (2022). Development of sustainable attributes in cayenne pepper agribusiness using multidimensional scaling techniques. In 2nd International Conference on Social Science, Humanity and Public Health (ICOSHIP 2021), pp. 116-123. https://doi.org/10.2991/assehr.k.220207.019
[26] Pitcher, T.J. (1999). Rapfish, a rapid appraisal technique for fisheries, and its application to the code of conduct for responsible fisheries. FAO Fisheries Circular (FAO).
[27] Purwaningsih, R., Ameliafidhoh, Z., Susanty, A., Pramono, S.N.W., Agusti, F. (2021). Sustainability status assessment of the Borobudur temple using the Rap-Tourism with Multi-Dimensional Scaling (MDS) approach. E3S Web of Conferences, 317: 05004. https://doi.org/10.1051/e3sconf/202131705004
[28] Kavanagh, P., Pitcher, T.J. (2004). Implementing Microsoft Excel software for Rapfish: A technique for the rapid appraisal of fisheries status. Fisheries Centre Research Reports, 12(2). https://doi.org/10.14288/1.0074801
[29] Kruskal, J.B. (1964). Nonmetric multidimensional scaling: A numerical method. Psychometrika, 29(2): 115-129.
[30] Paracchini, M.L., Bulgheroni, C., Borreani, G., Tabacco, E., Banterle, A., Bertoni, D., Rossi, G., Parolo, G., Origgi, R., De Paola, C. (2015). A diagnostic system to assess sustainability at a farm level: The SOSTARE model. Agricultural Systems, 133: 35-53. https://doi.org/10.1016/j.agsy.2014.10.004
[31] Saeed, B.B., Wang, W. (2014). Sustainability embedded organizational diagnostic model. Modern Economy, 5(4): 44997. https://doi.org/10.4236/me.2014.54041
[32] Jaworska, N., Chupetlovska-Anastasova, A. (2009). A review of multidimensional scaling (MDS) and its utility in various psychological domains. Tutorials in Quantitative Methods for Psychology, 5(1): 1-10. https://doi.org/10.20982/tqmp.05.1.p001
[33] Ningsih, W.W., Iskandar, R., Kasutjianingati, K. (2022). Sustainable dimensional status analysis in dragon fruits agribusiness development in Banyuwangi. In 2nd International Conference on Social Science, Humanity and Public Health (ICOSHIP 2021), pp. 131-136. https://doi.org/10.2991/assehr.k.220207.021
[34] UNDP (United Nations Development Programme). (1990). Human Development Report 1990. New York
[35] BPS. (2018). Area and Distribution of Critical Land by Province (Hectares), 2011-2018. https://www.bps.go.id/en/statistics-table/2/NTg4IzI%253D/area-and-distribution-of-critical-land-by-province.html.
[36] Kavanagh, P. (2001). Rapid appraisal of fisheries (Rapfish) project. Rapfish software description (for Microsoft Excel). Fisheries Centre, University of British Columbia. Vancouver, BC, Canada.
[37] BPS-Statistics of Indonesia. (2023). Production of Soybeans by Province (ton/ha), 1993-2015. https://www.neliti.com/publications/52118/production-of-soybeans-by-province-ton-1993-2015#.
[38] Neves, M.C., de Figueiredo Silva, F., Freitas, C.O. (2021). The effect of extension services and credit on agricultural production in Bolivia, Peru, and Colombia. Technical Note No. IDB-TN-2218. Inter-American Development Bank.
[39] Managanta, A.A. (2020). The role of agricultural extension in increasing competence and income rice farmers. Indonesian Journal of Agricultural Research, 3(2): 77-88. https://doi.org/10.32734/injar.v3i2.3963
[40] BPS-Statistics of Indonesia. (2023). Productivity of Soybeans by Province (ton/ha), 2006-2015. https://www.bps.go.id/id/statistics-table/3/ZUhOVVpHSXdTamxzTDBsUk5qQjBjMlZoTUdvd1FUMDkjMw==/produksi-jagung-dan-kedelai-menurut-provinsi.html?year=2015.
[41] Amato, L.H., Cebula, R.J., Connaughton, J.E. (2022). State productivity and economic growth. Regional Studies, Regional Science, 9(1): 180-203. https://doi.org/10.1080/21681376.2022.2059393
[42] Ikhsan, M., Indrawati, S.M., Virananda, I., Abdi, Z. (2021). The Productivity and future growth potential of Indonesia. Economics and Finance in Indonesia, 67(2): 6. https://doi.org/10.47291/efi.v67i2.996
[43] Candra, D.S. (2011). Analysis of critical land in The Musi Watershed using geographic Information systems. International Journal of Remote Sensing and Earth Sciences (IJReSES), 8(1): 13-18. http://doi.org/10.30536/j.ijreses.2011.v8.a1735
[44] Mulyani, A., Mulyanto, B., Barus, B., Panuju, D.R., Husnain. (2023). Potential land reserves for agriculture in Indonesia: Suitability and legal aspect supporting food sufficiency. Land, 12(5): 970. https://doi.org/10.3390/land12050970
[45] Baig, M.B., Aldosari, F. (2013). Agricultural extension in Asia: Constraints and options for improvement. The Journal of Animal & Plant Sciences, 23(2): 619-632.
[46] Porter, M.E. (1998). Clusters and the new economics of competition. Boston: Harvard Business Review, 76(6): 77-90.
[47] Lewis, M., Piercy, N., Phillips, W., Palmer, J. (2015). Towards a model of the intervention process. Policy & Politics, 43: 255-271.