Mahmud Alpusari*![]() | Zulfan Saam
| Zulfan Saam![]() | Isjoni
| Isjoni![]() | Nofrizal
| Nofrizal![]()
© 2024 The authors. This article is published by IIETA and is licensed under the CC BY 4.0 license (http://creativecommons.org/licenses/by/4.0/).
OPEN ACCESS
Rantau Baru Village is a fishermen's traditional village located on the banks of the Kampar River. Because of the fish season and declining fish population, the fishermen's economy is currently unstable. In addition, the natural disasters caused by massive floods in the last 10 years, specifically also affected the fisherman's welfare. This study aimed to evaluate the ecological, social, and economic aspects of Rantau Baru Village before formulating an eco-socio-educational model in environmental management for the local fishing community. The research was performed through field observation and interviews. Eco-socio-education sustainability in environmental management was analyzed based on the Multidimensional Scaling (MDS) approach using the Rapid Assessment Technique for Fisheries (RAPFISH) program. An eco-socio-educational model was based on important variables in the Leverage of Attributes analysis. The eco-socio-educational model applied to environmental aspects, namely forest reforestation counseling, landscape rehabilitation, and environmentally friendly fishing gear; to social aspects, namely healthy living behavior, education on types of diseases, improvement of health facilities such as the provision of clean water, drinking water, and adequate public sanitation; to economic aspects, training and mentoring to business actors or micro small and medium enterprises, starting to introduce the development of ecotourism and fisheries tourism.
Rantau Baru Village, eco-socio-educational model, multidimensional scaling, RAPFISH, environmental management
Sustainable development is an ecological area that is sustainable in supporting human life and can improve the quality of life of current and future generations. In addition, Biotrop (Southeast Asian Regional for Tropical Biology) [1] also defined sustainable development as a process that optimizes the benefits of natural and human resources by harmonizing natural resources with humans in development. Environmental management provides economic, social, and cultural benefits and needs to be carried out based on the principles of prudence, ecological democracy, and decentralization, as well as recognition and respect for local wisdom and environmental wisdom so that the environment must be protected and managed properly based on the principle of justice [2].
Sustainable development is a development process that optimizes the benefits of natural resources and human resources sustainably. To achieve sustainable development, the ability of natural resources that sustain a space consisting of land, rivers, and human activities must be harmonized [3].
Rantau Baru Village, Riau Province, Indonesia is a fishing village located on the banks of the Kampar River. The Kampar River originates in Bukit Barisan, West Sumatra, and empties into the east coast of Sumatra Island in Riau Province (a length of 4,135 km) [4], which has become the main source for the fishermen to live their lives. The people of Rantau Baru Village prefer to become fishermen for their source of income. Fishermen still use fishing gear to maintain the ecosystem and fish population. However, the fishermen's economy is currently unstable due to several factors. Fishermen depend on the declining fish season, natural factors, and sometimes the scarcity of fuel oil for their boats makes it difficult for fishermen to go fishing.
Environmental problems are multidimensional problems involving various groups [5]. In addition, it was reported by residents that in the last 10 years in 2 Rantau Baru Villages, the biggest flood disasters in 2005 and 2019 were as high as 2 meters. Further research and social approaches need to be carried out to find out the root of this problem. Studying in terms of ecological, social, and economic aspects of the community around the Kampar River is necessary. Also, the social approach through education is one of the important components in sustainable development, especially development related to humans as social beings. Human development is a vital part of the investment needed in economic development because it is an investment channel prepared for the young generation as the next generation who will continue economic improvement both individually for their families and in groups for their communities [6]. In order to provide comprehensive insights, a comprehensive assessment related to biodiversity and ecological potential was performed before eco-socio-educational modeling was built. This research conducted a study case on establishing an eco-socio-educational model for developing a sustainable environment in Rantau Baru Village, Riau Province, Indonesia.
Environmental management for fishing requires regulations and policies to be made by the Regional Government. Local community participation also has the right to provide policy advice and is obliged to protect and manage the environment. The benefits of active community participation that contribute to overcoming environmental problems are increasing independence, community empowerment, and partnerships, developing community skills and pioneering, growing community responsiveness to carry out social supervision, and developing and maintaining local culture and wisdom in the context of environmental conservation [7].
2.1 Location and research timeline
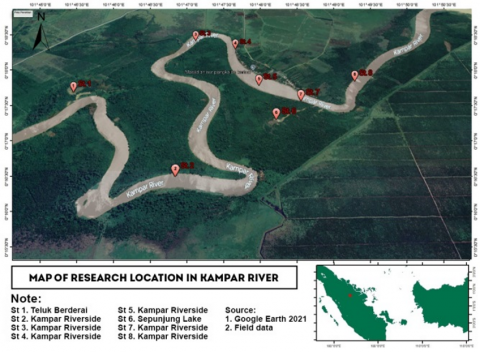
This research was conducted in Rantau Baru Village, Pangkalan Kerinci District, Pelalawan Regency, Riau Province, Indonesia. The research was started from May 2022 to March 2022 (Figure 1).
Figure 1. Research location
2.2 Geographical location of Rantau Baru Village
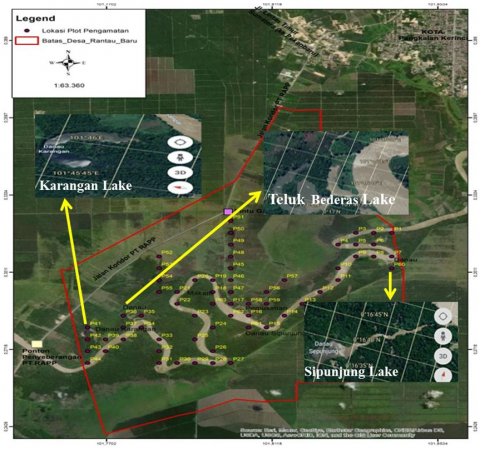
Geographically, Rantau Baru Village is between 00018'07.6" East Longitude and 101048'25.2" South Latitude. The area of Rantau Baru Village is ±10,000 ha. Rantau Baru Village comprised three urban villages, six hamlets, and 12 neighborhoods. Rantau Baru Village was in the southwest of the capital of Pelalawan Regency with a distance of ±17 km, and there were lakes in river waters, including Lake Karangan, Lake Teluk Bederas, and Lake Sipunjung. A Map of Rantau Baru Village can be seen in Figure 2.
Figure 2. Map of Rantau Baru Village and Lake Positions, Pangkalan Kerinci District, Pelalawan Regency
2.3 Data collection
The data were collected from field studies and literature reviews. Primary data collection in this study was obtained using observation sheets and questionnaires. The questionnaire was used to determine the appropriate eco-socio-educational model for social, economic, and cultural in Rantau Baru Village. The questionnaire contains a number of eco-socio-education indicators that refer to research indicators. The questionnaire given to members of the socio-economic and cultural sample in this study was 70 respondents, consisting of 10 respondents from village officials and 60 respondents from the Rantau Baru Village community.
2.4 Materials
The data obtained in this study has several parts based on aspects studied, including Ecology, Social, Economic, and Cultural aspects. The tools and materials needed are presented in Table 1.
Table 1. Tools and materials in the observation of ecological data
|
Component |
Tools |
Materials |
Additional Information |
|
Vegetation |
Scales Plastic rope Observation board Camera Stationery Paper table Luxmeter Soil tester |
Identification book Sampling plastic Label paper |
In-field sampling. Plant identification in the laboratory |
|
River and Lake |
Observation board Fishing gear |
Identification book Sampling plastic |
In-field sampling. Fish identification in the laboratory |
|
Ecology |
pH meter Thermometer Seccidisk |
Label paper |
2.5 Data analysis
This research required a data analysis and interpretation that was used to answer research questions that reveal ecological, social, economic, cultural, and human resource phenomena so that data analysis was a process of simplifying data into an easy-to-read form. The data analysis design is described in Table 2.
Table 2. Research data needs
|
Data Details |
Data Sources |
Methods |
|
Plant Ecology 1. Tree 2. Pole 3. Sapling |
Field-sampling (in situ) |
Line Transect and Square Plot |
|
Ecology of rivers and lakes fish |
Field-sampling (in situ) |
Direct observation in the field |
|
Water quality 1. pH 2. temperature 3. Dissolve Oxygen (DO) 4. Chemical Oxygen Demand (COD) Soil Environmental Quality 1. pH 2. Humidity 3. temperature |
Field-sampling (in situ) |
Digital measurement |
The analysis of the Fish biodiversity index followed the mathematical model quoted in study of Elvyra [8] as follows:
Species diversity index. Species diversity (H') was analyzed using the Shannon-Wiener Diversity Index:
$H^{\prime}=-\sum P i \operatorname{Ln} P t ; P i=\frac{n i}{N}$ (1)
where, H’=Diversity index; ni=Number of individuals of the species; N=Total number of individuals in the sample.
Dominance index. The dominance index (C) was analyzed using the Simpson Dominance Index:
$C=\sum P i^2=P i=\frac{n i}{N}$ (2)
where, C=Dominant index; ni=Number of individuals of the species; N=Total number of individuals in the sample.
Evenness index. The evenness index (e) was analyzed using the Pielou Index:
$e=\frac{H^{\prime}}{H \max } ; H \max =L n S$ (3)
where, e=Evennes index; H’=Diversity index; S=Number of species.
Similarity index. The similarity index (S) was analyzed using the Sorensen similarity index:
$I S=\frac{2 c}{2 c+a+b} \times 100 \%$ (4)
where, IS=similarity index; a=Number of species types found only in sample A; b=Number of species types found only in sample B; c=An equal species types were found in both samples.
The wealth index. The wealth index (R) was analyzed using the Margalef wealth index [8, 9]:
$R=\frac{S-1}{\operatorname{Ln}(N)}$ (5)
where, R=richness index; S=Number of species; N=Total number of individuals.
2.6 Eco-socio-educational model on the environmental potential of the local community of Rantau Baru Village
Analysis of the sustainability status of eco-socio-education in environmental management for the local community of Rantau Baru Village, Pangkalan Kerinci District, was performed through the following stages:
(1) Analysis of data related to eco-socio-education in environmental management for the local community of Rantau Baru Village, Pangkalan Kerinci District, using the results of field surveys and literature reviews.
(2) Determine attributes and scores on each ecological, social, and economic dimension based on Rapfish literature.
(3) Conduct an assessment (scoring) on each attribute through observations, interviews, and literature studies.
(4) Perform multidimensional scaling (MDS) analysis to determine coordination and stress value through ALSCAL Algorithm using Microsoft Excel-based Rapfish software.
(5) Determine the position of attributes in bad and good ordination.
(6) Perform Leverage analysis to determine attribute sensitivity and Monte Carlo analysis to consider uncertainty.
The sustainability index eco-socio-education could be categorized into four criteria.
Table 3. Sustainability index eco-socio-education dimension
|
Index Value |
Criteria |
|
0 – 25 |
Non-sustainable |
|
>25 – 50 |
Less sustainable |
|
>50 – 75 |
Medium sustainable |
|
>75 - 100 |
Sustainable |
The value of the eco-socio-education composite index in environmental management for the local community of Rantau Baru Village, Pangkalan Kerinci District, was as follows:
$I K E L=\sum W i x D i$ (6)
where, Wi=Weight of each dimension; Di=Index value of each dimension.
3.1 Water and land environmental conditions
Physico-chemical conditions of aquatic environment. Good water quality is very important to support the survival of organisms that live in the surrounding area. Water quality status must be determined as a reference in monitoring good water quality [10]. Measurement of water quality parameters included physical and chemical parameters. The overall results of the quality of Kampar River and lake water at each station are presented in Table 3.
The temperature in the Kampar River ranged from 27 – 29℃. Where the lowest temperature was at station seven while the highest temperature was at four stations, namely station two, station four, station five, and station eight. According to Government Regulation No. 82 of 2001 Class II, the quality standard of temperature parameters was 26 – 32℃. Therefore, the temperature in this research area followed quality standards and was considered good for the survival of aquatic organisms. Overall, the temperature conditions at the study site were very supportive of aquatic life [11].
COD levels analyzed in the Kampar River ranged from 10-46 mg / L. COD levels at Station Seven were 10 mg / L. The quality standard of the Republic of Indonesia State Regulation No. 82 of 2001 sets the COD threshold value at 10 mg / L in class 1, while higher than that is classified as class II. High COD values are undesirable for fisheries and agricultural purposes. COD values in unpolluted waters are usually less than 20 mg / L, while in polluted waters can be more than 200 mg / L, and in industrial waste can reach 60,000 mg / L [10]. COD is a chemical oxygen requirement to decompose all organic matter contained in the water [12].
Measurements of acidity (pH) in the field at each station showed a marked difference, with stations 2 and 3 showing a lower pH than the other stations. The pH value of each station ranged from 5.8 to 6.7. Based on the quality standards of water quality parameters of Government Regulation Number 82 of 2001 class II, the pH value of Bederas Bay at station two and Kampar River at station three was not in accordance with the established quality standard limit of 6-9, so that the pH value of Kampar river is still feasible to support the life of aquatic organisms. Indriyanto [13] also explained that the pH of water ranging from 4.0 to 11.0 is still within the tolerance limit of aquatic life.
Dissolved oxygen was measured in the field and obtained different results from each station. The range of DO values at each station was 8.6-11.5 mg / L. The highest dissolved oxygen concentration was found at station seven, which was 11.5 mg / L, and the lowest dissolved oxygen was found at station two, which was 8.6 mg / L. Based on Government Regulation Number 82 of 2001 class II, the minimum threshold of dissolved oxygen is >4 mg / L so that the concentration of dissolved oxygen in the river is still in accordance with the established quality standard limits. The high concentration at station seven was due to the lush shrubs and low community activities at the location.
Physico-chemical conditions of the land environment. Peat is widely known as a source of hydrology, which can maintain moisture content. A source of hydrology means that alkaline pH conditions can maintain the water and prevent damage to water content. Economically, a provider of fish and wood [14]. Due to logging and/or land use change activities, peat swamp forests were threatened with high damage. The condition of peat forests that are vulnerable to environmental changes is one of the reasons to know the characteristics of primary peat swamp forests [15]. The observed study site was a riparian zone (river flow), that flowed through the Kampar River, as well as several tributaries and lakes of water. The results of observations of environmental conditions on each parameter can be seen in Table 4.
The pH at all stations was relatively neutral, and pH conditions were fairly neutral to alkaline with high humidity intensity indicating the condition of the land at the study site was relatively wet and flooded. This is because almost all observation sites were right on the edge of the river and had waterlogged conditions.
The results of soil moisture measurements found the lowest value of 32.67% RH at station three, while the highest value was found at station one with a value of 70.5% RH. The results of environmental humidity measurements found the lowest value at station four, with a value of 66.67% RH, and the highest value at station eight, with a value of 81.23% RH. The results of measuring measurements at ambient temperature obtained the lowest results at station one, with a value of 25.27 ℃, and the highest at station six, with a value of 30 ℃. The results of light intensity measurements found relatively low results with an average in the range of 500 lux. The lowest value was found at station six, with a value of 79.8 lux, and the highest value was found at station seven with a value of 507.53 lux.
The low light intensity found due to the condition of peat swamp forests at the study site was still classified as having relatively moist forest vegetation. This condition was because the tree canopy was tight, blocking the light from entering the soil surface. Light intensity correlates with header density in a forest ecosystem. Light intensity and pH affect the state of soil humus [16]. Wind speed measurements at all observation stations ranged from 0 to 0.33 m/s. The highest values were found at station two, with wind speeds of 0.33 m/s.
Table 3. Conditions of water parameters at the sampling site
|
No. |
Parameter |
Sampling Station |
|||||||
|
1 |
2 |
3 |
4 |
5 |
6 |
7 |
8 |
||
|
1 |
Air temperature (℃) |
33.8 |
33.1 |
33.2 |
32.3 |
33.2 |
31.2 |
30.1 |
31.2 |
|
2 |
Water temperature (℃) |
28 |
29 |
28 |
29 |
29 |
28 |
27 |
29 |
|
3 |
COD (mg/L) |
32 |
46 |
22 |
24 |
32 |
26 |
10 |
12 |
|
4 |
pH |
6.1 |
5.9 |
5.8 |
6.2 |
6.2 |
6.4 |
6.5 |
6.7 |
|
5 |
DO |
9.02 |
8.6 |
11.1 |
10.9 |
10.2 |
10.7 |
11.5 |
11.4 |
Table 4. General environmental conditions at all observation stations
|
Parameters |
ST-1 |
ST-2 |
ST-3 |
ST-4 |
ST-5 |
ST-6 |
ST-7 |
ST-8 |
ST-9 |
ST-T |
|
pH |
7.33 |
7.2 |
7 |
7.43 |
7 |
7.45 |
6.43 |
7.17 |
7.3 |
7.5 |
|
Soil relative humidity (% RH) |
70.5 |
48 |
32.67 |
61.67 |
60.67 |
58 |
68.67 |
67.67 |
55.67 |
64.67 |
|
Environmental humidity |
75.33 |
77.2 |
72.6 |
67.7 |
66.67 |
70.8 |
79.03 |
81.23 |
77.43 |
76.8 |
|
Temperature (℃) |
25.27 |
26.83 |
26.53 |
27.37 |
27.77 |
30 |
28.37 |
28.63 |
29.57 |
29.87 |
|
Light intensity (lux) |
428 |
188 |
106.33 |
151.9 |
89.53 |
79.8 |
507.53 |
345.67 |
112.57 |
109.8 |
|
Wind speed (m/s) |
0 |
0.33 |
0.4 |
0.27 |
0.5 |
0 |
0.07 |
0 |
0 |
0 |
3.2 Existing conditions of water and land biodiversity
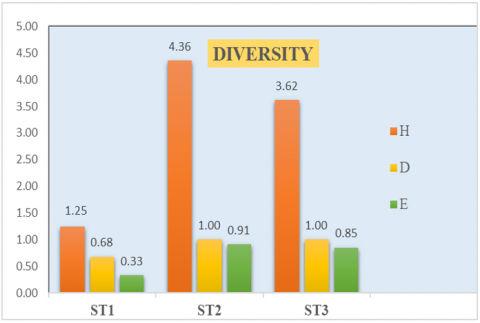
Existing conditions of fish diversity. The index of fish diversity at all stations ranged from 1.25 - 4.36 (Figure 3). The highest diversity index was found at station two, with a value of 4.36 [17]. The value was classified as high, indicating that the distribution of individuals of each species or genera was high, the stability of the community was high, and the waters were not polluted. The high diversity at station two was caused by the fishing nets. Fish diversity was high in the Kampar River, followed by Lake Sipunjung.
Figure 3. Fish Diversity Index. H=Diversity index; D=Dominance index; E=Similarity Index
The fish uniformity index obtained at each station ranged from 0.33 to 0.91, in which the uniformity index was highest at station two and lowest at station one. The uniformity index at station two was 0.9063, indicating a balanced value because the location was still natural [18]. A group of type A fish was relatively more abundant than others.
The dominance index obtained during the study ranged from 0.68-1, with the highest dominance value found at stations two and three with a value of 1, the high dominance index was caused by the low distribution of fish at the station, and this was also caused by the fishing gear used was selective fishing gear, in which only certain types of fish were caught at the station.
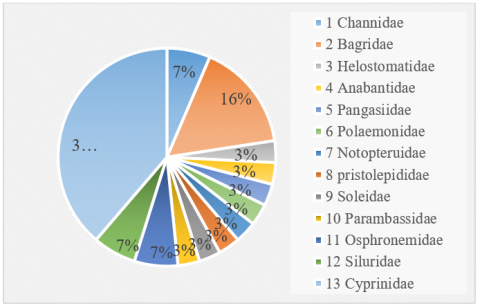
The number of fish species found included 12 species of Cyprinidae and 5 species of Bagridae (Figure 4). Fish of the Cyprinidae family were found at almost all sampling stations. The abundance of fish from the family Cyprinidae is more common in freshwater. According to [19], fish of the Cyprinidae family are more commonly found along the Ogan River and Komiring River, in South Sumatra.
Figure 4. Number of fish family found in the water of the Kampar River
In the Bagridae family, four species of fish have been identified, including Hemibagrus nemurus, Mystus micracanthus, Mystus nigriceps, and Mystus wyckii. The distribution area of the Siluridae Family in Indonesia included Sumatra, Kalimantan, and Java (Paparan Sunda). The most common fish species in Indonesian water comes from Kryptopterus [20].
Existing conditions of plant biodiversity. Based on the results, the observation fields can be categorized as a secondary swamp forest. Secondary swamp forests are forests that grow and develop in wetland, riparian, and tidal zones and have undergone human intervention [21]. Several types of vegetation analysis, such as biodiversity index, dominance index, distribution index, and richness index can be seen in Table 5.
Table 5. Vegetation analysis based on diversity index, dominance index, distribution index, richness index
|
No |
Vegetation Stand Level |
Number of Individual |
Number of Species |
Diversity Index (H’) |
Dominance Index (C) |
Evenness Index (e) |
Richness Index (R) |
|
1 |
Sapling |
156 |
26 |
2.65 |
0.10 |
1.87 |
4.95 |
|
2 |
Pole |
257 |
29 |
3.06 |
0.05 |
2.10 |
5.05 |
|
3 |
Tree |
455 |
32 |
2.88 |
0.07 |
1.92 |
5.07 |
Based on Table 5, the results of the analysis on several indices of each type of vegetation or stands of plants are obtained. The results of the analysis of vegetation on the type of sapling stand showed that the 2 largest species based on the IVI value were Ixora sp. and Dillenia excelsa. The results of the analysis on the diversity index (H') were obtained with 2.65 with moderate diversity criteria. The results of the analysis of the dominance index (C) were obtained with a value of 0.10 with low criteria, an evenness index (e) of 1.87 with even criteria, and a richness index (R) of 4.95 with moderate criteria. Species diversity is used to determine community structure [22].
The results of the analysis on pole stands found a greater number of individuals than before, with a total of 257 individuals consisting of 29 species. The largest species based on the important index value were Ixora sp. and Dillenia excelsa. The analysis results on the diversity index obtained a value of 3.65 with high criteria. Dominance index obtained a value (C) of 0.05 with low criteria, evenness index analysis results (e) obtained a value of 2.10 with even criteria, species richness index (R) with a value of 5.05 with high criteria. The smaller the dominance index value, the smaller the dominance pattern of the species, and vice versa [22].
The results of the analysis on tree stands found that the number of individuals was higher, namely 455 individuals consisting of 32 plant species. In the analysis of tree stands, it was found that 3 types of plants had the highest important index values, namely Glutha rengas with a value of 62.55%, Guoia sp. with the local name of peg wood (29.57%), and Dillenia excelsa (28.07%). The results of the analysis on the diversity index obtained a value of 2.88 with medium criteria, a dominance index (C) with a value of 0.05 with low criteria, an evenness index of 1.92 with even criteria, and a richness index (R) with a value of 5.07 with high criteria. The species abundance index (e) describes the even distribution or distribution of individuals among other species in a community area. The more species found in a community, the higher the species richness index [23].
Glutha rengas trees can grow tall and become one of the characteristics of peat swamp plants. The results of an interview with one of the local people, Datuk Sari Koto, clarified that the community had guarded this tree species for a long time. This is because the rengas tree is a protected species. After all, this plant was home to bees known as sialang. Therefore, the community's belief allowed the Rengas tree to grow and dominate at the tree level. Certain plant species that dominate in a community with a highly important index can grow and develop in various environmental conditions, both at acidity levels and high soil temperatures [24].
3.3 Social mapping, economic and cultural values of Rantau Baru Village
Level of education. The condition of the local community of Rantau Baru Village based on their level of education is shown in Table 6.
Table 6. Resident data by education level
|
No |
Level of Education |
Number |
% |
|
1 |
Unfinished school |
15 |
2.1 |
|
2 |
Not in school |
115 |
16.2 |
|
3 |
Elementary school |
276 |
38.8 |
|
4 |
Junior high school |
137 |
19.3 |
|
5 |
Senior high school |
139 |
19.5 |
|
6 |
Diploma |
3 |
0.4 |
|
7 |
Bachelor |
26 |
3.6 |
|
|
Number |
711 |
|
The education level of the local community of Rantau Baru Village predominantly graduated from elementary school (38.8%). This level of education by society comes first, but society argued that it was better to work than go to school to make money.
Health aspect. Health facilities in Rantau Baru Village consisted of two posyandu’s facilities (posyandu: an Indonesia community health service) and one midwife's house. Health workers in Rantau Baru Village have two midwives from the health office, ten posyandu cadres, and four birth attendants. The community did not have any health insurance. Toiletry facilities for each resident's house were still inadequate and inadequate. Many residents still used the river for toilets. People use river water for bathing, washing, and cooking rice. People who use toilets in the river are one of the factors of habit and decline of parents and comfort in the environment [26].
Social pressure aspect. The social pressure that existed on the local community of Rantau Baru Village began with the development of forest management areas by the State in the form of industrial forest management. Geographically, the landscape owned by Rantau Baru Village produced tropical forests that are quite good and abundant with ample swampland conditions. In fact, until now, forests as land cover in controlling rainfall that can cause flooding have gone. Social conflicts between the indigenous people of Rantau Baru Village and companies that obtained permits to cut forests often occur, but the struggle has only been in vain, and the company was still operating.
Household conditions. In Rantau Baru Village, the average number of one family was 3 to 4 people. The number of families in Rantau Baru Village was 224 families with a population of 787 people. According to [27], the large number of family dependents will affect income. If the income of a family is low, it will cause the family to experience poverty, if the income is high and exceeds the consumption in the family, it will increase welfare in the family.
Household income and village income. Based on the results of discussions and interviews with the local community of Rantau Baru Village, the local community of Rantau Baru Village was dominated by fishermen. The income of the community as fishermen fluctuated to factors of water environmental conditions, seasons, and tides. The average monthly income of the community ranged from 2.8 million to 3 million rupiahs per month. The minimum wage determined by the Pelalawan Regency government was Rp 3,002,383.89 (± 203 USD). This value showed that the average income of the people of Rantau Baru Village was still able to provide a decent income, it would be better if followed by maintaining the preservation of nature, especially the aquatic environment along the Kampar River.
Culture of Rantau Baru Village. Datuk Sati and Datuk Sari Koto led the customary structure of Rantau Baru Village. All problems in customary activities in Rantau Baru Village were resolved in stages. In addition, the value of local wisdom in Rantau Baru Village applied to granting moral status to abiotic and biotic objects other than humans. Abiotic objects in the local wisdom of Rantau Baru Village were lakes such as Lake Sipunjung, Lake Karangan, and Lake Teluk Bederas. The role of adat in protecting the environment was needed in community life. People always take care of the environment, both taking wood in nature and taking fish in rivers using simple fishing gear. Indigenous stakeholders always instill philosophical values and awareness in protecting the environment. Wati [28] stated that in optimizing indigenous peoples in protecting the environment, it is necessary to improve the quality of human resources, the role of the government, and good law enforcement.
3.4 Formulation of eco-socio-education model in sustainable environmental management
Eco-socio-education development is one of the sustainable development sectors that aims to utilize environmental services in preserving natural resources and local wisdom and increasing economic income for the surrounding community. Eco-socio-education development can be done by applying local wisdom owned by local communities in managing available natural resources. This aimed to increase the goal of developing eco-socio-education to bridge the sustainability of ecological, economic, and social functions sustainably. The measurement results of indicators from the distribution of questionnaires can be seen in Table 7.
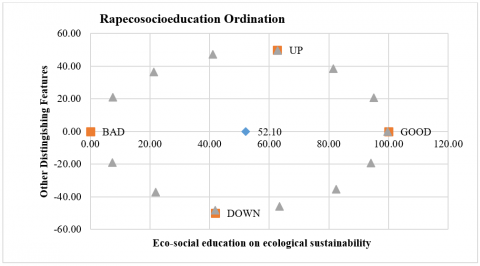
The results of the Multidimensional Scaling (MDS) analysis using the Rapecosocioeducation Program on the ecological dimension showed that the eco-socio-educational status of 52.10 was included in the moderately sustainable status category (Figure 5). The feasibility test results showed that the eco-social-educational model built on the ecological dimension was very good, with a Stress value of = 0.1506328. The Root Mean Square (RMS) or (R2) value was 0.9445699. This means that the existing variables have contributed 94.45% to the model. Thus, there was no need to add attributes/variables in the ecological dimension so that the model built was closer to the actual situation.
Based on the results of the leverage of attributes (Figure 6), the variable diversity of fauna, diversity of flora, and access of rivers and lakes to the environment was a sensitive variable on the ecological dimension that can improve the status of eco-social education in environmental management for fishing communities in Rantau Baru Village if improvements were made to these attributes.
Table 7. Overview of ecological indicator measurement results in Rantau Baru Village, Pangkalan Kerinci District, Pelalawan Regency
|
Indicator |
Sub-Indicator |
Results |
Ideal |
|
Ecology |
Access to Catch Fish |
2.06 |
Access to utilize resources of rivers and lakes |
|
Administrative Area Boundaries |
3.39 |
Comply with existing boundaries |
|
|
Concerned flora |
2.27 |
Vegetation should be spread out and varied |
|
|
Concerned fauna diversity |
1.61 |
Vegetation must be spread out and diverse as a preservation of fauna |
|
|
River and Lake Quality Degradation |
3.33 |
The vegetation along the river was diverse |
|
|
Fishing gear did not damage the river and lake |
2.26 |
The fishing gear used does not damage the environment |
|
|
Traditional Smoking Fish |
3.07 |
The fish increases the income of residents |
|
|
|
Average |
2.57 |
|
Figure 5. Eco-social education on ecological sustainability
Figure 6. Ecological leverage of attributes
The Economic Dimension in measuring environmental management activities obtained from the community has 4 components (Table 8). These components were then analyzed by Rapfish.
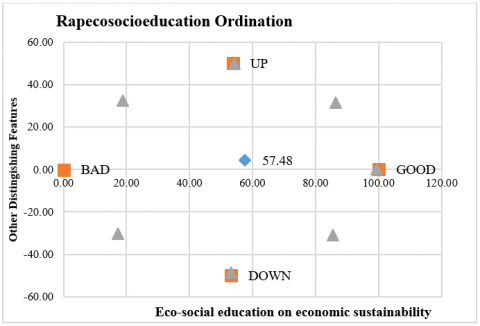
The sustainable economic dimension of eco-social education seen in the DMS has 4 attributes, including savings, savings and loans, income other than fishermen, and total income. The results of the MDS analysis using the Rapecosocioeducational Program on the economic dimension showed that the eco-socio-educational status of 57.48 was included in the fairly sustainable status category (Figure 7).
The results of the due diligence showed that the eco-social education model built on the economic dimension was very good, with a Stress value of = 0.185640, which was still below 0.25. The Root Mean Square (RMS) or (R2) value was 0.923364, which means that the existing variables have contributed 92.33% to the model. Thus, there was no need to add attributes/variables in the economic dimension so that the model built was closer to the actual situation.
Based on the results of the analysis of leverage of attributes (Figure 8), it showed that the variable total income and savings on the economy on eco-social education were a sensitive variable on the economic dimension, which can improve eco-social education status in environmental management for the fishing community of Rantau Baru Village if these attributes were improved.
The Social Dimension in measuring environmental management activities obtained from the community has 10 components (Table 9). These components were analyzed by Rapfish.
Table 8. Description of the results of measuring economic indicators in Rantau Baru Village, Pangkalan Kerinci District, Pelalawan Regency
|
Indicator |
Sub-Indicator |
Results |
Ideal |
|
Economy |
Not all heads of families have savings |
3.14 |
Having savings in Banks and cooperatives |
|
No Loan Source is available |
3.39 |
Savings and loan cooperatives to help the community |
|
|
The income of the community was not only from being fishermen |
3.06 |
Observation of fish from fishermen, oil palm, and pompong (one of the water transportation used in Rantau Baru Village for renting or fishing) |
|
|
The average income of the community was 2 million |
1.81 |
People must have income above 3 million |
|
|
|
Average |
2.85 |
|
Figure 7. Eco-social education on economic sustainability
Figure 8. Economic leverage of attributes
Table 9. Description of the results of measuring social indicators in Rantau Baru Village, Pangkalan Kerinci District, Pelalawan Regency
|
Indicator |
Sub-Indicator |
Results |
Ideal |
|
Social |
The physical condition was adequate |
1.49 |
Needs to improve the quality of roads, health, education, and electricity. |
|
|
Communication was maximized |
3.40 |
Internet network and communication must be maximized |
|
|
Community organization |
3.49 |
The fishing community must participate in the organization of the community |
|
|
Frequency of attendance while joining the organization |
3.27 |
Every community meeting must be present |
|
|
Benefits of joining the organization |
2.26 |
The benefits felt by the community were numerous |
|
|
Relationships within the organization |
3.07 |
Good impact and relationship |
|
|
Growing trust from cooperation |
3.14 |
Increase friendship and trust to be good |
|
|
Marketing results made easy |
3.39 |
Easy marketing and increased economic income |
|
|
Customary or culture |
3.17 |
Local customary contributed to a sense of community solidarity |
|
|
Community contribution to preserving local wisdom |
2.01 |
Local customary, village government control and environmental management |
|
|
Average |
2.87 |
|
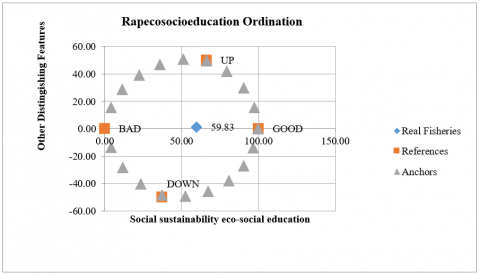
Figure 9. Social sustainability eco-social education
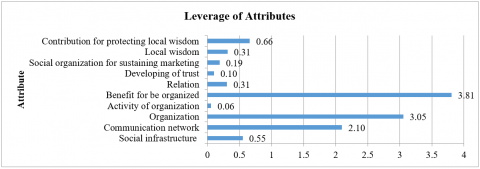
Figure 10. Social leverage of attributes
The results of the MDS analysis using the Rapec-Socio-Educational Program on the social dimension showed that the eco-socio-educational status of 59.83 was included in the moderately sustainable status category (Figure 9). The results of the due diligence show that the eco-social education model built on the social dimension was very good, with a Stress value of = 0.138309, which was still below 0.25. The Root Mean Square RMS) or (R2) value was 0.951505, which means that the existing variables have contributed 95.15% to the model. Thus, there was no need to add attributes/variables on the social dimension so that the model built was closer to the actual situation.
Based on the results of the analysis of leverage of attributes (Figure 10), it showed that there were three leverage variables, namely the benefits of organization, organization, and social communication networks. This means that based on the results of the leverage of attributes, the social benefits of organization, organization, and communication networks on eco-social education were sensitive variables on the social dimension, which can improve eco-social education status in environmental management for the fishermen community of Rantau Baru Village if improvements were made to these attributes.
3.5 The eco-socio-educational model in environmental management
The eco-socio-educational model intended in this study was designed based on the premise that ecological damage was caused, among other things, by anthropocentric human behavior [29]. Damage to the environment by human activities will improve the ecology through education given to the community. In addition, social and economic aspects related to ecology, including human behavior in waste disposal, family latrines, inappropriate land use, and use of non-environmentally friendly fishing gear, can be improved through education provided to the public. The rationale for education given to the public was also based on Poulo Freire's theory of awareness theory. This indicates how to provide awareness to the public about the importance of education [30]. The eco-social education model in environmental management is detailed in Table 10.
Based on the table, the development of the eco-social education model was developed in accordance with programs and activities that educate the people of Rantau Baru Village.
Educational activities on ecological aspects counsel the community about maintaining and increasing fish populations in rivers, which can be done by preserving forests, namely by reforestation. Reforestation is an important tool for reducing or reversing biodiversity loss and mitigating climate change [31]. The river as a habitat for fish must also be maintained in quality by educating healthy living without polluting the river, and it is expected that the government will participate in building clean water facilities and adequate public sanitation. Education on the economic aspect, by socializing the use of environmentally friendly fishing gear for fishermen and giving ideas for good "fishing management" as has been applied in other regions, namely fishing for certain species only at certain times of the year, determined by tides and the moon, so that fish stocks can be replenished [32]. In addition, conducting training and mentoring for micro, small, and medium enterprises or businesses, as well as introducing ecotourism to the community as a new, more sustainable livelihood by forming programs of nature tourism activities, river tours, and fishing tours that entertain and educate.
Table 10. Model eco-social education program in environmental management
|
No. |
Aspect |
Program |
Activity |
|
1 |
Ecology |
Environmental conservation |
Environmental Care Counseling |
|
Forest Reforestation |
|||
|
Landscape rehabilitation |
|||
|
Counseling on the Use of Environmentally Friendly Fishing Gear |
|||
|
|
|
Four programs |
|
|
2 |
Social economy |
Public health |
Clean Water Extension |
|
Use of Healthy Latrines |
|||
|
Health Behavior Counseling |
|||
|
Society's awareness of education's importance |
Socialization of education for life |
||
|
Introducing education and motivation to students |
|||
|
Completing Educational Facilities and Infrastructure |
|||
|
|
|
Clean water activity |
|
|
|
|
Healthy latrines |
|
|
|
|
Village business development |
Village Business Training and Assistance |
|
Village tourism |
Development of Fishing Tourism |
||
|
Village Tourism Development |
On average, the physical and chemical conditions of the waters and land environment of Rantau Baru Village were still in accordance with quality standards. Biodiversity in the waters of the Kampar River has decreased. Biodiversity in the Peat Forest showed that the vegetation that dominated the area was trees with moderate diversity. It was necessary to pay attention to the social, economic, and cultural conditions of Rantau Baru Village concerning the main livelihood of the community, namely fishermen who were very dependent on the river ecosystem. Moreover, the awareness of the community in protecting the environment was still low. The eco-social education model was designed to educate the community through several programs and activities focused on several variables in accordance with the results of MDS. Moreover, the awareness of the community in protecting the environment was still low. The eco-social education model was designed to educate the community through several programs and activities focused on several variables in accordance with the results of MDS so that it was expected to increase public awareness of sustainable environmental management in Rantau Baru Village.
The authors thanked to Department of Primary School Teacher Education, Faculty of Teacher Training and Education, University of Riau, Indonesia for giving support to accomplish this research.
[1] Biotrop (Southeast Asian Regional for Tropical Biology). (2013). Invasive alien species. http://kmtb.biotrop.org, accessed on Nov. 10, 2021.
[2] Chandra, F. (2020). Peran masyarakat hukum adat dalam mewujudkan pelestarian lingkungan hidup. Ekopendia, 5(1): 103-110.
[3] Vitasurya, V.R. (2016). Local wisdom for sustainable development of rural tourism, case on Kalibiru and Lopati village, province of Daerah Istimewa Yogyakarta. Procedia-Social and Behavioral Sciences, 216: 97-108. https://doi.org/10.1016/j.sbspro.2015.12.014
[4] Efrianto, E. (2023). Peranan Sungai Kampar dan Siak dalam Proses Migrasi Orang Minangkabau ke Semenanjung Malaya. Analisis Sejarah, 13(1): 35-41. https://doi.org/10.25077/jas.v13i1.96
[5] Mulyadi, A., Fauzi, M. (2015). Kualitas dan distribusi spasial karakteristik fisika-kimia perairan sungai siak sekitar kotamadya pekanbaru. http://repository.unri.ac.id/xmlui/handle/123456789/7137.
[6] Simanjuntak, F.N. (2017). Pendidikan untuk pembangunan berkelanjutan. Jurnal Dinamika Pendidikan, 10(2): 169-195.
[7] Arifin, M.Y. (2017). Pertumbuhan dan survival rate ikan nila (oreochromis. sp) strain merah dan strain hitam yang dipelihara pada media bersalinitas. Jurnal Ilmiah Universitas Batanghari Jambi, 16(1): 159-166. http://doi.org/10.33087/jiubj.v16i1.97
[8] Elvyra, R. (2009). Kajian keragaman genetik dan biologi reproduksi ikan lais di sungai Kampar Riau. Dissertation. Sekolah Pascasarjana. Institut Pertanian Bogor, Bogor. pp. 126.
[9] Fehlmann, G., O'riain, M.J., FÜrtbauer, I., King, A.J. (2021). Behavioral causes, ecological consequences, and management challenges associated with wildlife foraging in human-modified landscapes. BioScience, 71(1): 40-54. https://doi.org/10.1093/biosci/biaa129
[10] Gomes, A. (2022). Paulo Freire: Review of “the pedagogy of the oppressed”. Harm Reduction Journal, 19(1): 1-3. https://doi.org/10.1186/s12954-022-00605-9
[11] Hanum, N., Safuridar, S. (2018). Analisis kondisi sosial ekonomi keluarga terhadap kesejahteraan keluarga di gampong karang anyar kota langsa. Jurnal Samudra Ekonomi Dan Bisnis, 9(1): 42-49. https://doi.org/10.33059/jseb.v9i1.460
[12] Effendi, H. (2003). Telaah kualitas air bagi pengelolaan sumber daya dan lingkungan perairan. Yogyakarta: Kanisisus.
[13] Indriyanto. (2006). Ekologi Hutan. Jakarta (ID): Bumi Aksara.
[14] Magurran, A.E. (1988). Ecological diversity and its measurement. Princeton University Press, New Jersey. Silvikultur Tropika, 2(1): 40-45.
[15] Margalef, R. (1958). Temporal succession and spatial heterogeneity in phytoplankton. In Perspectives in Marine biology. Univ. Calif. Press, Berkeley, pp. 323-347.
[16] Maulidia, B., MOV, T.I.A., Maulidia, V. (2019). Regenerasi hutan gambut pada kawasan lahan gambut bekas terbakar di desa pasir dan desa sungai pinyuh, kabupaten mempawah, kalimantan barat. Pontianak (ID): Universitas Tanjungpura.
[17] Odum, E.P. (1993). Dasar-dasar ekologi umum. Diterjemahkan oleh T. Samingan. Gadjah Mada University Press. Yogyakarta. hlm, 574: 14-27.
[18] Putri, T.T.A. (2017). Pengelolaan sumberdaya lahan gambut di Kubu Raya Kalimantan Barat menuju lahan tanpa bakar. Jurnal Penelitian Agrosamudra, 4(2): 92-109.
[19] Rachmanadi, D., Faridah, E., Sumardi, S., van der Meer, P. (2017). Karakteristik Kerusakan Hutan Rawa Gambut Tropis Terdegradasi di Kalimantan Tengah. Jurnal Hutan Tropis, 5(2): 99-112. http://doi.org/10.20527/jht.v5i2.4363
[20] Rejeki, S., Irwani, I., Hisyam, F.M. (2013). Struktur Komunitas Ikan pada Ekosistem Mangrove di Desa Bedono, Sayung, Demak. Buletin Oseanografi Marina, 2(2): 78-86. https://doi.org/10.14710/buloma.v2i2.6943
[21] Dwi Astiani, R., Burhanuddin. (2017). Jenis-Jenis pohon penyusun vegetasi hutan rawa gambut di Semenanjung Kampar Kecamatan Teluk Meranti Provinsi Riau. Jurnal Hutan Lestari, 5(3). https://doi.org/10.26418/jhl.v5i3.21709
[22] Riskanita, D., Widowaty, Y. (2019). Upaya pemerintah daerah mengatasi kerusakan lingkungan akibat alih fungsi lahan berdasarkan konsep negara kesejahteraan. Supremasi Hukum: Jurnal Penelitian Hukum, 28(2): 123-135.
[23] Royani, S., Fitriana, A.S., Enarga, A.B.P., Bagaskara, H.Z. (2021). Kajian COD dan BOD dalam air di lingkungan tempat pemrosesan akhir (TPA) sampah Kaliori Kabupaten Banyumas. Jurnal Sains & Teknologi Lingkungan, 13(1): 40-49. https://journal.uii.ac.id/JSTL/article/view/16974/11009
[24] Suryadi, G., Thamrin, T., Murad, A. (2016). Perilaku masyarakat dalam memanfaatkan air sungai siak sebagai sumber kehidupan dan dampaknya terhadap estetika serta kesehatan lingkungan di wilayah waterfront wity wekanbaru. Dinamika Lingkungan Indonesia, 3(2): 100-106.
[25] Vaas, K.F., Sachlan, M., Wiraatmadja, G. (1953). On the ecology and fisheries of some inland waters along the rivers Ogan and Komering in South-East Sumatra (No. 3). Inland Fisheries Research Stations.
[26] Wibawa, K.C.S. (2019). Mengembangkan partisipasi masyarakat dalam perlindungan dan pengelolaan lingkungan hidup untuk pembangunan berkelanjutan. Administrative Law and Governance Journal, 2(1): 79-92.
[27] Wirabumi, P., Sudarsono, S. (2017). Struktur komunitas plankton di perairan waduk wadaslintang kabupaten wonosobo. Kingdom (The Journal of Biological Studies), 6(3): 174-184.
[28] Wati, E.P. (2018). Perlindungan dan pengelolaan lingkungan hidup dalam pembangunan yang berkelanjutan. Bina Hukum Lingkungan, 3(1): 119-126. https://doi.org/10.24970/jbhl.v3n1.9
[29] Rosana, M. (2018). Kebijakan pembangunan berkelanjutan yang berwawasan lingkungan di Indonesia. Jurnal Kelola: Jurnal Ilmu Sosial, 1(1).
[30] Rais. (2020). Profil desa Rantau Baru. Laporan Desa Rantau Baru. (tidak diterbitkan). Pelalawan.
[31] Cunningham, S.C., Mac Nally, R., Baker, P.J., Cavagnaro, T.R., Beringer, J., Thomson, J.R., Thompson, R.M. (2015). Balancing the environmental benefits of reforestation in agricultural regions. Perspectives in Plant Ecology, Evolution and Systematics, 17(4): 301-317. https://doi.org/10.1016/j.ppees.2015.06.001
[32] National Geographic Society. (2023). Sustainable fishing. https://education.nationalgeographic.org/resource/sustainable-fishing/.