Samer Hadi Kadhim*![]() | Sara Mahmood Al-Jawari
| Sara Mahmood Al-Jawari![]() | Naseer Abdul Razak Hasach
| Naseer Abdul Razak Hasach![]()
© 2024 The authors. This article is published by IIETA and is licensed under the CC BY 4.0 license (http://creativecommons.org/licenses/by/4.0/).
OPEN ACCESS
Sustainability includes maintaining the quality of life in the long term and preserving resources so that they reach future generations with good efficiency. Urbanization and government procedures followed cause the current form of land cover (LULC), which affects the land surface temperature (LST).The temperature rise can be linked to land use changes on the surface of the Earth, because there are few studies on the thermal behavior of cities in the southern and eastern regions of Iraq, therefore the research aimed to study the relationship between temperature variation and LC changes in QS District in Maysan Governorate using Remote sensing and geographic information system. The study used Landsat 8 imagery to draw a map of land cover and detect changes in urban mass with relation of surface temperature in 2013 and 2023.The research can help policymakers benefit from the results of this research to develop policies related to cities capable of adapting to the climate. The results revealed that there was an increase in thermal intensity and a significant decrease in water bodies during the study period, accompanied by an increase in the percentage of barren lands. This is a dangerous warning, as it could explain the migration of many residents of the marsh areas.
land surface temperature, LULC, GIS techniques, remote sensing, Iraq, Qalaat Salih
Land cover represents the natural state of the Earth's surface and the direct surface layer of the Earth. There is a difference between land cover and land use. Land cover is classified as a grouping of uses with similar characteristics into one group according to specific principles. Land use represents the distribution of human activities such as industry, trade, housing and so on [1].
Land surface temperature (LST) is the temperature emitted by various surfaces on Earth after they are heated by solar radiation. It can be measured by analyzing the wavelengths of the rays reflected from the Earth’s surface and its various components, especially infrared rays, thermal rays [2]. It is used in many applications related to weather and climate. The surface temperature of the Earth can also be defined as the temperature of the surface separating the air and the ground. It is known that the temperature of the air and soil can be measured using a thermometer [3].
However, there is no way to measure the temperature of the Earth’s surface, and if a sensor is used to measure it, it is greatly affected by the temperature of the air in contact with it, and the temperature of the soil in contact with it and thus the measurement process becomes subject to large errors, so remote sensing is used to measure thermal rays emanating from the Earth's surface to determine the temperature of the Earth's surface [4].
Many countries face noticeable changes in land use for many reasons, including those related to government procedures and following up on the implementation of structural plans and master plans for cities, and including those related to people, such as the increase in population, which increases the demand for road infrastructure facilities and the construction of new buildings. In the past few decades, many changes have occurred, in and around cities globally causing significant changes in the thermal environment (TE). Green spaces are very important for maintaining a balance between Earth's surface temperature and atmospheric factors [5]. Changing LULC categories, especially the built environment at the expense of vegetation, can effectively affect temperature change [6], and trees play a vital role in reducing temperatures by providing shade and facilitating the evaporation process [3], as research has shown that shade from trees it can reduce surface temperatures and air temperatures in urban areas by several degrees Celsius, as studies have shown that areas with higher tree cover experience lower daytime temperatures and reduced nighttime heat retention [7]. The cooling effects of planting trees are attributed to shade by tree canopies, which reduces direct solar radiation and limits the absorption and re-radiation of heat by the Earth's surface. Research conducted in various cities has consistently shown that increasing tree canopy cover leads to lower ambient air temperatures [8]. Wrong human practices have contributed to the deterioration of the vegetation cover of natural pastures, and ill-considered exploitation of water results in soil salinization [9]. Heat waves in cities pose a significant public health risk, especially to vulnerable populations such as the elderly and those with pre-existing health conditions. Trees help mitigate the impact of extreme heat events by providing shade, reducing surface temperatures, and reducing the risk of associated diseases with heat. Proximity and distance from bodies of water affect the temperature, as the winds coming from the water raise the temperature of the coastal areas near it [10]. The literature review highlights several gaps in current research, including the need to understand changes in cities for effective planning and sustainability.
Studying the relationship between urban land cover and temperatures is crucial to understanding the most important measures that planners and decision makers must adopt regarding future changes and selecting the most important policies supporting sustainability. There are no previous studies that discussed the topic of research in Qalat Saleh, but there are climate studies that have spoken in general about the environmental effects of climate change on resources and population, and these are old studies, which makes this study unique at the level of this analysis of the study area for the last ten years.
Maysan is one of the most important Iraqi cities, as there is a section of the southern Iraqi marshes in which it has been approved for inclusion on the World Heritage List by UNESCO as an international nature reserve, one of Iraq's eighteen provinces, Maysan city is situated in the southeast of the country. It covers 16,038 Km2 of land, and takes up (3.7%) of Iraq's total land area, which is 43,052 Km2. Its capital is Amarah, in addition to Ali Al-Gharbi, Al-Maimuna, Al-Majjar, Qalaat Saleh, and Al-Kahla, located on the Tigris River. Its borders are represented by the Wasit Province to the north and northwest, the Dhi Qar Province to the west, the Basra Province to the south, and the International Border with the Islamic Republic of Iran to the east [11]. Qalaat Salih, the history of the establishment of the city of Qalaat Saleh as an urban settlement (the center of a district) dates back to the sixties of the nineteenth century. It is located in the south of Maysan, refer Figure 1 and Figure 2.
The study area represented by Qalat Saleh District is located in the southeast of Maysan Governorate, from southeast Iraq, between latitudes 31° 28′ 57″ N - 31° 30′ 37″ N and longitudes 47° 13′ 27″ E - 47° 19′ 57″ E, it is bordered to the north by Al-Kahla district, to the south by Basra Governorate, and to the east, the Islamic Republic of Iran, and to the west, the Megar Al-Kabir district. It also consists of two administrative units: the center of the Qalaat Saleh district and the Al-Uzair district.
Studying the climate and urbanization is important for Qalaat Saleh district and its future planning, as it is very important in its population distribution, and it shows the importance of planning policies in determining housing and living and adapting to them. Studying the climate situation will help decision makers to take the necessary measures and precautions to confront any obstacles. Or upcoming challenges and the possibility of addressing them.
The area of Qalaat Saleh is about 1,411 square kilometers, equivalent to 2% of the governorate’s area. The district is about 40 km away from the center of the district. The population of Saleh Castle is 91,110 people, which represents about 10% of the governorate’s total population of 922,890 people. The population of Qalaat Saleh district in 2013 in the urban area was about 50,855 people and, in the countryside, it was about 50,176 people. The number of residents in rural and urban areas increased during the ten years, as shown in Table 1, which was obtained by the Iraqi Ministry of Planning.
Figure 1. Maysan Governorate from Iraq
Figure 2. Qalaat Salih location from Maysan Governorate
Table 1. Population of Qalaat Salih
|
Case Study Details |
Urban 2013 |
Rural 2013 |
Urban 2020 |
Rural 2020 |
|
QS District Center |
34,353 |
23,041 |
41,427 |
27,786 |
|
Al-Uzair |
16,501 |
27,134 |
19,899 |
32,722 |
|
Total |
50,855 |
50,176 |
61,326 |
60,508 |
Source: Iraqi Ministry of planning
To study the ground temperature in Qalat Saleh in its relationship with land cover types, two satellite images dating back to the years 2013 and 2023 were used for the Land Sat 8 satellite to find out the most important changes that have occurred in the urban environment in the last ten years, it is possible to study the urban changes of an area for ten years or more because the impact of these changes becomes clearer after a period of time has passed [12].
The study area has a certain peculiarity due to its passing through this period, which is the political and demographic changes and the lack of water allocations that occurred, which caused the decline of water from the marshes and the migration of the marsh population to the areas closest to services near the center of the district, which caused the decline of agriculture in places and its presence in other places, and this has a direct relationship to the change in temperatures. Then, the process of atmospheric correction was carried out, which is the process of removing the effects of the atmosphere on the values of the reflected spectral signal of the images captured by satellite sensors. The clearest satellite images were also selected on a clear day free of clouds and influences that could have an impact. Figure 3 shows the work steps that will be explained later.
Figure 3. A flowchart of the research methodology
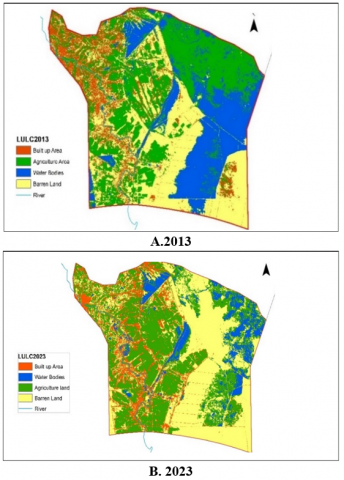
Conducting land cover change calculations using remote sensing and geographic information systems for the years 2013 and 2023, as in Figure 4 (A, B), through applying the supervised classification process.
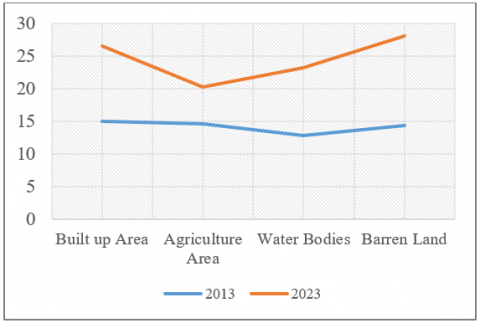
The results of the directed classification of the satellite image showed four land types, namely (Built-up Areas - Water bodies - Agricultural land - Barren land), whose areas and percentages of change were calculated as in Table 2.
Figure 4. Supervised classification of QS imagery 2013-2023
Table 2. Image classification in 2013, 2023
|
LULC 2013 |
|||
|
Land Cover |
Area(km2) |
Ratio% |
|
|
Water bodies |
301.8782 |
26.26 |
|
|
Agriculture land |
402.799704 |
35.05 |
|
|
Built up area |
99.901683 |
8.69 |
|
|
Barren land |
344.890414 |
30.00 |
|
|
Grand Total |
1149.47 |
100 |
|
|
LULC 2023 |
|||
|
Land Cover |
Area(km2) |
Ratio% |
Chang Ratio |
|
Water bodies |
102.331925 |
8.90 |
-17.36 |
|
Agriculture land |
445.127148 |
38.73 |
+3.68 |
|
Built up area |
148.072439 |
12.88 |
+4.19 |
|
Barren land |
453.898635 |
39.49 |
+9.49 |
|
Grand Total |
1149.47 |
8.90 |
|
Source: Iraqi Ministry of planning
There is a significant decrease in the area of water bodies, as a change of about 17.36% was recorded, and a significant increase in the areas of barren land with a change rate of about 9.49% in 2023 compared to 2013. As for the simpler changes, they were for the built environment and green areas, as a slight increase in change rates was recorded, amounting to 4.19 and 3.68%. respectively.
The second step: Calculate the ground temperature (LST) and calculate the equations for measuring spectral radiance according to the equations shown in Table 3.
Table 3. Calculating the Earth's surface temperature using Landsat 8 satellite images
|
1 |
Calculation of Top-of-Atmosphere (TOA) Radiance |
L(λ) = ML x Band 10 + AL – Oi TOA = 0.0003342 * "B10" + 0.10 - 0.29 Where: L(λ): TOA spectral radiance ML: Radiance multiplicative band (from MTL txt) AL: Radiance adds band #10 (from MTL txt) Oi: correction value (for Landsat 8 Band#10 its = 0.29) RADIANCE_MULT_BAND_10 = 0.000342 RADIANCE_ADD_BAND_10 = 0.10000 |
|
2 |
Conversion to Top-of-Atmosphere (TOA) Brightness Temperature |
Kelvin (k) to Celsius degree Co BT = K2 / ln (k1/L(λ)+1) – 273.15. BT = (1321.0789 / Ln (774.885 / "TOA" + 1)) - 273.15 Where: BT: Top of Atmosphere brightness temperature ℃ L(λ): TOA spectral radiance K1: K1 constant for band#10 (from MTL txt) K2: K2 constant for band#10 (from MTL txt) K1_CONSTANT_BAND_10 = 774.8853 K2_CONSTANT_BAND_10 = 1321.0789 |
|
3 |
Normalized Difference Vegetation Index (NDVI) |
NDVI = (NIR-RED) / (NIR+RED) |
|
4 |
Calculation of Land Surface Emissivity (LSE) |
PV = ((NDVI – NDVI min) / (NDVImax – NDVImin))2 PV= Square (("ndvi" + 0.190772) / (0.493179 + 0.190772)) Where: PV: Portion of Vegetation NDVI: values of NDVI image3 NDVI max/min: Max & Min values of NDVI image |
|
5 |
Calculation of land service emissivity from the equation |
E = 0.004 * PV + 0.986 E = 0.004 * "pv" + 0.986 Where: E: Land Surface Emissivity PV: Portion of Vegetation |
|
6 |
Land surface temperature (LST) calculation |
LST = BT / (1+ (λ * BT / C2) * ln (E)) LST= "BT" / (1 + (10.8 * "BT" / 14388) * Ln("E")) Where: BT: Top of Atmosphere brightness temperature Co λ: Wavelength of emitted radiance for Landsat8 Band#10 λ= 10.8 and for Band#11 λ=12 E: Land Surface Emissivity C2 = h*c/s C2= 14388 Km h: Plank’s constant = 6.626 * 10-34 Km s: Boltzmann constant = 1.38*10-23 JK c: velocity of light = 2.998*108 m/s |
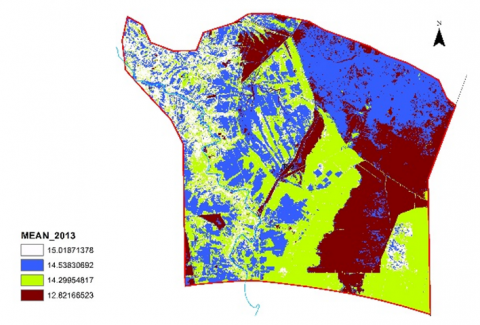
The Earth's surface temperature was derived from satellite images and is shown in Figure 5 for a comparison between the ten years under study.
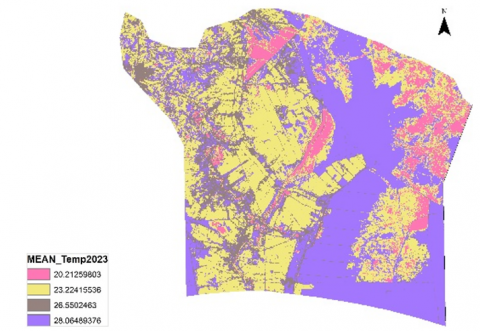
Figure 5. Average temperatures according to land cover for the years 2013/2023
The results indicate that the average surface temperature in Qalaat Saleh witnessed an increase during the period (2013 - 2023) (Figure 6). For each type of land cover, as follows (built-up area 11.5°, agricultural and green lands about 5.7°, water bodies 10°, while in barren lands it reached 13.8°) and the barren areas recorded the highest surface temperature throughout the study periods. The surface temperature in the built-up area in 2013 was the highest recorded, while the barren land was highest in 2023.
From the above, we can conclude several points, including:
Thermal map of data recorded from the satellite
Date: 3/2013
Thermal map of data recorded from the satellite
Date: 3/2023
Average temperature for 2013 according to land cover
Average temperature for 2023 according to land cover
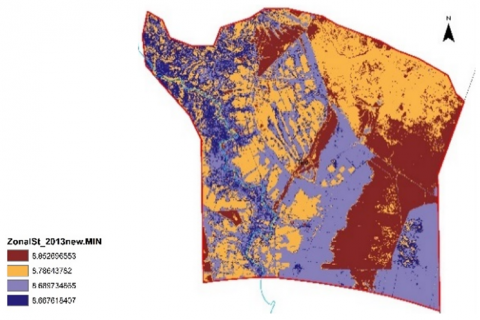
Minimum temperature in 2013 according to land cover
Minimum temperature in 2023 according to land cover
Maximum temperature in 2013 according to land cover
Maximum temperature in 2023 according to land cover
Figure 6. Results of temperature data for Qalaat Saleh
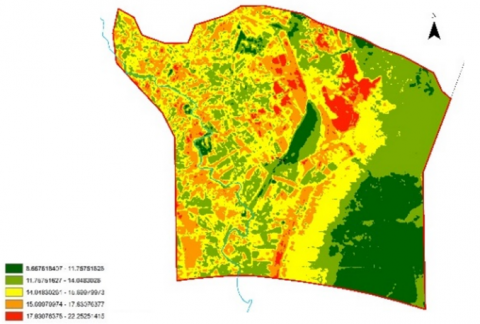
The vegetation index is important in the process of calculating the Earth’s surface temperature, as its value ranges between -1 and 1, as positive values indicate the presence of vegetation, while lower values indicate barren lands [13, 14].
The study showed that the relationship is inverse between surface temperature and the vegetation variation index (NDVI).
Areas of dense vegetation can reduce the temperature difference. The difference between surface temperatures in barren areas (NDVI value is less than 0.1) and areas of dense vegetation (NDVI value is more than (0.2) ranges between 3-4℃ (Figure 7).
Figure 7. NDVI with relationship of temperature
NDVI is calculated from Equation:
$N D V I=N I R-R E D / N I R+R E D$
where, NIR = Band (5), RED= Band (4)
The degree of greenness is equivalent to the concentration of chlorophyll because his range is closely correlated with the plant's chlorophyll absorption area. The absorption of red light by plant chlorophyll and the reflection of infrared radiation cause variations in NDVI readings. Green plants reflect more infrared light than they do red light due to substances like chlorophyll, which is present in green leaves. According to Table 4, places with dense vegetation cover in the soil exhibit different spectral features in the red part of the spectrum than they do in the short infrared range.
The use of remote sensing methods and techniques and geographic information systems has saved a lot of effort, time and cost in determining and drought assessment in the study areas. The visual interpretation method also showed good results in determining the change in vegetation cover.
The apparent color tones revealed by the images captured for the selected study areas were calculated according to the density of vegetation using index values NDVI.
Table 4. Values for vegetation type
|
Category |
Type of vegetation |
|
0.0-0.2 |
Dry lands |
|
0.2-0.4 |
Plants with low densities |
|
0.4-0.6 |
Plants with medium densities |
|
0.6-0.8 |
Plants with high densities |
|
0.8-1.0 |
Plants with very high densities |
Source: Sahebjalal, Ehsan,2013
From Figure 7, it is noted that the effect of vegetation cover in the areas near it is observed, as it is noted that temperatures decrease, as the vegetation cover spreads in the areas between the Qalaat Saleh center district and the Al-Uzair district, as many villages and those working in agricultural areas spread out during the period under study, taking advantage of the proximity of the distance. For the urban center, we noticed an increase in green areas in 2013 compared to 2023.
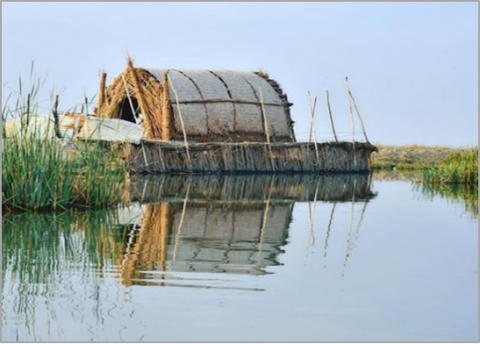
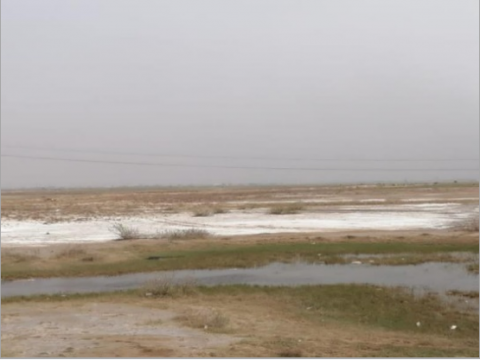
According to data from the Central Statistics organization of the Ministry of Planning, it appears that the area of arable land is about 49,152 dunums, while the area of non-arable land is about 84,715 dunums. The lands of Qalaat Saleh District are fertile lands suitable for agriculture, which has contributed to the development of the agricultural sector in the district significantly, in addition to the district being located on the banks of the Tigris River, which is a primary source of irrigation. The rise in temperature affects the quality of agricultural lands and increases their salinity, as in Figure 8 (A, B).
A. Marshes in Qalaat Salih District
B. Dryness and salinity of the soil in parts of the marshes
Figure 8. Marshes in Qalaat Salih
1. The results and their relationship to the challenges of sustainability and urban development:
From a social standpoint, we note that the city was vulnerable to social disparities. We find that the urban centers have a better quality of life than the residents in the villages near the marshes, who suffer from poor income and social dimensions.
From an economic standpoint, the decline of the marsh waters and the lack of water allocations has greatly affected the marsh areas and the drying up of a large part of them. This will consequently affect the natural resources, that is, the region abounds, the loss of agricultural land and the migration of the population, thus affect the city’s economy as a result of its weak tourism performance (considering the marshes are among the important tourist areas in southern Iraq) are accompanied by high temperatures
From an environmental standpoint, the negative impact of climate conditions and high temperatures on living conditions and the deterioration of environmental resources hinder the achievement of sustainability in the long term. It must be emphasized that the greatest negative impacts of environmental change and natural hazards are felt in informal settlements, which are often poorly built, poorly located, and underserved, and are particularly vulnerable to harsh climatic conditions, natural disasters, and the loss of agricultural land resulting from urbanization and sprawl.
2. There is a general increase in the thermal intensity of the Qalaat Saleh district, and the surface temperature in the built-up area was the highest in 2013, while the barren land was highest in 2023.
3. The western parts of Qal’at Saleh district were more expansive in the built environment due to the presence of urban centers such as Qal’at Saleh and Al-Uzair districts, near which villages expanded over ten years in search of job opportunities and proximity to services due to migration. It was also because most of the marshes’ residents suffer in poverty. Maysan Governorate, due to the scarcity of water and the lack of water allocations towards the marshes, especially in Hor Umm Naaj, which was included in the World Heritage List, in addition to the areas of Bani Hashem, Al-Adl, Al-Musharrah, and Al-Kahla, as most of the rivers dried up. This caused the migration of a large number of residents of the villages adjacent to the marshes and the death of a large number of animals.
4. As Built-up area areas increase, water recedes, and green cover decreases, the temperature in Qalat Saleh rises, as shown by land cover maps and heat maps.
[1] Chen, W.Y., Suzuki, T., Lackner, M. (2017). Handbook of Climate Change Mitigation and Adaptation. Springer International Publishing Cham, Switzerland.
[2] Neteler, M. (2010). Estimating daily land surface temperatures in mountainous environments by reconstructed MODIS LST data. Remote Sensing, 2(1): 333-351. http://doi.org/10.3390/rs1020333.
[3] Cheela, V.S., John, M., Biswas, W., Sarker, P.J.B. (2021). Combating urban heat island effect—A review of reflective pavements and tree shading strategies. Buildings, 11: 93.
[4] Marai, M.U. (2018). Study of thermal changes in the West Bank, Palestine, using remote sensing and geographic information systems between the years 1985-2017. An-Najah National University.
[5] Twisa, S., Buchroithner, M.F. (2019). Land-use and land-cover (LULC) change detection in Wami River Basin, Tanzania. Land, 8: 136. https://doi.org/10.3390/land8090136
[6] Nath, B., Ni-Meister, W., Choudhury, R. (2021). Impact of urbanization on land use and land cover change in Guwahati city, India and its implication on declining groundwater level. Groundwater for Sustainable Development, 12: 100500. https://doi.org/10.1016/j.gsd.2020.100500
[7] Alemu, M. (2015). Effect of tree shade on coffee crop production. Journal of Sustainable Development, 8(9): 66. http://doi.org/10.5539/jsd.v8n9p66
[8] Attri, P., Chaudhry, S., Sharma, S. (2015). Remote sensing & GIS based approaches for LULC change detection—A review. International Journal of Current Engineering and Technology, 5(5): 3126-3137.
[9] Günal, H., Korucu, T., Birkas, M., Özgöz, E., Halbac-Cotoara-Zamfir, R. (2015). Threats to the sustainability of soil functions in Central and Southeast Europe. Sustainability, 7(2): 2161-2188. https://doi.org/10.3390/su7022161
[10] Kerner, S. (2023). The relationship between water temperature and proximity to surface urban heat islands within the lower chesapeake bay watershed for the summer of 2019. Student Research Submissions, 543.
[11] Al-Jawari, S.M. (2020). Regional development prospects for sustainable urbanization. Case study – Qalaat Salih in Iraq. Journal of Settlements and Spatial Planning, 11(2): 57-66. https://doi.org/10.24193/JSSP.2020.2.01
[12] Jedi, Z.A.J., Al-Jawari, S.M. (2023). Prediction of formal transformations in city structure (Kufa as a model) based on the cellular automation model and Markov chains. International Journal of Sustainable Development and Planning, 18(5): 1417-1424. https://doi.org/10.18280/ijsdp.180512
[13] Fatemi, M., Narangifard, M. (2019). Monitoring LULC changes and its impact on the LST and NDVI in District 1 of Shiraz City. Arabian Journal of Geosciences, 12: 1-12. https://doi.org/10.1007/s12517-019-4259-6
[14] Sahebjalal, E., Dashtekian, K. (2013). Analysis of land use-land covers changes using normalized difference vegetation index (NDVI) differencing and classification methods. African Journal of Agricultural Research, 8(37): 4614-4622.