Bali Tamegue Bernard | Donatien Njomo![]() | Venant Sorel Chara-Dackou*
| Venant Sorel Chara-Dackou*![]() | Mahamat Hassane Babikir
| Mahamat Hassane Babikir![]() | Mahamat Ker Nediguina | Daniel Roméo Kamta Legue
| Mahamat Ker Nediguina | Daniel Roméo Kamta Legue![]()
© 2024 The authors. This article is published by IIETA and is licensed under the CC BY 4.0 license (http://creativecommons.org/licenses/by/4.0/).
OPEN ACCESS
The useful wind energy potential in the Sahelian part of Chad is estimated by considering two representative sites namely, Mongo and Abeche from a long series of in situ wind speed measurements over a period of thirty years at 10 m height from the ground. The Weibull distribution statistic was used and its parameters were used to show the influence of turbulence sources on the wind speed at 10 m. Vertical extrapolation of the Weibull parameters and wind speed at different heights from 10 m to 100 m provided more usable wind speeds. The results show that on average the wind is more intense and stable in Mongo than in Abeche and that the wind speed values increase with height with the influence of turbulence sources quantified at about 22.15% in Abeche and 19.93% in Mongo. The comparative study of the five turbines used shows that the De Wind D7 turbines with \$0.057/kWh at 70 m in Abeche and Bonus 1MW/54 turbines with \$0.067/kWh at 50 m in Mongo are better suited to produce energy according to their production capacity. The minimum and maximum electricity costs per kilowatt hour obtained using these two best turbines are very competitive compared to the cost of electricity in Chad (about \$0.16/kWh) and that the installation of a wind farm in these cities could significantly improve the socio-economic situation of households.
wind speed, Weibull distribution statistics, wind power generation, capacity factor, economic analysis, Chad
Renewable energy sources have been the subject of renewed interest in recent years. The main cause of this boom is hidden behind the forecasts of depletion of the planet's conventional energy resources: oil, natural gas, coal and even uranium. On the contrary, renewable energies can be considered as inexhaustible on a human scale, since they use natural energy flows coming from the sun, wind, water or biomass. Another reason for the development of renewable energy sources is the non-uniform distribution of conventional energy resources on the planet. A considerable part of the world's population does not have access to electricity (about 15% of the population or 1.1 billion people according to the World Bank in 2014), which is a barrier in their socio-economic development. These electrical needs can be met through distributed power generation provided by renewable energy systems capable of offering a taxonomy of solutions such as decentralized energy production [1, 2]. Another important reason is the fight against pollutant emissions which are the cause of many harmful phenomena such as additional greenhouse effect, stratospheric ozone hole, global warming. Electricity production from fossil fuels is responsible for 40% of the world's CO2 emissions. It is therefore only natural that recently the role of renewable resources such as wind, solar and other resources is increasing, both in research and development and in the possibilities of implementation through viable projects [3-7].
Chad is a developing African country located in Central Africa south of the Sahara desert, with an economy that is still in the making and is being built day by day. Electricity is mainly produced by thermal power plants based on oil and gas, but its geographical position from the point of view of renewable energies gives it several advantages and it can ensure a major part of its energy production through the exploitation of solar and wind energy potential [8-10]. According to the national report for the formulation of the Chad Regional White Paper, the sunshine duration from North to South is between 2750 and 3250 hours/year, an average of 4 to 6 kilowatts/hour per square meter per day. Following the satellite estimates of Figure 1, for wind energy there are important deposits in the North, Center and South of the country. In the 70's the biomass (especially ligno-cellulosic) is estimated to 312 million hectares, but the surface has decreased nowadays by about 23 million hectares. The energy balance includes 3 to 4% of electricity of thermal origin, 6 to 7% of petroleum products and more than 90% of firewood and charcoal. However, very few Chadian domestic households have access to electricity, with the proportion varying from 15% in the capital N'Djamena to 2% in the provinces [11]. Given that it does not have a modern electricity transmission network, the country can rely on its renewable energy potential for viable and cost-effective access to energy for this population. This potential can be used as an alternative or as a back-up to ensure energy production and thus enable the country to move towards energy independence by improving its energy mix. Wind power is of interest in the Guera region in the center and Ouaddaï in the east of the country where wind speeds are in the order of 3 to 6 m/s [11]. Several Chadian regions, as shown in Figure 1, are likely to be the subject of in-depth studies with the aim of proposing more promising solutions in order to consider the possibility of exploitation of wind energy [11, 12]. It is in this context that many researchers are motivated to propose solutions to palliate the energy problems in Chad [9, 11-14]. Several methods of estimating the wind potential have been developed in the literature in order to propose reliable tools, adequate and more adapted to different situations encountered such as the type of data available, the climatic context, the expected results [15-19]. The knowledge of the wind speed distribution characteristics in wind project sites is essential not only for the evaluation of the wind potential and the selection of favorable sites, but also for the sizing of wind power plants and the appropriate choice of wind turbines [20]. Also, the knowledge of the essential parameters for the good functioning of a wind turbine such as the design, the blades, the average wind speed, the speed multiplier is important for the optimization of its performance [21-23]. Because the improvement of the performance is of great importance from the energetic, economic and environmental point of view [24]. The most useful fitting functions are the Weibull and Rayleigh functions. Particular attention has been focused on the Weibull law because this method has been found to fit much better for most wind regimes in the world [25-29]. Gupta and Biswas [30] in their study analyzed over a period of five years the wind energy potential in India. Weibull and Rayleigh distributions are used and their results were compared. Also, to determine the wind energy potential of Agartala (Tripura, India) over a five-year period from 2009 to 2013, Sengupta et al. [31] used different models such as Rayleigh and Weibull distribution functions. To validate and predict, the autoregressive integrated moving average model (ARIMA) was fitted to the data. Thus, to evaluate the wind energy potential of a site, it is important to express the frequency distribution of the wind speed [32]. In Garoua, Cameroon, to select wind turbines, the authors evaluated the wind energy potential at the study site [33]. The same applies to a site in the coastal region of Benin for the production of electricity [34]. In order to optimize the operation of wind farms, certain measures must be taken into account. Indeed, a wrong choice of certain parameters can be detrimental to a wind power installation [35-37]. For this reason, a preliminary study phase is of great interest in order to identify the conditions and constraints to be taken into account in the realization of a wind power project. It is therefore necessary to carry out a study and analysis of the climatology of the site considered, because a good knowledge of this site allows a better exploitation and production of electrical energy. Very few studies on wind energy in Chad, and more particularly in the cities of Abeche and Mongo with long series of measurements, have taken into account an in-depth analysis of the site’s potential before a techno-economic analysis of its exploitation.
The main objectives of this study are to evaluate the wind potential from a long series of measurements and then make a technical-economic analysis of the electricity production in the cities of Mongo and Abeche in Chad. Specifically, in a first step, the wind speed data in the two selected cities is statistically analyzed in order to draw conclusions and projections in its use in the following work. In a second step, the Weibull distribution statistic is used and its parameters are determined, analyzed and a comparative study of the wind potential in the two cities has been made. Then, the prediction of the electrical energy produced in the two sites, followed by a technical-economic analysis on the judicious choice of wind turbines. The main contributions of this study are:
This study is part of the contribution to the development and enhancement of national energy resources for electricity supply by taking advantage of the significant potential of wind power in the cities of Mongo and Abeche in Chad.
Figure 1. Map of wind potential in Chad [12]
2.1 Data and study area
In order to carry out a study proposing a sustainable solution to the problems of access to energy in the regions of Guera and Ouaddaï, the cities of Mongo and Abeche are geographically chosen respectively to carry out this study on their wind energy potential. These two cities are located in the Sahelian climate of Chad. Figure 1 shows the geographical location of these cities and their mapped wind potential, and Table 1 gives their geographical coordinates.
Evaluation or any other study of wind energy requires knowledge of the wind speed in the given locality at a defined height above the ground. The measured wind speed data useful in this work were obtained from the National Climatological Service of the City of Mongo in Chad. This long series covers a period of about thirty years from 1990-2020 for the city of Mongo and 1989-2021 for the city of Abeche. The observations were made at a height of 10m above the ground using a cup anemometer with $\pm$0.5m/s accuracy. The use of a long time series of at least 30 years allows for making a good inference and to minimize the biases that can bias the statistical analysis. Moreover, this long period allows for taking into account the different fluctuations in time of the wind speed and the phenomena that are associated with the impacts of global warming. Thus, from the daily averages provided, the monthly averages for each year, the generalized monthly averages over all the years considered are calculated for each city. The results are presented in Table 2.
Table 1. Geographical coordinates of the selected sites [10]
|
Geographical Ordinates |
Longitude (°N) |
Latitude (°E) |
Altitude (m) |
|
Mongo |
18.18 |
12.68 |
424 |
|
Abeche |
20.83 |
13.83 |
545 |
Table 2. Monthly average of wind speed measured at studied farms (in m/s)
|
Month |
Jan |
Fev |
Mar |
Apr |
May |
Jun |
July |
Aug |
Sep |
Oct |
Nov |
Dec |
Mean |
|
Mongo |
5.13 |
5.10 |
5.10 |
4.50 |
3.93 |
4.20 |
3.40 |
2.98 |
2.80 |
3.30 |
4.50 |
4.10 |
4.09 |
|
Abeche |
3.46 |
3.44 |
3.88 |
3.72 |
3.42 |
3.02 |
3.26 |
2.72 |
2.70 |
3.26 |
3.18 |
3.30 |
3.28 |
2.2 Methodology
2.2.1 Statistics of the Weibull distribution
In the literature as mentioned, the two-parameter Weibull statistical distribution is the most appropriate and most used of the statistical methods to evaluate the wind energy potential because the knowledge of the wind speed data alone does not clearly allow it. The parameters of the statistical Weibull distribution provide information on the stability and intensity of the wind speed at the selected study site. However, these parameters allow defining the probability density and cumulative Weibull functions given by Eq. (1) and Eq. (2) respectively, characterizing the wind speed variations [3, 14].
$f\left( v \right)=\frac{k}{c}{{\left( \frac{v}{c} \right)}^{k-1}}\exp \left[ -{{\left( \frac{v}{c} \right)}^{k}} \right]$ (1)
c, v and k are respectively the Weibull scale parameter, the mean of the computed wind speed and the Weibull shape parameter. These parameters are strictly positive.
$F\left( v \right)=1-\exp \left[ -{{\left( \frac{v}{c} \right)}^{k}} \right]$ (2)
There are several methods for determining these two Weibull parameters [14]. Among these methods are the maximum likelihood method, the standard deviation method, the power density method, the energy factor method. For this study, the energy factor method is chosen to be useful and is given by Eq. (3) where n is the number of observations and j is the index of the increment.
${{E}_{f}}=\frac{\frac{1}{n}\sum\limits_{j=1}^{n}{v_{j}^{3}}}{{{\left( \frac{1}{n}\sum\limits_{j=1}^{n}{{{v}_{j}}} \right)}^{3}}}$ (3)
From the relation Eq. (3) the determination of the parameters k and c of this distribution can be possible by using the relations Eq. (4) and Eq. (5) respectively [29].
$k=1+\frac{3.69}{{{\left( {{E}_{f}} \right)}^{2}}}$ (4)
$c=\frac{{\bar{v}}}{\Gamma \left( 1+\frac{1}{k} \right)}$ (5)
$\Gamma$ is the gamma function depending on the shape parameter k.
2.2.2 Estimation of the most probable wind speed and maximum wind speed
The most probable wind speed at the site can be estimated from the relation Eq. (6) and the speed at which the wind can carry a maximum of energy is calculated through the relation Eq. (7) [14]. The determination of these speeds allows us to project the possibility of electrical production of the wind turbine at this chosen height.
${{V}_{mp}}=c{{\left( 1-\frac{1}{k} \right)}^{1/k}}$ (6)
${{V}_{\max ,E}}=c{{\left( 1+\frac{2}{k} \right)}^{1/k}}$ (7)
2.2.3 Turbulence index
It can be described as the share of dispersion of the wind speed distribution or it is the measure of the degree of dispersion of the wind speed distribution. This index takes into account the effects of the height of the nacelle, the type of environment on the wind speed and many other sources of turbulence at the chosen site such as the quality of the wind data measurements, the quality of the measuring equipment, variability of sunshine in the region. The relation Eq. (8a) allows to estimate it in which represents the standard deviation of the distribution and the average wind speed calculated from the equation Eq. (8b) [38].
$I=\frac{\sigma }{{\bar{v}}}$ (8a)
$\bar{v}=\frac{1}{n}\sum\limits_{j=1}^{n}{{{v}_{i}}}$ and ${{\sigma }^{2}}=\frac{1}{n}\sum\limits_{j=1}^{n}{\left( {{v}_{i}}-\bar{v} \right)}$ (8b)
2.2.4 Extrapolation of wind speed at different hub heights
The standard height for wind speed measurements is 10m from the ground. However, for a wind project, extrapolations can be made for several reasons: when the wind speed is too low or too variable to provide a power output that can be exploited; when the site design defines a level of electrical production that cannot be achieved from measurements taken at the defined height. These in order to make a significant evaluation of the wind potential for energy interests. Thus, the extrapolation of wind speed for modeling its vertical profile at different heights can be done from the relationship Eq. (9) where the initial or standard height is, the exponent m is a function calculated from Eq. (10) depending on the scale parameter of the speed taken at the standard height [14].
${{v}_{z}}={{v}_{{{z}_{0}}}}{{\left( \frac{z}{{{z}_{0}}} \right)}^{m}}$ (9)
$m=\frac{0.37-0.088\ln \left( {{v}_{0}} \right)}{1-0.088\ln \left( \frac{{{z}_{0}}}{10} \right)}$ (10)
The extrapolation of the parameters of the Weibull distribution statistic is done from Eq. (11) for the shape parameter and Eq. (12) for the scale parameter. z is the new height from which the extrapolation is performed and m1 a function depending on $c_{z_0}$.
${{k}_{z}}={{k}_{{{z}_{0}}}}\frac{1-0.088\ln \left( \frac{{{z}_{0}}}{10} \right)}{1-0.088\ln \left( \frac{z}{10} \right)}$ (11)
${{c}_{z}}={{c}_{{{z}_{0}}}}{{\left( \frac{z}{{{z}_{0}}} \right)}^{{{m}_{1}}}}$ (12)
${{m}_{1}}=\frac{0.37-0.088\ln \left( {{c}_{{{z}_{0}}}} \right)}{1-0.088\ln \left( \frac{{{z}_{0}}}{10} \right)}$ (13)
2.2.5 The power and energy densities of the wind speed
From the determination of the two Weibull parameters k and c, the power and energy densities of the wind speed are respectively calculated using the relations Eq. (14) and Eq. (16) [3, 33]. In these equations is calculated from the relation Eq. (15) in which h represents the altitude of the area, the density of the air taken at sea level and T the time expressed in hours.
$WPD=\frac{1}{2}\rho {{c}^{3}}\Gamma \left( 1+\frac{3}{k} \right)$ (14)
$\rho ={{\rho }_{0}}-1.194*{{10}^{-4}}h$ (15)
$WED=\frac{1}{2}\rho {{c}^{3}}\Gamma \left( 1+\frac{3}{k} \right)T$ (16)
2.2.6 Turbine power output and capacity factor
The capacity factor provides an important indication for calculating the profitability of an electrical installation. For an electrical production unit, it is defined as the ratio between the energy it produces over a given period and the energy it would have produced during that period if it had been operating constantly at nominal capacity. This factor varies from one production unit to another depending on the energy source, its location and the level of use of the production unit. It is determined by the relation Eq. (17) in which Pr is the nominal power of the turbine and Pout is the average output power delivered which is calculated from the relation Eq. (18) [39].
${{C}_{f}}=\frac{{{P}_{out}}}{{{P}_{r}}}$ (17)
${{P}_{out}}={{P}_{r}}\left[ \frac{{{e}^{-{{\left( \frac{{{V}_{c}}}{c} \right)}^{k}}}}-{{e}^{-{{\left( \frac{{{V}_{r}}}{c} \right)}^{k}}}}}{{{\left( \frac{{{V}_{r}}}{c} \right)}^{k}}-{{\left( \frac{{{V}_{c}}}{c} \right)}^{k}}}-{{e}^{-{{\left( \frac{{{V}_{f}}}{c} \right)}^{k}}}} \right]$ (18)
This indicator of the energy produced Cf by a wind turbine is evaluated for a reference period of one year. Experimentally, the average load factor is about 25%.
2.2.7 Techno-economic analysis of the wind power project
In this section, we will perform an economic feasibility assessment based on the determination of the present value of the investment costs and the unit cost of electricity produced by different turbines at the two sites. The ability of a wind turbine to produce electricity at a low unit cost is one of its best technical-economic aspects. The determination of the unit cost of electricity requires prior assumptions on the determination of the main energy saving parameters which are [3]:
The assumptions made about the above economic parameters take into account the investment climate and economic context of Chad. Then, the present value of the costs is determined from the relation Eq. (19) [40].
$PVC={{C}_{i}}+\frac{1+i}{r-i}\left[ 1-{{\left( \frac{1+i}{1+r} \right)}^{t}} \right]{{C}_{omr}}-S{{\left( \frac{1+i}{1+r} \right)}^{t}}$ (19)
The cost per unit (CPU) can be determined after calculating the energy produced and the PVC using the relation Eq. (20) [3].
$C P U=\frac{P V C}{E_T}$ (20)
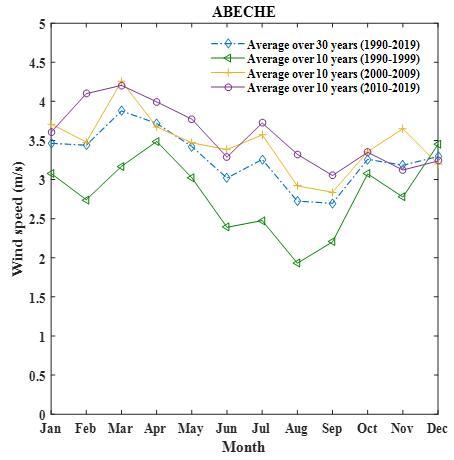
The wind speed data taken for thirty successive years useful in this work are statistically analyzed and the descriptions are given in Table 3 for the city of Abeche and Table 4 for the city of Mongo. A subdivision into three parts of the data was made for a 10-year step with the calculated averages. The comparison between these three time series and the one taken over the entire 30-year period was illustrated graphically in Figure 2, which shows monthly temporal variations. In the city of Abeche, the graphical analysis shows that on average the wind speed increases monthly with the year. This is almost the opposite on average in Mongo. These differentiated effects of the evolution of the year on the wind speed observed in these cities can be attributed on the one hand to the effects of climate change which are the consequences of global heating and on the other hand by the effects of the type of environment such as the structures of the reliefs, cities. These graphical results support those obtained in Table 3 and Table 4.
In Table 3, parameters such as arithmetic mean, standard deviation, minimum, maximum, mode and quartiles are calculated for each month. It can be seen that the average wind speed is low between the months of June and November and high between January and April. However, the lowest wind speed value recorded is 1.17m/s in September and the highest wind speed value is 6.62m/s recorded in February. These results are close to the case of Abeche [12]. Moreover, 75% of the wind speed values in February are less than or equal to 3.60m/s. This shows in this month a significant variation around its average wind speed quantified at 0.994m/s. While it is less variable in October with a difference of 0.553m/s around an average of 3.26m/s. Moreover 50% of the wind speed values are below or equal to 3.38m/s and 75% below 3.78m/s. This is very close to the average. The annual trend over all the years considered shows that the wind speed is around 3.28m/s, with an average deviation of 0.72m/s. The ¾ of the wind speed values are equal or lower than 3.79m/s, half of its values are below or equal to 3.34m/s, then only 25% of its values are below or equal to 2.85m/s.
Figure 2. Monthly profile of the average wind speed in the study cities according to the periods considered
Table 3. Descriptive analysis of wind speed data in the city of Abeche
|
Month |
Mean Speed Wind |
Standard Deviation |
Min |
Max |
Mode |
Quartile 1 |
Quartile 2 |
Quartile 3 |
|
Jan |
3.46 |
0.590 |
2.36 |
4.98 |
3.98 |
3.21 |
3.60 |
3.86 |
|
Feb |
3.44 |
0.994 |
2.25 |
6.62 |
2.56 |
2.89 |
3.28 |
3.60 |
|
Mar |
3.88 |
0.751 |
2.47 |
4.99 |
4.68 |
3.37 |
3.75 |
4.68 |
|
Avr |
3.72 |
0.639 |
2.14 |
4.99 |
3.57 |
3.38 |
3.57 |
4.26 |
|
May |
3.42 |
0.671 |
2.17 |
4.51 |
3.3 |
3.13 |
3.32 |
4.11 |
|
Jun |
3.02 |
0.788 |
1.23 |
3.91 |
3.36 |
2.52 |
3.27 |
3.63 |
|
Jul |
3.26 |
0.696 |
1.76 |
4.09 |
3.79 |
2.79 |
3.57 |
3.79 |
|
Aug |
2.72 |
0.769 |
1.08 |
3.7 |
3.3 |
2.24 |
2.99 |
3.38 |
|
Sep |
2.70 |
0.751 |
1.17 |
3.97 |
2.39 |
2.77 |
3.10 |
|
|
Oct |
3.26 |
0.553 |
2.22 |
3.99 |
2.86 |
3.38 |
3.78 |
|
|
Nov |
3.18 |
0.704 |
2.12 |
4.74 |
2.53 |
3.33 |
3.66 |
|
|
Dec |
3.30 |
0.698 |
2.14 |
4.83 |
2.95 |
2.88 |
3.27 |
3.71 |
|
Mean |
3.28 |
0.72 |
1.93 |
4.61 |
2.85 |
3.34 |
3.79 |
Table 4. Descriptive analysis of wind speed data in the city of Mongo
|
Month |
Wind Speed |
Standard Deviation |
Min |
Max |
Mode |
Quartile 1 |
Quartile 2 |
Quartile 3 |
|
Jan |
5.13 |
1.02 |
3.25 |
7.75 |
5.25 |
4.60 |
5.25 |
5.64 |
|
Feb |
5.10 |
1.46 |
3.00 |
8.95 |
5.14 |
4.00 |
5.10 |
6.02 |
|
Mar |
5.10 |
1.40 |
3.12 |
8.58 |
3.32 |
3.65 |
5.25 |
5.97 |
|
Apr |
4.50 |
0.81 |
3.19 |
6.11 |
4.25 |
3.96 |
4.46 |
5.28 |
|
May |
3.93 |
0.68 |
2.32 |
5.71 |
3.72 |
3.46 |
4.11 |
4.26 |
|
Jun |
4.20 |
0.77 |
3.07 |
6.76 |
4.03 |
3.67 |
4.08 |
4.48 |
|
Jul |
3.40 |
0.54 |
2.09 |
5.23 |
3.21 |
3.21 |
3.25 |
3.38 |
|
Aug |
2.98 |
0.49 |
2.14 |
3.78 |
3.21 |
2.49 |
3.14 |
3.30 |
|
Sep |
2.80 |
0.51 |
2.15 |
3.71 |
3.11 |
2.26 |
3.11 |
3.19 |
|
Oct |
3.30 |
0.53 |
2.11 |
4.30 |
3.19 |
3.19 |
3.26 |
3.49 |
|
Nov |
4.50 |
1.14 |
2.44 |
6.76 |
4.95 |
3.54 |
4.48 |
5.16 |
|
Dec |
4.10 |
0.73 |
3.11 |
5.63 |
4.79 |
3.67 |
3.77 |
4.62 |
|
Mean |
4.09 |
0.84 |
2.67 |
6.11 |
4.01 |
3.47 |
4.10 |
4.57 |
The same calculations in Table 3 are applied in Table 4 in the case of the city of Mongo. In the latter, it can be noted that the lowest recorded value of wind speed is 2.11m/s in October and the maximum is recorded in February of 8.95m/s. On average the wind is weaker in September and stronger in January. This can be explained by the high variations in wind speed over time which are justified by the standard deviation values obtained. It can be seen that in February the variations are more important than in January by 0.03m/s and that in October the variations are more important than in September by 0.02m/s. In addition, 75% of the wind speed values are less than or equal to 6.02m/s in February compared to January where 75% of the wind speed values are less than or equal to 5.64m/s. Also, in October 50% of the wind speed values are less than or equal to 3.26m/s while in September 50% of the wind speed values are less than or equal to 3.11m/s.
On average for the two cities, the trend in wind speed is more significant in the dry season (November to May) and less significant in the rainy season (June to October), in according with the results [12]. These indicators make it possible to observe, quantify and analyze the variations and variabilities in wind speed over time as well as the unobserved specificities of the Sahelian climate and its seasons in each of these cities. In order to take all of these factors into account in this study, the monthly averages of wind speed calculated over the thirty years will be considered in the following work.
3.1 Comparative analysis of the wind potential of the study cities
From the averaged speeds calculated at the height of 10m above the ground, Table 5 and Table 6 give the results obtained at a time resolution of one month of the cities of Abeche and Mongo respectively. In the case of the city of Abeche (Table 5), it can be seen that on average depending on the values of the shape parameter with 3.24<k≤4.15 the wind speed is more stable and depending on the values of c its intensity is high. The months of January, April and October show the most stable with wind speed distribution probabilities of 40.45%, 37.91% and 42.87% respectively. These results obtained in relation to the dispersions around the average wind speed in Table 3 confirm this. This can also be verified by the low dispersion rates of the wind speed distribution of about 17% during these months. The months of February, August and September are less interesting. On an annual average, for an average intensity of 3.66m/s the power density of the wind speed is 24.71W/m2 producing an average energy density of 17kWh/m2 for an observation probability of 39.986%. Also, the cumulative probability that the wind speed values throughout the year are less than or equal to 3.82m/s on average is 48%.
In the case of the city of Mongo (Table 6), it can be seen that during the most stable months the intensity of the wind speed is not significant. This is the opposite during the less stable months. The months in which the wind speed is more stable start from April to October with low intensities between 3.15m/s and 4.93m/s. This stability is marked by less turbulence sources whose impact is estimated at about 17%. While during the less stable months the wind speed intensity is high at about 5m/s with a low observation probability around 25% and the impact of turbulence sources is estimated at about 22%. These may be due to the large temporal dispersion of wind speed data around the quantified average observed monthly (see Table 4). On an annual average, for an average wind speed of 4.09m/s the intensity is 4.50m/s with an observation probability of 34.71%. Thus, the cumulative probability that the wind speed values throughout the year are less than or equal to the average is 49.30% with an estimated energy density of 35.97kWh/m2.
Wind energy density increases with wind speed intensity in both cities. Turbulence sources have a greater influence on the wind speed in Abeche than in Mongo. There is a slight difference of 0.81m/s between the annual average wind speeds in the two cities. This has a significant impact on the power density. On an annual average the wind power density is higher in Mongo because the wind speed intensity is significantly higher than in Abeche. These observed differences can be caused on the one hand by the environment i.e., the local topography and wind direction, by the differentiated effects in the two cities of the sunshine intensity and on the other hand by other factors such as the sources of unobserved heterogeneities of the climates of the two cities. The results of Ref. [12] show that Abeche is windier (with high wind intensities and stability on average) than Mongo, which is contrary to the results of this present study. These discrepancies are attributed to the temporal resolution of the average wind speed considered in the two studies (short time series of five years for Ref. [12] and long time series of thirty-years for the current study), because according to Ref. [41, 42], observing wind speed over a period of less than thirty years can inherently cause variations in the long-term average in resource assessment. Thus, the results found in this current study are considered acceptable for analyzing the wind potential and carrying out an analysis techno-economic of electricity production in the cities Abeche and Mongo.
Table 5. Monthly evaluation of the parameters of the Weibull distribution, densities, powers and energies at Abeche
|
Month |
k (-) |
c (m/s) |
WPD (W/m2) |
WED (kWh/m2) |
Turbulence Index (%) |
F(v) (%) |
F(v) (%) |
|
Jan |
4.14 |
3.85 |
27.69 |
19.93 |
17.04 |
40.455 |
47.484 |
|
Feb |
3.25 |
3.83 |
28.83 |
20.76 |
28.89 |
32.898 |
50.721 |
|
Mar |
4.00 |
4.29 |
38.34 |
27.60 |
19.36 |
35.398 |
48.830 |
|
Avr |
4.15 |
4.12 |
33.86 |
24.38 |
17.18 |
37.917 |
48.012 |
|
May |
3.99 |
3.81 |
26.92 |
19.38 |
19.60 |
39.635 |
47.946 |
|
Jun |
3.64 |
3.38 |
19.22 |
13.84 |
26.08 |
41.157 |
48.479 |
|
Jul |
3.91 |
3.63 |
23.48 |
16.91 |
21.37 |
40.813 |
47.892 |
|
Aug |
3.49 |
3.06 |
14.45 |
10.40 |
28.23 |
43.763 |
48.572 |
|
Sep |
3.48 |
3.03 |
14.05 |
10.12 |
27.82 |
44.123 |
48.552 |
|
Oct |
4.15 |
3.64 |
23.27 |
16.76 |
16.97 |
42.873 |
47.016 |
|
Nov |
3.82 |
3.56 |
22.09 |
15.91 |
22.10 |
40.871 |
48.085 |
|
Dec |
3.86 |
3.67 |
24.33 |
17.52 |
21.19 |
39.932 |
48.154 |
|
Mean |
3.82 |
3.66 |
24.71 |
17.79 |
22.15 |
39.986 |
48.312 |
Table 6. Monthly evaluation of the parameters of the Weibull distribution, densities, powers and energies at Mongo
|
Month |
k (-) |
c (m/s) |
WPD (W/m2) |
WED (kWh/m2) |
Turbulence Index |
F(v) (%) |
F(v) (%) |
|
Jan |
3.96 |
5.58 |
86.03 |
61.94 |
19.97 |
26.99 |
51.21 |
|
Feb |
3.35 |
5.55 |
88.16 |
63.47 |
28.71 |
23.28 |
52.97 |
|
Mar |
3.46 |
5.54 |
86.99 |
62.63 |
27.46 |
24.04 |
52.62 |
|
Apr |
4.08 |
4.93 |
59.10 |
42.55 |
17.91 |
31.37 |
49.76 |
|
May |
4.12 |
4.34 |
40.14 |
28.90 |
17.37 |
35.81 |
48.55 |
|
Jun |
4.02 |
4.62 |
48.76 |
35.11 |
18.33 |
32.94 |
49.42 |
|
Jul |
4.18 |
3.78 |
26.45 |
19.04 |
15.84 |
41.51 |
47.21 |
|
Aug |
4.19 |
3.34 |
18.19 |
13.10 |
16.47 |
46.92 |
46.31 |
|
Sep |
4.08 |
3.15 |
15.34 |
11.04 |
18.07 |
48.65 |
46.36 |
|
Oct |
4.21 |
3.68 |
24.38 |
17.55 |
15.94 |
42.85 |
46.90 |
|
Nov |
3.61 |
4.93 |
60.53 |
43.58 |
25.31 |
28.09 |
51.27 |
|
Dec |
4.07 |
4.52 |
45.50 |
32.76 |
17.84 |
34.10 |
49.04 |
|
Mean |
3.94 |
4.50 |
49.96 |
35.97 |
19.93 |
34.71 |
49.30 |
Figure 3. Comparison of the monthly profile of the variations of the mean wind speed, the most probable wind speed and the wind speed carrying the maximum energy
Based on the results of Table 5 and Table 6, which present specific correlations between the temporal characteristics of the wind speed and its average and between the distribution of the wind speed and its average speed, we can observe in Figure 3 a good significant agreement in both cities between the most probable speed Vmp and the average wind speed with very small differences. The calculated correlation coefficients are R=0.9976 and R=0.9929 respectively in Mongo and Abeche. The wind speed that can carry the maximum energy is low in Abeche with an average of 4.08m/s and 4.99m/s in Mongo with significant variations observed between rainy and non-rainy periods of the climate. These results can be supported by those of the energy density estimates made in Table 5 and Table 6 and thus supporting their conclusion. In these contexts, it is important to look for the adequate height for good electrical production by using a vertical extrapolation of the wind speed.
3.2 Analysis of the extrapolation of the Weibull parameters, of the average wind speed at different heights above the standard
In order to look for high wind speeds following the analysis of the above results, the vertical extrapolation was performed and the hub heights varied from 10m to 50m in 10m steps and then from 50m to 100m in 50m steps, resulting in six (6) height levels of wind speed evaluation. Figure 4 shows a comparison of the monthly variations of the average wind speed at different selected height levels. In both cities, the wind speed increases with height, this has been observed and found in Chad in the Saharan climate [14]. We notice a significant mean difference between the 10m and 20m profiles and a less significant mean difference between the 50m and 100m profiles with respect to the different steps. These observations can be well analyzed through the parameters of scale and shape also extrapolated to the same heights. The results are given in Table 7 and supported by Figure 5.
Figure 5 describes how height has positive effects on wind speed, improving its stability and intensity at the selected sites. This trend has been found by Soulouknga et al. [14]. This implicitly minimizes the influence of some turbulence sources. In both cities, there is a significant change in wind stability at a 10m step but less significant at a 50m step. This means that at a certain height threshold, the stability increases weakly with the stability regardless of the wind intensity until it becomes less and less significant. This observation is almost the same for the case of the wind intensity in both cities. These findings can be well observed on a monthly basis from Table 7. For the same heights, the extrapolation is more favorable in Mongo than in Abeche. Therefore, the wind is less stable in Abeche and of low intensity compared to Mongo where the wind is more stable and of high intensity.
Figure 4. Monthly profile of the average wind speed variation at different hub heights at Abeche and Mongo
3.3 Performance analysis and selection of turbines useful in both cities
In order to exploit the wind potential and produce electrical energy, five turbines were selected and used in this work. The rated characteristics of these turbines are given in Table 7. The rated powers vary from 300kW to 2000kW and hub heights from 30m to 70m.
Table 8 and Table 9 show the performance of the turbines at Abeche and Mongo respectively for hub heights of 10m, 30m, 50m and 70m. In Abeche, up to 50m height only the De Wind D7 turbine provides a capacity factor close to the average with a value of 23.69% at 30m and 36.94% at 50m. Its best performance is at 70m with a capacity factor of 49.79% and an annual energy output of 537MWh/year. Nevertheless, the De Wind D8 turbine can be an alternative at heights of 50 m and 70m with a better capacity factor of 28.96% and 417MWh/year of effective energy production. In Mongo, the city with the most wind, the turbines on average provide good production capacity from 30m with an annual energy produced ranging from 73MWh/year to 697MWh/year. Taking into account the rated height of the hub, the Bonus 1MW/54 turbine gives good capacity factors ranging from 25.70% at 30m to 36.25% at 50m. Nevertheless, the De Wind D7 turbine can be an alternative at 30m and the De Wind D8 turbine at 50m.
Table 7. Characteristics of five different commercial turbines [14, 43]
|
Characteristics |
Bonus 300kW/33 |
Bonus 1MW/54 |
Vestas 2MW/80 |
De Wind D7 |
De Wind D8 |
|
Hub height (m) |
30 |
50 |
67 |
70 |
80 |
|
Rated power Pr (kW) |
300 |
1000 |
2000 |
1500 |
2000 |
|
Cut-in wind speed Vc (m/s) |
3 |
3 |
4 |
3 |
3 |
|
Rated wind speed Vr (m/s) |
14 |
15 |
16 |
12 |
13.5 |
|
Cut-off wind speed Vf (m/s) |
25 |
25 |
25 |
25 |
25 |
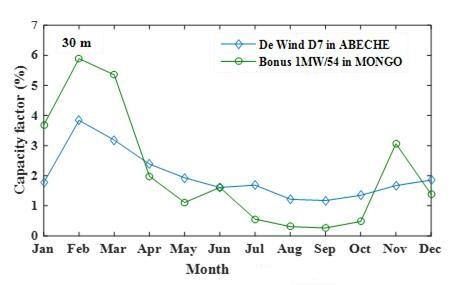
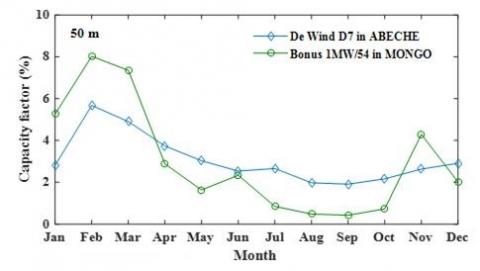
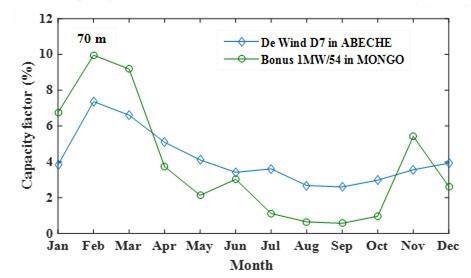
Figure 5. Comparison of the monthly profile of the capacity factor variation of the best turbines in the two cities at different hub heights
The performance of the turbines is better at Mongo than at Abeche because the latter is less windy. This has an impact on the operation of the turbines at their nominal speed. These preferences are from an energy point of view. However, from an economic point of view, the choices can change depending on the purchase price of the turbines, maintenance costs and the size of the site.
Figure 5 shows an almost similar pattern of profiles at different hub heights of capacity factors for each turbine useful in each city. It shows the most favorable and unfavorable times for the generating capacity of the De Wind D7 and Bonus 1 MW/54 turbines in Abeche and Mongo respectively. These periods correspond on the one hand to the periods of the rainy season during which the meteorological parameters significantly influence the frequency of the wind speed and its intensity as well as other aspects that are sources of turbulence and on the other hand by the weak influence of its meteorological parameters on the wind characteristics (dry season). This capacity factor is strongly dependent on the intermittent nature of the wind. Taking into account the experimental range of capacity factor values given in the literature, Cf results in Table 8 and Table 9 below 59% are considered more significant.
3.4 Techno-economic analysis of the choice of wind turbines on the different sites
After estimating the wind potential in the cities considered in this study and simulating the monthly and then annual electricity production capacity at different hub heights, it is important to make an economic analysis of the wind farm installation project. This analysis is based on the evaluation of the cost of electricity produced for different wind turbines used at 30m, 50m and 70m. Based on the range of specific wind turbine costs given in Table 8, and Table 9 presents the estimation results.
Table 8. Range of specific wind turbine costs based on rated power [41]
|
Wind Turbine Size (kW) |
Specific Cost ($/kW) |
Mean Specific Cost ($/kW) |
|
<20 |
2200-3000 |
2600 |
|
20-200 |
1250-2300 |
1775 |
|
>200 |
700-1600 |
1150 |
Table 9. Results of the economic analysis of the wind study in the cities of Abeche and Mongo
|
|
|
ABECHE |
|
|
|
|
At 30m |
|||||
|
Bonus 300kW/33 |
Bonus 1MW/54 |
Vestas 2MW/80 |
De Wind D7 |
De Wind D8 |
|
|
Et (MWh/Year) |
325 |
811 |
916 |
3112 |
2526 |
|
CF (%) |
12.4 |
9.3 |
5.2 |
23.7 |
14.4 |
|
CPU ($/kWh) |
0.196 |
0.307 |
0.543 |
0.120 |
0.197 |
|
At 50m |
|||||
|
Et (MWh/Year) |
9799 |
24082 |
30558 |
97076 |
76736 |
|
Cf (%) |
18.6 |
13.7 |
8.7 |
36.9 |
21.9 |
|
CPU ($/kWh) |
0.130 |
0.207 |
0.326 |
0.077 |
0.130 |
|
At 70m |
|||||
|
Et (MWh/Year) |
12883 |
31313 |
41661 |
130861 |
101488 |
|
Cf (%) |
24.5 |
17.9 |
11.9 |
49.8 |
29.0 |
|
CPU ($/kWh) |
0.099 |
0.159 |
0.239 |
0.057 |
0.098 |
|
MONGO |
|||||
|
At 30m |
|||||
|
Bonus 300 kW/33 |
Bonus 1MW/54 |
Vestas 2MW/80 |
De Wind D7 |
De Wind D8 |
|
|
Et (MWh/Year) |
897 |
2251 |
3125 |
8491 |
6953 |
|
Cf (%) |
34.2 |
25.7 |
17.8 |
64.6 |
39.7 |
|
CPU ($/kWh) |
0.071 |
0.094 |
0.136 |
0.038 |
0.061 |
|
At 50m |
|||||
|
Et (MWh/Year) |
1286 |
3177 |
4541 |
12579 |
10049 |
|
Cf (%) |
49 |
36 |
26 |
96 |
57 |
|
CPU ($/kWh) |
0.050 |
0.067 |
0.094 |
0.025 |
0.042 |
|
At 70m |
|||||
|
Et (MWh/Year) |
1655 |
4043 |
5830 |
16512 |
13000 |
|
Cf (%) |
63.0 |
46.2 |
33.3 |
125.7 |
74.2 |
|
CPU ($/kWh) |
0.039 |
0.053 |
0.073 |
0.019 |
0.033 |
In Abeche, the cost per unit varies between \$0.0557/kWh at 70 m and \$0.543/kWh at 30m. However, the turbine with the best cost per unit is the De Win D7 wind turbine with a minimum of \$0.0557/kWh when used at 70m producing an electrical energy of 130861MWh/year with a capacity factor of 49.8% and a maximum of \$0.120/kWh at 30m with an electrical production capacity of 23.7%.
At Mongo, the cost per unit ranges from \$0.0442/kWh at 50m to \$0.136/kWh at 30m. The turbine with the best cost per unit is the Bonus 1MW/54 turbine with a minimum cost of \$0.053/kWh when evaluated at 70m and $0.094/kWh at 30m with a capacity factor of 25.7% for an annual electricity production of 2251MWh/year. However, taking into account the rated characteristics, this turbine at 50m presents the cost per unit of 0.067\$/kWh of a 36% production capacity.
The minimum and maximum energy costs per unit in these two locations evaluated with the best turbine selection are very competitive compared to the electricity prices paid by consumers in the household sector in Chad, which is approximately $0.16/kWh. The installation of a wind farm in these cities will significantly improve the socio-economic situation and welfare of households allowing them to develop income-generating activities at an accessible cost of electricity for all, thus meeting the 7th sustainable development goal. However, massive investment in research and development could positively improve the efficiency of the wind farms and its components while generating local added value by contributing to and diversifying the Chadian energy mix. This will constitute a vector of economic growth and structural development.
In this study carried out in Chad in the cities of Abeche and Mongo the wind potential and wind energy were estimated and an economic analysis was carried out based on a long series of measured wind speed data. From this entire study the following conclusions can be drawn:
Thus, in the Sahelian climate zone, particularly in the cities of Abeche and Mongo, for electricity production, the De Wind D7 turbine and the Bonus 1MW/54 turbine are recommended for the construction of wind farms respectively. Given the intermittent nature of wind, a hybrid system would be a more efficient and sustainable solution for continuous power generation.
The authors sincerely thank the National Climatological Service of the City Mongo for the availability of wind speed data in the cities of Mongo and Abeche as well as the guidance on the technical aspects of in situ measurements.
|
CPU |
cost per unit, $/kWh |
|
PVC |
present value costs, $ |
|
WPD |
wind power density, W/m2 |
|
WED |
wind energy density, kWh/m2 |
|
f(v) |
function of density of probability of Weibull |
|
F(v) |
cumulative distribution function |
|
k |
shape factor (dimensionless) |
|
c |
scale factor (m/s) and C>0 |
|
$c_0$ |
scale parameter at standard height, m/s |
|
Cf |
capacity factor (%) |
|
Comr |
operating, repair and maintenance cost, $ |
|
Ci |
capital cost, $ |
|
Ef |
energy pattern factor, Wh |
|
n |
number of observation |
|
m |
function |
|
i |
rate of inflation |
|
I |
turbulence index |
|
J |
increment index |
|
S |
supplementary cost, $ |
|
v |
mean wind speed, m/s |
|
$V_{mp}$ |
most probable wind speed, m/s |
|
$V_{max,E}$ |
Speed of the maximum energy, m/s |
|
$v_z$ |
extrapolated wind speed, m/s |
|
$v_0$ |
wind speed at standard height, m/s |
|
Vr |
rated wind speed (m/s) |
|
Vc |
cut-in wind speed (m/s) |
|
Vf |
cut-off wind speed (m/s) |
|
$z_0$ |
Standard height, m |
|
kz |
shape parameter at extrapolated height |
|
k0 |
shape parameter at standard height |
|
cz |
scale parameter at extrapolated height, m/s |
|
t |
lifetime, year |
|
T |
time, hour |
|
h |
altitude, m |
|
Pout |
mean output power, kW |
|
Pr |
rated power, kW |
|
r |
discount rate (%) |
|
Greek symbols |
|
|
$\sigma$ |
Standard deviation |
|
$\Gamma$ |
gamma function |
|
$\rho$ |
air density, kg/m3 |
|
$\rho_0$ |
air density at sea level, kg/m3 |
[1] Babikir, M.H., Njomo, D., Barka, M., Chara-Dackou, V.S., Kondji, Y.S., Khayal, M.Y. (2021). Thermal modeling of a parabolic trough collector in a quasi-steady state regime. Journal of Renewable and Sustainable Energy, 13(1): 013703. https://doi.org/10.1063/1.5145272
[2] Babikir, M.H., Chara-Dackou, V.S., Njomo, D., Barka, M., Khayal, M.Y., Legue, D.R.K., Gram-Shou, J.P. (2020). Simplified modeling and simulation of electricity production from a dish/Stirling system. International Journal of Photoenergy, 2020: 1-14. https://doi.org/10.1155/2020/7398496
[3] Touafio, J.F.N., Sanda, O., Malenguinza, S., M’Boliguipa, J., Mouangue, R.M. (2020). Analysis of a wind turbine project in the city of Bouar (Central African Republic). Scientific African, 8: e00354. https://doi.org/10.1016/j.sciaf.2020.e00354
[4] Chara-Dackou, V.S., Njomo, D., Hassane Babikir, M., Mbouombouo, I.N., Pofoura Gboulie, S.A., Tchinda, R. (2022). Processing sunshine duration measurements for the assessment of solar radiation in climatic regions of the central African republic. Journal of Solar Energy Engineering, 144(3): 031002. https://doi.org/10.1115/1.4053483
[5] Dhakal, R., Yadav, B.K., Koirala, N., Kumal, B.B., Moussa, H. (2020). Feasibility study of distributed wind energy generation in Jumla Nepal. International Journal of Renewable Energy Research. https://doi.org/10.31224/osf.io/gfkd6
[6] El Khchine, Y., Sriti, M., Elyamani, N.E.E.K. (2019). Evaluation of wind energy potential and trends in Morocco. Heliyon, 5(6). https://doi.org/10.1016/j.heliyon.2019.e01830
[7] Alphonse, S., Bikai, J., Fokone, A.T., Cesar, K. (2020). Potentiel énergétique éolien et profil de consommation d’énergie dans le village Wouro Kessoum Ngaoundéré Cameroun. Journal of Renewable Energies, 23(1): 72-85. https://doi.org/10.54966/jreen.v23i1.34
[8] Arim, A.I., Babikir, M.H., Chara-Dackou, V.S. (2022). Modeling and simulation of hourly irradiance for solar applications in Chad: Case of the city of abeche. International Journal of Heat & Technology, 40(4). https://doi.org/10.18280/ijht.400415
[9] Tahir, A.M., Abdraman, M.A., Mouangue, R., Kuitche, A. (2020). Estimate of the wind resource of two cities in the sahara and sahel in Chad. International Journal of Energy and Power Engineering, 9(6): 86-94. https://doi.org/10.11648/j.ijepe.20200906.11
[10] Bernard, B.T., Chara-Dackou, V.S., Goron, D., Babikir, M.H., Njomo, D. (2022). Empirical relationships between global and diffuse radiation and sunshine duration in Chad: Polynomial regression approach. International Journal of Heat and Technology, 40(1): 121-129. https://doi.org/10.18280/ijht.400114
[11] Soulouknga, M.H., Lucache, D.D., Doka, S.Y., Kofane, T.C. (2020). Techno-economic assessment of wind energy conversion systems for power generation for the city of N'Djamena in Chad. Journal of Renewable Energies, 23(2): 318-330. https://doi.org/10.54966/jreen.v23i2.49
[12] Didane, D.H., Rosly, N., Zulkafli, M.F., Shamsudin, S.S. (2017). Evaluation of wind energy potential as a power generation source in Chad. International Journal of Rotating Machinery, 2017. https://doi.org/10.1155/2017/3121875
[13] Soulouknga, M.H., Oyedepo, S.O., Doka, S.Y., Kofane, T.C. (2017). Assessment of wind energy potential in the Sudanese zone in Chad. Energy and Power Engineering, 9(7): 386-402. https://doi.org/10.4236/epe.2017.97026
[14] Soulouknga, M.H., Doka, S.Y., Revanna, N., Djongyang, N., Kofane, T.C. (2018). Analysis of wind speed data and wind energy potential in Faya-Largeau, Chad, using Weibull distribution. Renewable Energy, 121: 1-8. https://doi.org/10.1016/j.renene.2018.01.002
[15] Hanifi, S., Liu, X., Lin, Z., Lotfian, S. (2020). A critical review of wind power forecasting methods-past, present and future. Energies, 13(15): 3764. https://doi.org/10.3390/en13153764
[16] Tsvetkova, O., Ouarda, T.B. (2021). A review of sensitivity analysis practices in wind resource assessment. Energy Conversion and Management, 238: 114112. https://doi.org/10.1016/j.enconman.2021.114112
[17] Jung, C., Schindler, D. (2019). Wind speed distribution selection-A review of recent development and progress. Renewable and Sustainable Energy Reviews, 114: 109290. https://doi.org/10.1016/j.rser.2019.109290
[18] Crippa, P., Alifa, M., Bolster, D., Genton, M.G., Castruccio, S. (2021). A temporal model for vertical extrapolation of wind speed and wind energy assessment. Applied Energy, 301: 117378. https://doi.org/10.1016/j.apenergy.2021.117378
[19] Ayik, A., Ijumba, N., Kabiri, C., Goffin, P. (2021). Preliminary wind resource assessment in South Sudan using reanalysis data and statistical methods. Renewable and Sustainable Energy Reviews, 138: 110621. https://doi.org/10.1016/j.rser.2020.110621
[20] Morgan, E.F., Abdel-Rahim, O., Megahed, T.F., Suehiro, J., Abdelkader, S.M. (2022). Fault ride-through techniques for permanent magnet synchronous generator wind turbines (PMSG-WTGs): A systematic literature review. Energies, 15(23): 9116. https://doi.org/10.3390/en15239116
[21] Li, Q., Wang, J., Zhang, H. (2021). Comparison of the goodness-of-fit of intelligent-optimized wind speed distributions and calculation in high-altitude wind-energy potential assessment. Energy Conversion and Management, 247: 114737. https://doi.org/10.1016/j.enconman.2021.114737
[22] Chen, J., Kim, M.H. (2022). Review of recent offshore wind turbine research and optimization methodologies in their design. Journal of Marine Science and Engineering, 10(1): 28. https://doi.org/10.3390/jmse10010028
[23] Wang, L., Cholette, M.E., Fu, Y., Yuan, J., Zhou, Y., Tan, A.C. (2018). Combined optimization of continuous wind turbine placement and variable hub height. Journal of Wind Engineering and Industrial Aerodynamics, 180: 136-147. https://doi.org/10.1016/j.jweia.2018.07.016
[24] Ashuri, T., Zaaijer, M.B., Martins, J.R., Van Bussel, G.J., Van Kuik, G.A. (2014). Multidisciplinary design optimization of offshore wind turbines for minimum levelized cost of energy. Renewable Energy, 68: 893-905. https://doi.org/10.1016/j.renene.2014.02.045
[25] Gul, M., Tai, N., Huang, W., Nadeem, M.H., Yu, M. (2020). Evaluation of wind energy potential using an optimum approach based on maximum distance metric. Sustainability, 12(5): 1999. https://doi.org/10.3390/su12051999
[26] Jiang, P., Liu, Z., Niu, X., Zhang, L. (2021). A combined forecasting system based on statistical method, artificial neural networks, and deep learning methods for short-term wind speed forecasting. Energy, 217: 119361. https://doi.org/10.1016/j.energy.2020.119361
[27] Ouedraogo, S., Lolo, K., Attipou, K., Ajavon, A.S.A., Tiem, S. (2020). Assessment of wind potential in the perspective of water pumping in sahelian area of burkina faso. International Journal of Engineering Research & Technology (IJERT), 9: 231-243.
[28] Galarza, J., Condezo, D., Camayo, B., Mucha, E. (2020). Assessment of wind power density based on Weibull distribution in region of Junin, Peru. Energy and Power Engineering, 12(01): 16-27. https://doi.org/10.4236/epe.2020.121002
[29] Negash, T., Möllerström, E., Ottermo, F. (2020). An assessment of wind energy potential for the three topographic regions of Eritrea. Energies, 13(7): 1846. https://doi.org/10.3390/en13071846
[30] Gupta, R., Biswas, A. (2010). Wind data analysis of Silchar (Assam, India) by Rayleigh’s and Weibull methods. Journal of Mechanical Engineering Research, 2(1): 10-24.
[31] Sengupta, A.R., Biswas, A., Gupta, R. (2015). A statistical analysis of wind energy potential of agartala (Tripura, India) based on different models-a case study. International Journal of Advanced Information Science and Technology, 4(12): 94-101. https://doi.org/10.15693/ijaist/2015.v4i12.94-101
[32] Satwika, N.A., Hantoro, R., Septyaningrum, E., Mahmashani, A.W. (2019). Analysis of wind energy potential and wind energy development to evaluate performance of wind turbine installation in Bali, Indonesia. Journal of Mechanical Engineering and Sciences, 13(1): 4461-4476. https://doi.org/10.15282/jmes.13.1.2019.09.0379
[33] Nsouandélé, J.L., Kaoga, D.K., Djetouda, S.M., Djongyang, N. (2016). Estimation statistique des données du vent à partir de la distribution de Weibull en vue d’une prédiction de la production de l’énergie électrique d’origine éolienne sur le Mont Tinguelin à Garoua dans le Nord Cameroun. Journal of Renewable Energies, 19(2): 291-301. https://doi.org/10.54966/jreen.v19i2.568
[34] Akpo, A.B., Damada, J.C.T., Donnou, H.E.V., Kounouhewa, B.B., Awanou, C.N. (2015). Evaluation de la production énergétique d’un aérogénérateur sur un site isolé dans la région côtière du Bénin. Journal of Renewable Energies, 18(3): 457-468. https://doi.org/10.54966/jreen.v18i3.520
[35] Boro, D., Donnou, H.E.V., Kossi, I., Bado, N., Kieno, F.P., Bathiebo, J. (2019). Vertical profile of wind speed in the atmospheric boundary layer and assessment of wind resource on the bobo dioulasso site in burkina faso. Smart Grid and Renewable Energy, 10: 257-278. https://doi.org/10.4236/sgre.2019.1011016
[36] Tizgui, I., Bouzahir, H., El Guezar, F., Benaid, B. (2016). Estimation of electricity production for a Moroccan wind farm. In 2016 5th International Conference on Electronic Devices, Systems and Applications (ICEDSA), Ras Al Khaimah, United Arab Emirates, pp. 1-4. https://doi.org/10.1109/ICEDSA.2016.7818555
[37] Salah, M.M., Abo-khalil, A.G., Praveen, R.P. (2021). Wind speed characteristics and energy potential for selected sites in Saudi Arabia. Journal of King Saud University-Engineering Sciences, 33(2): 119-128. https://doi.org/10.1016/j.jksues.2019.12.006
[38] Pabame, Z., Kebe, C.M.F., Bilal, B.O., Ndiaye, A., Gueye, A., Ndiaye, P.A. (2018). A study of the wind potential in climatic zones of Chad. In Innovations and Interdisciplinary Solutions for Underserved Areas: Second International Conference, InterSol 2018, Kigali, Rwanda, Proceedings. Springer International Publishing, 2: 100-107. https://doi.org/10.1007/978-3-319-98878-8_10
[39] Oyedepo, S.O., Adaramola, M.S., Paul, S.S. (2012). Analysis of wind speed data and wind energy potential in three selected locations in south-east Nigeria. International Journal of Energy and Environmental Engineering, 3: 1-11. https://doi.org/10.1186/2251-6832-3-7
[40] Ucar, A., Balo, F. (2009). Evaluation of wind energy potential and electricity generation at six locations in Turkey. Applied Energy, 86(10): 1864-1872. https://doi.org/10.1016/j.apenergy.2008.12.016
[41] Lun, I.Y., Lam, J.C. (2000). A study of Weibull parameters using long-term wind observations. Renewable Energy, 20(2): 145-153. https://doi.org/10.1016/S0960-1481(99)00103-2
[42] Kainkwa, R.M.R. (2000). Wind speed pattern and the available wind power at Basotu, Tanzania. Renewable Energy, 21(2): 289-295. https://doi.org/10.1016/S0960-1481(00)00076-8
[43] Diaf, S., Notton, G. (2013). Technical and economic analysis of large-scale wind energy conversion systems in Algeria. Renewable and Sustainable Energy Reviews, 19: 37-51. https://doi.org/10.1016/j.rser.2012.11.026