Ibukun O. Eweoya![]() | Oluwole A. Odetunmibi*
| Oluwole A. Odetunmibi*![]() | Isaac A. Odun-Ayo | Kehinde K. Agbele | Adedayo F. Adedotun
| Isaac A. Odun-Ayo | Kehinde K. Agbele | Adedayo F. Adedotun![]() | Toluwalase J. Akingbade
| Toluwalase J. Akingbade![]()
© 2023 IIETA. This article is published by IIETA and is licensed under the CC BY 4.0 license (http://creativecommons.org/licenses/by/4.0/).
OPEN ACCESS
The recent evolution of the novel COVID-19 pandemic posed unprecedented challenges for the global community and researchers alike without reference literature or prior prediction approaches applied to that context, leading to its great impact on the economies of different countries. This work aims to address these challenges by predicting the spread of COVID-19 in Nigeria. In order to carry out this research, raw data on COVID-19 pandemic in Nigeria was gotten from John Hopkins University repository through Github as submitted by the Nigeria Center for Disease Control (NCDC) through the World Health Organization (WHO). Python, along with its packages such as Numpy, SciPy, Pandas, Matplotlib, and Plotly, was used to process and visualize the data for this model. Google Colab; a Jupyter notebook environment that run on the cloud was employed too. The SIR (Susceptible, Infected, Recovered or Removed) population model, which is commonly employed for modelling epidemics, was used to predict the spread of the pandemic in Nigeria. The machine learning Python packages used in the analysis included Pandas for data analysis and manipulation, Numpy for executing mathematical and logical operations, and SciPy for operations such as regression, minimization, and Fourier series. The model developed in this study predicted a peak of the pandemic between June and August, 2020, and a flattening of the curve in January 2021; the predicted dates were accurate when compared to real-world data. The outcome of the study provides better insight (for instance; rate of spread in response to certain conditions and corresponding mortality or survival rate) on the future of the COVID-19 pandemic; yielding more information that will help in planning for the future through evidenced correctness and reliability. The work present the recovery coefficient rate (β), the transmission coefficient (γ) and, the basic reproduction ratio (R0) values for the data under consideration that indicates a reliable model for predictions.
global pandemic, COVID-19, machine learning, prediction, ANN, SIR-model
The outbreak of the COVID-19 virus took the world by surprise at the start of 2020 and has had a serious impact on businesses, economies, healthcare and human life in general. The virus was initially named “2019-nCoV” and then renamed to “SARS-CoV-2” due to its similarity to the SARS-CoV [1]. Mankind has always suffered from the aftermath of epidemics that have always plagued the world dating back to the accounts recorded in the evolution of man. The famous plague called the Black Death was said to have wiped out about half the population of Europe. The plague was around for over 300 years and caused frequent outbreaks causing the death of almost 200 million people [2]. The Spanish flu in 1918 was the first pandemic, which occurred during the setting of modern medicine, and it had a death toll of over 50 million people. Severe Acute Respiratory Syndrome (SARS) occurred in the 21st century and was caused by the SARS coronavirus. It had a death toll of fewer than 10,000 but had a mortality rate of 10%, and this raised a serious concern. It was contained by the middle of 2003.
In December 2013, the Ebola virus appeared in a village in Guinea and spread to most countries in Central and West Africa, with over 28,000 cases and 11,000 deaths [2]. There are other notable epidemics that have plagued the world over time, such as the Circa of 3000 B.C., the plagues of Athens, the Justinian Plague, the Antonine plague, the great plague of London in the 17th century, The H1N1 Swine Flu, the AIDS- Acquired Immuno-Deficiency Syndrome pandemic which started in 1981 and has lasted till present day; the Zika virus and the Lassa fever pandemic [3]. Following the emergence of COVID-19 in Nigeria, several measures were put in place to curb the spread of the virus.
Operations of domestic and international flights came to a halt, all schools were immediately closed, while only essential workers were permitted to be physically present at work, all other workers were to work remotely and the wearing of nose masks in public places was enforced. The NCDC- National Centre for Disease Control set up various testing centres across the country and presented live updates concerning the number of tests carried out, confirmed cases, recovered cases, and fatalities. With the frequent occurrence of these epidemics, it has become very important to study, track and predict the spread of these diseases using statistical and mathematical models [4, 5].
One of the major assumptions of the classic SIR model is that there is a homogeneous mixing of the infected and susceptible populations and that the total population is constant in time. In the classic SIR model, the susceptible population decreases monotonically towards zero [6].
1.1 COVID 19 and Nigeria
Nigeria is the most populated nation in Africa with over 200 million people, out of which over 6.5 million people are over the age of 65 years [7]. These individuals aged 65 and above are the ones at risk of suffering more in this pandemic. Alas, Nigeria does not have the expected volume of standard healthcare system that can cater for its citizens during a pandemic of this magnitude. It also lacks the resources to carry out accurate contact tracing which can lead to the number of reported cases being lower. All 36 states in Nigeria including the FCT have reported cases of COVID 19 and the spread is reflected in Figure 1.
Figure 1. A map showing the spread of COVID 19 across Nigeria [8]
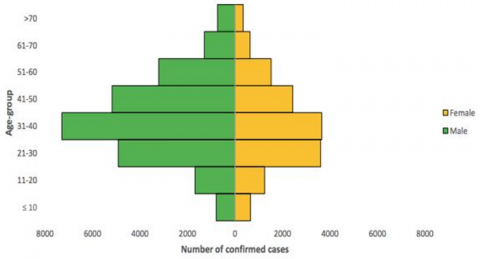
Lagos, Oyo, and FCT were the states with the highest number of cases while Cross River and Kogi states had the least number of cases. The case Fatality Ratio is 2% and the gender distribution shows that the infected persons are 65% male and 35% female. The gender distribution for infected cases are as reflected in Figure 2.
Figure 2. Gender distribution for infected cases [8]
The COVID-19 pandemic caused Nigeria to come to a standstill for three months in the year 2020 with the closure of schools and businesses; there seems to be no adequate plan for sustainability because there was not enough information on the pandemic to plan for the future. Studying data collected during this pandemic will aid in predicting the future and putting plans in place.
The choice of Nigeria in context is largely based on its infrastructural deficits, literacy rate, skyrocketing poverty rate, unemployment, and global poor economic status when the population is considered. There was so much fear globally that that the above-stated parameter would completely crumble Nigeria since those factors make ignorance inclined, and a contagious disease like COVID-19 was to bring the country to extinction. It is therefore paramount that this paper has addressed the factors and conditions that finally kept the pandemics’ fatality in check and revealing predictions based on machine learning which finally correlates with the reality on ground based on the spread, peak, and the stopping time of the pandemic.
Furthermore, the predictive analysis was a necessity in Nigeria because the existing health facilities, interconnection of medical services, and pandemic management system was almost at point zero when the pandemic struck. It was therefore essential to swiftly employ machine learning prediction techniques to gain future insights in Nigeria or face extinction if there was no clear cut way forward. As a quick fix was in place, updating the medical system and test samples handling system, personnel training, importation of vaccines and others this work’s prediction helps to determine the volume of resources needed per time based on the knowledge of the peak and a stop of the pandemic, which was correct in real life. The prediction avoided wastage of resources or having less health utilities while the pandemic peaks. The insights as given by the work saved lives and resources as it launched Nigeria into its unknown world where a remedy must be provided on time.
The COVID 19 disease affects the respiratory system and the causative agent is the SARS-CoV-2. Pneumonia appears to be the most serious manifestation of infection. The symptoms associated with this disease are fever, sore throat, cough, dyspnoea, headache, rhinorrhoea, nausea and diarrhoea [9]. The period from the emergence of COVID-19 symptoms to demise ranges from 1 to 5 weeks, with a 2-week average. This time depends mainly on the status of the patient's immune system and the patient's age. Patients over the age of 65 and patients with underlying health issues are at risk of the virus having a greater effect.
1.2 Forecasting techniques
Forecasting involves the estimation or prediction of future events. There are various techniques used in forecasting and they are categorized into the following four groups.
Big Data: Analysis of big datasets is done by using mathematical equations and machine learning techniques. The accuracy of the forecast is highly dependent on the data sources used for forecasting.
Mathematical Models: Mathematical and Stochastic theory has been applied during the past few pandemics to predict death count and has proven to be very effective.
Data Science/Machine Learning Techniques: The accuracy of machine learning techniques makes it the most used technique worldwide for forecasting. There are various machine learning models which can be used in forecasting, it is necessary that the right model is always used depending on the analysis.
1.3 Predictive analytics
Predictive analytics is a field of data analytics which makes use of present and past information to predict what will happen in the future.
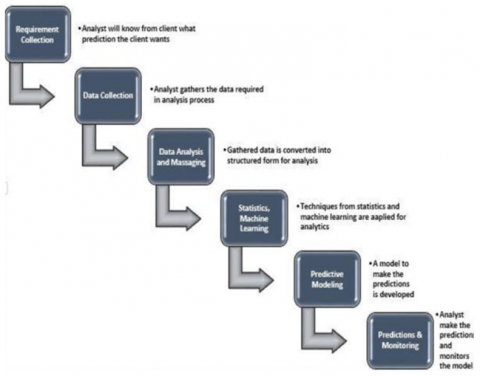
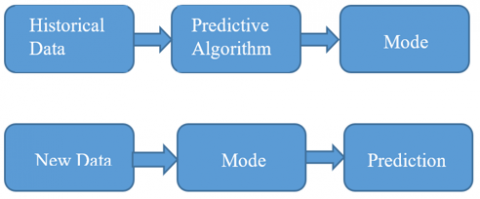
The different models used in predictive analytics are: predictive, descriptive, and decision models. Predictive analytics involves various steps in the process of forecasting, these steps are represented in Figure 3.
Figure 3. Predictive analytics process [10]
1.4 Predictive analytics techniques
(i) Time Series Analysis: This is a method which utilizes data gathered across a period of time at intervals to forecast the future.
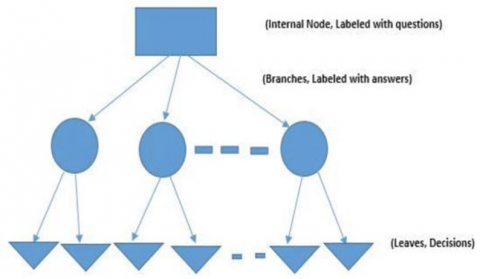
(ii) Decision Tree: A classification model that relates decision to possible outcomes. Its operations are as shown in Figure 4. With basic groupings into branches to solve problems further.
Figure 4. Decision tree [10]
(iii) Regression Model: This is a popular predictive technique that models relationships between dependent and independent variables.
(iv) Artificial Neural Networks: This is a sophisticated model based on a network of artificial neurons with the ability to process input signals and produce output. This is depicted in Figure 5.
Figure 5. ANN layers [11]
1.5 Time series forecasting
Time series forecasting involves predicting the future after careful analysis of past data. Time series forecasting is commonly used in predicting stock market prices, exchange rates and natural occurrences [12]. Auto-Regressive Integrated Moving Average (ARIMA), TBAT, Deep R and N-Beats are a few methods used in time series forecasting [13].
1.6 Exploratory data analysis (EDA)
Exploratory Data Analysis is the process of analyzing data sets to gain insights on their characteristics using visual methods. Exploratory Data Analysis is basically checking for what can be learned from the data beyond the formal modelling. The graphical techniques used in EDA are: Odds ratio, Box plot, Scatter plot, Histogram, Parallel coordinates, Run chart, Pareto chart, Multidimensional scaling, Multilinear PCA, Ordination.
Time series forecasting is a technique for predicting future events by analyzing past trends, based on the assumption that future trends will hold similar to historical trends. Forecasting involves using models fit on historical data to predict future values, which provides a data-driven approach to effective and efficient planning. This is as found in the COVID-19 scenario and makes the time series forecasting a choice approach in this research.
Furthermore, exploratory data analysis as employed in this work helps determine how best to manipulate data sources to get the answers you need, making it easier for data scientists to discover patterns, spot anomalies, test a hypothesis, or check assumptions. COVID-19 being a pandemic new in its existence as featured in this research has to depend on a powerful tool for pattern discovery as found in the employed exploratory data analysis. There are several goals of exploratory data analysis, which are: To determine if there are any problems with your dataset; to determine whether the question you are asking can be answered by the data that you have or not, and these are crucial to a pandemic prediction context of this work.
The SIR model is more suitable to predict the epidemic trend due to the spread of the disease as it can accommodate surges and be adjusted to the recorded data. By comparing the published data with predictions, it is possible to predict the success of government interventions [6].
There are many research papers which have substantial findings and current knowledge in the area of predictive analytics [14].
In the work [15], a predictive analysis of the spread of COVID 19 was provided using time series datasets made public by John Hopkins university. Polynomial regression and neural networks were the two method uses in this analysis. To prevent overfitting, a single-layer neural network called the extreme learning machine was utilized. The main goal of this study was to be able to provide prediction of the number of infected persons over the next 14 days in different countries. The countries considered in this study were Sweden, Denmark, Finland, Norway, France, Italy, Spain, UK, China, India, Iran and USA [15].
Udanor and Eneh [3] employed the SIR- Susceptible, Infected, Recovered or Removed population model which is generally used for modelling epidemics and time series data in predicting the COVID 19 pandemic in Nigeria. Results from the predictions were compared against the actual records from different countries to evaluate the accuracy of the model [3].
The research that was carried out in [16] with data from WHO, John Hopkins University and DingXiangYuan is a Corona Tracker. The Data was then visualized on data lakes platform. Predictive modelling was done using the SEIR model and sentiment analysis was carried out on news that was collected and stored in the CoronaTracker database [16].
Also, Sengupta et al. [17] did an analysis of COVID 19 data at a global level and then narrowed down to India. Analysis of various features like geographical location, age and gender were done with python and techniques for data visualization. Kaggle provided global data and local data in multiple sheets. A Sigmoid function has been used to forecast India's near future [17].
In the study of Arora et al. [18], deep learning-based models were employed to predict the number of reported positive cases of COVID-19 in India. LSTM variations such as Convolutional LSTM, Deep LSTM and Bi-directional LSTM are utilized on datasets to forecast the number of confirmed cases.
In the study of Yudistira [19], which adopted multivariate long short term memory to predict COVID-19, the LSTM method was applied to study the correlation of the growth of COVID 19 pandemic over time. The LSTM showed a pattern between the confirmed cases and the prediction.
In a model-based prediction analysis in the study of Swain et al. [20], the work employed the cubic model and the Baileys principle for prediction. Real time daily data from 16th March 2020 to 13th June 2020 was used for this prediction. The study predicts that the pandemic will come to an end in Odisha in the middle of August 2020 [20].
In order to carry out this research, raw data on COVID-19 pandemic in Nigeria was gotten from John Hopkins University https://github.com/CSSEGISandData/COVID-19. The data was analysed using Python packages in Google Colab. The SIR - Susceptible, Infected, Recovered or Removed population model which is a model used for modelling epidemics was employed to predict the spread of the pandemic in Nigeria.
3.1 Data collection
The data used to carry out this study was collected from live links on GitHub, provided by the John Hopkins University (JHU). There were 4 datasets collected for this study, (i) the dataset that consists of daily COVID-19 confirmed cases, (ii) the dataset that consists of daily COVID-19 recovered cases, (iii) the dataset that consists of daily COVID-19 fatalities and (iv) the dataset that consists of cases by countries. These datasets are stochastic in nature; they consist of time series data starting from 1/22/2020 and are updated daily.
3.2 Data cleaning
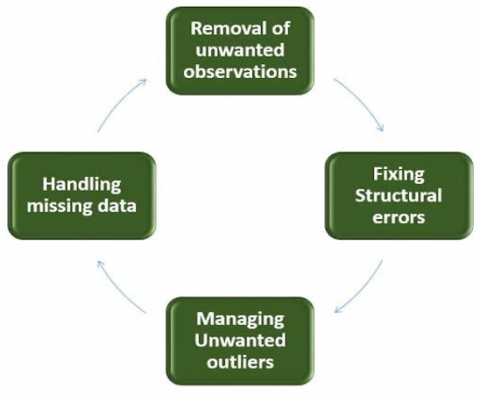
In this stage, irrelevant fields were eradicated from the dataset. Only the fields that were necessary to the study were retained. This is done before analysis to make the model more accurate. Figure 6 below details the data cleaning cycle, while Table 1 shows relevant fields in the dataset.
Figure 6. Data cleaning cycle [21]
Table 1. Relevant fields in the datasets
|
Relevant Fields |
Description |
|
Confirmed |
Number of confirmed cases |
|
Deaths |
Number of fatalities |
|
Recovered |
Number of recovered persons |
|
Country/Region |
Country of focus |
|
Active |
Number of active cases |
3.3 Data analysis
For the analysis of this research, the following packages that are necessary for the analysis were imported as discussed below:
Pandas: This is a library written for python language and it can be used for data analysis and manipulation. It has operations and data structures that are adequate for manipulating time series data. Dataframes in pandas can be used to download data in csv format which was used in this study. The pandas data structures are shown in Table 2.
Table 2. Pandas data structures
|
Dimensions |
Name |
Description |
|
1 |
Series |
1D labelled uniformly-typed array |
|
2 |
Data Frame |
General 2D labelled, size changeable tabular arrangement with a column that is possibly diverse |
NumPy: It is a python library with multi-dimensional arrays and matrix data formats which can be used to execute mathematical and logical operations.
SciPy: It is a package that expands NumPy 's functionality with a large set of important algorithms such as regression, Fourier transformation, minimization and other mathematical techniques [22].
3.4 Data visualization
In this study, Plotly was used for visualization purposes. Plotly is an interactive, open-source graphing library for python. Plotly was chosen because it provides a feature that no other visualization library has-interactivity: This allows users to interact with graphs on display, allowing for a better storytelling experience. Zooming in and out, point value display, panning graphs, you name it, they have it. Plotly displays data in an extra ordinary version while seaborn and matplotlib are for basic plotting.
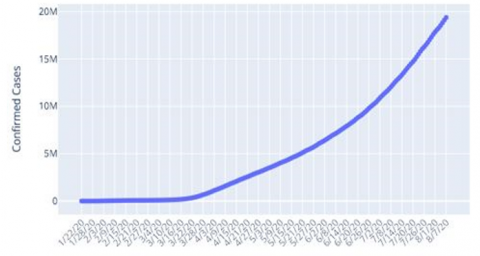
Plotly was used to visualize the data in this study, showing the confirmed COVID 19 cases globally in Figure 7, case trend for COVID 19 globally in Figure 8; while Figure 9 reveals Nigeria's COVID 19 case trend.
Figure 7. Confirmed cases globally
Figure 8. Global COVID 19 case trend
Figure 9. Nigeria's COVID 19 case trend
3.5 SIR- susceptible, infected, recovered or removed population model
The SIR model is used to describe basic principles of a pandemic. In this model, the total population is divided up into three categories:
(i) S – Susceptible population;
(ii) I – Infected population;
(iii) R - Recovered/removed population.
The susceptible population are people who can potentially contact the virus, the Infected are those who currently have the virus and can transmit the virus to others, and the Recovered/Removed are those who have contacted the disease and have either been cured or have succumbed to the effects of the virus.
The variables in this model are: S, I, R, R0, β, γ with each meaning expressed in (1-6) and the stages represented in Figure 10.
S - The number of susceptible people.
I - The number of infected persons.
R - The number of persons that have recovered.
R0- Basic Reproduction ratio which characterizes how the pandemic will grow.
Β - The transmission coefficient.
γ - The recovery coefficient.
Figure 10. SIR –susceptible, infected, recovered or removed population model
Though Melikechi et al. [23] outlined some limits of epidemic prediction using SIR. The SIR model can be used to model some of the possible scenarios if the early relaxation of restrictions leads to increasing number of susceptible populations. If there is a relatively small increase in the future number of susceptible individuals, no series impacts occur.
3.5.1 Differential equations
This model is given by three equations:
Eq. (1): Rate of change of susceptible population
$\frac{d S}{d t}=-\beta \mathrm{IS}$ (1)
where, I=the number of infected; S=the number of susceptible population.
Eq. (2): Rate of change of infected
$\frac{d I}{d t}=\beta \mathrm{IS}-\gamma \mathrm{I}$ (2)
where, γ=the constant rate of change of removals.
Eq. (3): Rate of change of recovered/removed
$\frac{d R}{d t}=\gamma \mathrm{I}$ (3)
Knowing the total number of the susceptible population, S, the total number of infected population, I, and the total number of recovered or removed population, R, is constant. Therefore, we have: $\frac{d(S+I+R)}{d t}$=0 and it is also know that the total population is made up of the susceptibles, the infected and the removed and this is also constant, so S+I+R=S0+I0. This is constant by our first assumption. Therefore, the model is termed a closed model for this reason. At first, we have everybody susceptible and the quantity of recovered or removed is zero. As time advances the number of susceptible declines as people get contaminated. Individuals move from the S class into the I class.
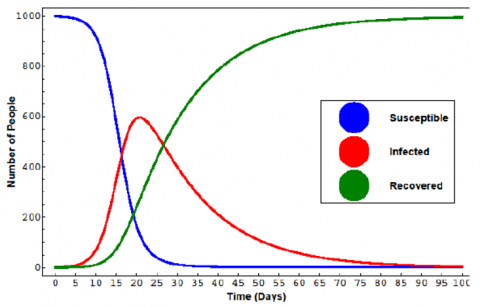
As the amount of susceptible reduces and the amount of recovered or removed increases, the contaminated people increases yet levels out and afterward begins to decline. So $\frac{d I}{d t}>0$ when time t=0 and the epidemic begins. The transition between a pandemic and a non-pandemic spread of a disease occurs when $\frac{d I}{d t}=0$ and this occurs when $\mathrm{S}_0=\frac{\gamma}{\beta}$. Also, the peak of a pandemic occurs when $\mathrm{S}=\frac{\gamma}{\beta}$. and the rate of change of the infected group stops growing and starts reducing. Therefore, we can flatten the curve. Figure 11 shows an SIR model solution example.
Figure 11. Example of an SIR model solution [24]
4.1 The prediction model (Predicting with the model)
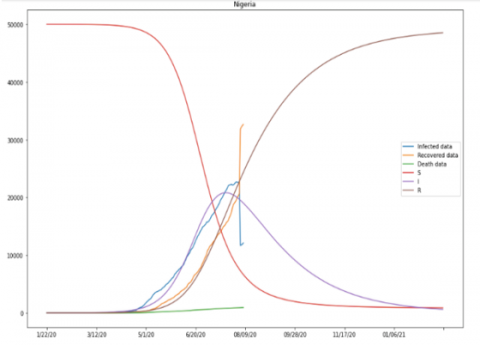
The developed model present the forecasting value for model as: the recovery coefficient, β is 0.00000167, the transmission coefficient, γ is 0.02016626, the basic reproduction ratio, R0 is 0.00008279. The prediction process is as indicated in Figure 12, and Figure 13 shows COVID-19 prediction in Nigeria (Table 3).
Table 3. CSV confirmed cases dataset on GitHub [25]
|
Province/State |
Country/Region |
Lat |
Long |
1/22/20 |
1/23/20 |
1/24/20 |
1/25/20 |
1/26/20 |
1/27 /20 |
1/28 /20 |
1/29/20 |
|
|
Afghanistan |
33.9391 |
67.7099 |
0 |
0 |
0 |
0 |
0 |
0 |
0 |
0 |
|
|
Albania |
41.1533 |
20.1683 |
0 |
0 |
0 |
0 |
0 |
0 |
0 |
0 |
|
|
Algeria |
28.0339 |
1.6596 |
0 |
0 |
0 |
0 |
0 |
0 |
0 |
0 |
|
|
Andorra |
42.5063 |
1.5218 |
0 |
0 |
0 |
0 |
0 |
0 |
0 |
0 |
|
|
Angola |
-11.2027 |
17.8739 |
0 |
0 |
0 |
0 |
0 |
0 |
0 |
0 |
|
|
Antigua and Barbuda |
17.0608 |
-61.7964 |
0 |
0 |
0 |
0 |
0 |
0 |
0 |
0 |
|
|
Argentina |
-38.4161 |
-63.6167 |
0 |
0 |
0 |
0 |
0 |
0 |
0 |
0 |
|
|
Armenia |
40.0691 |
45.0382 |
0 |
0 |
0 |
0 |
0 |
0 |
0 |
0 |
|
Australia Capital Territory |
Australia |
-35.4735 |
149.0124 |
0 |
0 |
0 |
0 |
0 |
0 |
0 |
0 |
|
New South Wales |
Australia |
-33.8688 |
151.2093 |
0 |
0 |
0 |
0 |
3 |
4 |
4 |
4 |
|
Northern Territory |
Australia |
-12.4634 |
130.8456 |
0 |
0 |
0 |
0 |
0 |
0 |
0 |
0 |
|
Queensland |
Australia |
-27.4698 |
153.0251 |
0 |
0 |
0 |
0 |
0 |
0 |
0 |
1 |
|
South Australia |
Australia |
-34.9285 |
138.6007 |
0 |
0 |
0 |
0 |
0 |
0 |
0 |
0 |
|
Tasmania |
Australia |
-42.8821 |
147.3272 |
0 |
0 |
0 |
0 |
0 |
0 |
0 |
0 |
|
Victoria |
Australia |
-37.8136 |
144.9631 |
0 |
0 |
0 |
0 |
1 |
1 |
1 |
1 |
|
Western Australia |
Australia |
-31.9505 |
115.8605 |
0 |
0 |
0 |
0 |
0 |
0 |
0 |
0 |
|
|
Australia |
47.5162 |
14.5501 |
0 |
0 |
0 |
0 |
0 |
0 |
0 |
0 |
|
|
Azerbaijan |
40.1431 |
47.5769 |
0 |
0 |
0 |
0 |
0 |
0 |
0 |
0 |
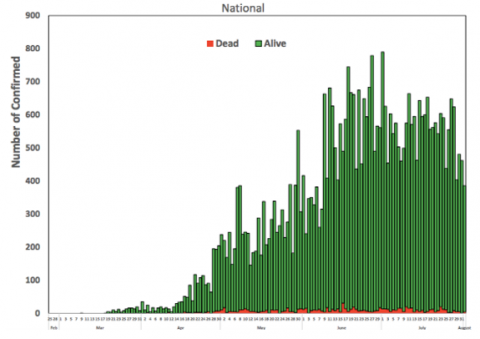
From the prediction graph, it can be seen that the curve begins to flatten in January 2021. The pandemic is expected to peak between June and August of 2020. Furthermore, Figure 14 shows the epidemic curve of confirmed cases week 9 - 31 from Nigeria’s Centre for Disease Control, and Tables 4-6 blow shows the actual COVID 19 data vs predicted data for Nigeria.
Figure 12. The prediction process
Figure 13. Graph showing the COVID 19 prediction in Nigeria
Figure 14. Epidemic curve of confirmed cases week 9 - 31 [8]
Table 4. Data from JHU ‘country cases’ dataset
|
Country |
Confirmed |
Deaths |
Recovered |
Active |
ISO3 |
|
Australia |
21084.0 |
295.0 |
11875 |
8914.0 |
AUS |
|
Austria |
22033.0 |
721.0 |
19923 |
1389.0 |
AUT |
|
Canada |
121287.0 |
9027.0 |
105387 |
6874.0 |
CAN |
|
China |
88744.0 |
4685.0 |
82061 |
1998.0 |
CHN |
|
Denmark |
14759.0 |
617.0 |
13069 |
1073.0 |
DNK |
|
Finland |
7584.0 |
331.0 |
6980 |
273.0 |
FIN |
|
France |
235237.0 |
30327.0 |
82971 |
121939.0 |
FRA |
|
Germany |
217185.0 |
9202.0 |
196783 |
11200.0 |
DEU |
|
Iceland |
1958.0 |
10.0 |
1834 |
114.0 |
ISL |
|
Ireland |
26712.0 |
1772.0 |
23364 |
1576.0 |
IRL |
|
Italy |
250566.0 |
35205.0 |
202098 |
13263.0 |
ITA |
|
Netherlands |
59360.0 |
6178.0 |
237 |
52945.0 |
NLD |
|
Norway |
9615.0 |
256.0 |
8857 |
502.0 |
NOR |
|
Russia |
885718.0 |
14903.0 |
692059 |
178756.0 |
RUS |
|
Sweden |
82323.0 |
5763.0 |
|
76560.0 |
SWE |
Table 5. Most infected states in Nigeria [8]
|
S/N |
States Affected |
No of Cases (Lab. Confirmed) |
No of Cases (On Admission) |
No Discharged |
No of Deaths |
|
1. |
Lagos |
15,768 |
2,453 |
13,122 |
193 |
|
2. |
FCT |
4,378 |
3,083 |
1,247 |
46 |
|
3. |
Oyo |
2,860 |
1,427 |
1,402 |
31 |
|
4. |
Edo |
2,376 |
185 |
2,095 |
96 |
|
5. |
Rivers |
1,939 |
245 |
1,641 |
53 |
|
6. |
Kano |
1,622 |
265 |
1,303 |
54 |
|
7. |
Delta |
1,596 |
144 |
1,409 |
43 |
|
8. |
Kaduna |
1,566 |
175 |
1,379 |
12 |
|
9. |
Ogun |
1,439 |
181 |
1,234 |
24 |
|
10. |
Plateau |
1,421 |
772 |
629 |
20 |
Table 6. Actual COVID 19 data Vs predicted data for Nigeria
|
Date |
Infected Data |
Recovered Data |
Death Data |
S |
I |
R |
|
06/01/20 |
7157 |
3122 |
299 |
41437 |
6334 |
2230 |
|
06/02/20 |
7265 |
3240 |
314 |
40994 |
6650 |
2358 |
|
06/03/20 |
7522 |
3329 |
315 |
40533 |
6977 |
2492 |
|
06/04/20 |
7658 |
3535 |
323 |
40055 |
7314 |
2633 |
|
06/05/20 |
7815 |
3696 |
333 |
39560 |
7661 |
2781 |
|
06/06/20 |
8065 |
3826 |
342 |
39048 |
8019 |
2936 |
|
06/07/20 |
8173 |
3959 |
354 |
38519 |
8386 |
3098 |
|
06/08/20 |
8400 |
4040 |
361 |
37973 |
8762 |
3267 |
|
06/09/20 |
8893 |
4206 |
365 |
37411 |
9147 |
3444 |
|
06/10/20 |
9140 |
4351 |
382 |
36833 |
9540 |
3629 |
|
06/11/20 |
9673 |
4494 |
387 |
36239 |
9940 |
3822 |
|
06/12/20 |
9891 |
4891 |
399 |
35631 |
10348 |
4023 |
|
6/13/20 |
10174 |
5101 |
407 |
35008 |
10761 |
4233 |
|
6/14/20 |
10445 |
5220 |
420 |
34372 |
11180 |
4450 |
|
6/15/20 |
10885 |
5349 |
424 |
33723 |
11603 |
4676 |
|
6/16/20 |
11070 |
5623 |
455 |
33063 |
12029 |
4910 |
|
6/17/20 |
11299 |
5967 |
469 |
32392 |
12457 |
5152 |
|
6/18/20 |
11698 |
6307 |
475 |
31712 |
12887 |
5403 |
|
6/19/20 |
12079 |
6581 |
487 |
31023 |
13316 |
5663 |
|
6/20/20 |
12584 |
6718 |
506 |
30328 |
13744 |
5930 |
|
6/21/20 |
12847 |
6879 |
518 |
29627 |
14169 |
6206 |
|
6/22/20 |
13285 |
7109 |
525 |
28922 |
14590 |
6491 |
The variety, volume, and velocity of data as presented in Tables 3, 4 and 5 concerning the pandemic may not be handled by statistical approach alone, hence; the choice of machine learning for this work. To the best of our knowledge, no previous work on COVID-19 prior 2020, except for the general epidemiology and breakout of other diseases in the past. However, subsequent happenings after the breakout of the novel pandemic have corroborated the predictions made by this work, most especially the peak period as proved by earlier presented graphs which are products of the developed model in this work.
This work serves as one of the reference works in pandemic prediction in the African context with the choice of datasets from Nigeria except for comparison as given by centre for disease control in chosen continents. The peculiarity of weather and friendliness or otherwise of the virus to heat in Africa calls for more collaboration research in Virology and machine learning to curb the limitations of required dataset availability.
The model provided in this work aids decision making ahead of time possible. Predictions are correctly made into the future and the government can adequately prepare for expected government actions to tackle a disease, knowing the peak period and the time it disappears provided the necessary vaccines are taken and medical advice are heeded.
The pandemic is growing at an alarming rate, the best way to tackle this pandemic is to reduce the rate of transmission by maintaining social distancing and good hygiene practices. If the rate of transmission is slowed down, the pandemic will gradually die out. However, vaccines are available, despite the availability of vaccines as at 2021 March, new variants are coming up and the vaccines have not reached everybody while others complain of side effects.
The work has recovery coefficient, β as 0.00000167, the transmission coefficient, γ as 0.02016626, the basic reproduction ratio, R0 as 0.00008279; which indicates a reliable model for predictions.
It is recommended that the characteristics of the virus needs to be studied extensively in order to understand the pandemic better. Also, the study can be extended to analyze the trends of other countries and use those trends to make predictions for other countries.
|
Big Data |
Machine Learning |
|
Big Data is more of extraction and analysis of information from huge volumes of data. |
Machine Learning is more of using input data and algorithms for estimating unknown future results. |
|
Types of Big Data are Structured, Unstructured and Semi-Structured. |
Types of Machine Learning Algorithms are Supervised Learning and Unsupervised Learning, Reinforcement Learning. |
|
Big data analysis is the unique way of handling bigger and unstructured data sets using tools like Apache Hadoop, MongoDB. |
Machine Learning is the way of analysing input datasets using various algorithms and tools like Numpy, Pandas, Scikit Learn, TensorFlow, Keras. |
|
Big Data analytics pulls raw data and looks for patterns to help in stronger decision-making for the firms |
Machine Learning can learn from training data and acts like a human for making effective predictions by teaching itself using Algorithms. |
|
It’s very difficult to extract relevant features even with latest data handling tools because of high-dimensionality of data. |
Machine Learning models work with limited dimensional data hence making it easier for recognizing features |
|
Big Data Analysis requires Human Validation because of large volume of multidimensional data. |
Perfectly built Machine Learning Algorithms does not require human intervention. |
|
Big Data is helpful for handling different purposes including Stock Analysis, Market Analysis, etc. |
Machine Learning is helpful for providing virtual assistance, Product Recommendations, Email Spam filtering, etc. |
|
The Scope of Big Data in the near future is not just limited to handling large volumes of data but also optimizing the data storage in a structured format which enables easier analysis. |
The Scope of Machine Learning is to improve quality of predictive analysis, faster decision making, more robust, cognitive analysis, rise of robots and improved medical services. |
|
Big data analytics look for emerging patterns by extracting existing information which helps in the decision making process. |
It teaches the machine by learning from existing data. |
|
Problem: Dealing with large volumes of data. |
Problem: Overfitting. |
|
It stores large volumes of data and finds out patterns from data. |
It learns from trained data and predicts future results. |
|
It processes and transforms data to extract useful information. |
Machine Learning uses data for predicting output. |
|
It deals with High-Performance Computing. |
It is a part of Data Science. |
|
Volume, velocity, and variety of data |
Building predictive models from data |
|
Managing and analyzing large amounts of data |
Making accurate predictions or decisions based on data |
|
Descriptive and diagnostic |
Predictive and prescriptive |
|
Large volumes of structured and unstructured data |
Historical and real-time data |
|
Reports, dashboards, and visualizations |
Predictions, classifications, and recommendations |
|
Data storage, processing, and analysis |
Regression, classification, clustering, deep learning |
|
Data cleaning, transformation, and integration |
Data cleaning, transformation, and feature engineering |
|
Strong domain knowledge is often required |
Domain knowledge is helpful, but not always necessary |
|
Can be used in a wide range of applications, including business, healthcare, and social science |
Primarily used in applications where prediction or decision-making is important, such as finance, manufacturing, and cybersecurity |
[1] Hassanien, A.E., Dey, N., Elghamrawy, S. (2020). Big Data Analytics and Artificial Intelligence Against COVID-19: Innovation Vision and Approach. Springer Nature.
[2] Huremović, D. (2019). Psychiatry of Pandemics. Springer.
[3] Udanor, C.N., Eneh, A.H. (2020). An evaluation of the frameworks for predicting of COVID-19 in Nigeria using data analytics. High Performance and Intelligent Computing, 1-18. https://doi.org/10.13140/RG.2.2.13865.01129
[4] Adesina, O.S., Adedotun, A.F., Adeboye, N.O., Adesina, T.F., Okagbue, H.I., Gboyega, A.F. (2023). On COVID-19 vaccination in Nigeria: An empirical study. International Journal of Design and Nature and Ecodynamics, 18(1): 219-224. https://doi.org/10.18280/ijdne.180128
[5] Cooper, I., Mondal, A., Antonopoulos, C.G. (2020). A SIR model assumption for the spread of COVID-19 in different communities. Chaos, Solitons & Fractals, 139: 110057. https://doi.org/10.1016/j.chaos.2020.110057
[6] Okagbue, H.I., Oguntunde, P.E., Adamu, P.I., Adejumo, A.O. (2022). Unique clusters of patterns of breast cancer survivorship. Health and Technology, 12(2): 365-384. https://doi.org/10.1007/s12553-021-00637-4
[7] Ohia, C., Bakarey, A.S., Ahmad, T. (2020). COVID-19 and Nigeria: Putting the realities in context. International Journal of Infectious Diseases, 95: 279-281. https://doi.org/10.1016/j.ijid.2020.04.062
[8] Nigeria Centre for Diease Control, NCDC. (2020). COVID-19 situation report.
[9] Jafarian, M., Abdollahi, M.R., Nathan, G.J. (2019). Preliminary evaluation of a novel solar bubble receiver for heating a gas. Solar Energy, 182: 264-277. https://doi.org/10.1016/j.solener.2019.02.027
[10] Kumar, V., Garg, M.L. (2018). Predictive analytics: A review of trends and techniques. International Journal of Computer Applications, 182(1): 31-37. https://doi.org/10.5120/ijca2018917434
[11] Wang, H., Raj, B. (2015). A survey: Time travel in deep learning space: An introduction to deep learning models and how deep learning models evolved from the initial ideas. arXiv preprint arXiv:1510.04781. http://arxiv.org/abs/1510.04781
[12] Baccar, Y.B. (2019). Comparative study on time series forecasting models. Department of Information Technologies, pp. 1-92. https://doi.org/10.13140/RG.2.2.32241.02408
[13] Papastefanopoulos, V., Linardatos, P., Kotsiantis, S. (2020). COVID-19: A comparison of time series methods to forecast percentage of active cases per population. Applied Sciences, 10(11): 3880. https://doi.org/10.3390/app10113880
[14] Isewon, I., Apata, O., Oluwamuyiwa, F., Aromolaran, O., Oyelade, J. (2022). Machine learning algorithms: Their applications in plant omics and agronomic traits’ improvement. F1000Research, 11: 1256. https://doi.org/10.12688/f1000research.125425.1
[15] Javid, A.M., Liang, X., Venkitaraman, A., Chatterjee, S. (2020). Predictive analysis of COVID-19 time-series data from Johns Hopkins University. arXiv preprint arXiv:2005.05060. https://doi.org/10.13140/RG.2.2.16162.04808
[16] Hamzah, F.B., Lau, C., Nazri, H., et al. (2020). CoronaTracker: Worldwide COVID-19 outbreak data analysis and prediction. Bull World Health Organ, 1(32): 1-32. https://doi.org/10.2471/BLT.20.255695
[17] Sengupta, S., Mugde, S., Sharma, G. (2020). COVID-19 pandemic data analysis and forecasting using machine learning algorithms. medRxiv, 2020-06. https://doi.org/10.1101/2020.06.25.20140004
[18] Arora, P., Kumar, H., Panigrahi, B.K. (2020). Prediction and analysis of COVID-19 positive cases using deep learning models: A descriptive case study of India. Chaos, Solitons & Fractals, 139: 110017. https://doi.org/10.1016/j.chaos.2020.110017
[19] Yudistira, N. (2020). COVID-19 growth prediction using multivariate long short term memory. arXiv preprint arXiv:2005.04809. https://arxiv.org/abs/2005.04809
[20] Swain, D., Vijay, V.R., Das, H., Issac, A., Stephen, S., Jacob, J. (2021). Combit response to COVID-19 pandemic in Odisha: Future public health challenges and measures. International Journal of Community Medicine and Public Health, 8(8): 979-985. https://doi.org/10.18203/2394-6040.ijcmph20210253
[21] Tutorials Point. (2015). https://tutorialspoint.dev/computer-science/machine-learning/data-cleansing-introduction.
[22] Shell, S. (2012). An introduction to Numpy and Scipy. pp. 1-24. https://sites.engineering.ucsb.edu/~shell/che210d/numpy.pdf.
[23] Melikechi, O., Young, A.L., Tang, T., Bowman, T., Dunson, D., Johndrow, J. (2022). Limits of epidemic prediction using SIR models. Journal of Mathematical Biology, 85(4): 36. https://doi.org/10.1007/s00285-022-01804-5
[24] Macal, C.M. (2010). To agent-based simulation from system dynamics. In Proceedings of the 2010 Winter Simulation Conference, Baltimore, MD, USA, pp. 371-382. https://doi.org/10.1109/WSC.2010.5679148
[25] COVID-19 Data Repository by the Center for Systems Science and Engineering (CSSE) at Johns Hopkins University. https://github.com/CSSEGISandData/COVID-19.