Anwar A. Boota*![]() | Eqbal Al-Enezi
| Eqbal Al-Enezi
© 2023 IIETA. This article is published by IIETA and is licensed under the CC BY 4.0 license (http://creativecommons.org/licenses/by/4.0/).
OPEN ACCESS
Kuwait Bay, increasingly susceptible to contamination due to urbanization and effluent discharge, serves as a focal point for environmental research. This study aims to provide a scientifically grounded assessment of sediment contamination within the bay, emphasizing the role of effluents as primary pollutants. Sediments, as repositories for both organic and inorganic pollutants, bear significant implications for marine ecosystems. A systematic sampling approach was employed at forty-six georeferenced sites across the bay, utilizing a grab sampler aboard a research vessel. The sediment samples were rigorously analyzed for inorganic geochemistry, encompassing trace elements, nutrients, and heavy metals. A comparative analysis was conducted between the trace element concentrations obtained in this study and established background levels, as well as the guidelines set forth by the United States Environmental Protection Agency (USEPA). The findings indicate a discernible level of contamination in Kuwait Bay. While the current contamination levels are classified as low, there is a pronounced risk of escalating contamination if the practice of discharging untreated effluents persists. In light of these results, the study underscores the urgent need for effluent decontamination prior to discharge into the bay. This research not only maps the spatial distribution of contaminants in Kuwait Bay but also provides a critical evaluation of potential risks to the marine environment, thereby informing future mitigation strategies. The comprehensive nature of this assessment, integrating geochemical analysis with environmental impact evaluation, marks a significant contribution to the field of marine contamination research.
effluent discharge, trace elements, nutrient analyses, contamination, heavy metals, Sulaibikhat, total carbon
Kuwait, situated in the northeastern Arabian Peninsula and a member of the Gulf Cooperation Council, is geographically positioned between latitudes 28.30° and 30.06°N, and longitudes 46.30° and 48.30°E. The country shares borders with Iraq to the north and northwest, the Arabian Gulf to the east, and the Kingdom of Saudi Arabia to the south and southwest. Spanning an area of approximately 17,818 km2, Kuwait's coastline stretches about 500 km, accounting for a significant portion of its territorial waters [1]. The region is characterized by a hyper-arid climate, with long summers and short winters. Winter, typically cold and dry, extends from December to February, with January being the coldest month, averaging 13℃ [2].
In recent years, Kuwait has undergone significant changes in its approach to waste management, transitioning from traditional methods to the establishment of wastewater treatment plants. This shift is pivotal, considering the exponential increase in waste production associated with urbanization and population growth. Inadequately treated wastewater can lead to substantial contamination, encompassing a diverse array of chemical and organic compounds stemming from anthropogenic activities. Wastewater treatment processes, depending on their efficacy, can remove a considerable amount of contaminants. However, certain recalcitrant compounds may still be discharged along with the effluent, as observed in Kuwait Bay [3]. The surge in urban development not only necessitates enhanced infrastructure for water treatment and waste disposal but also raises concerns about environmental contamination. Discharging raw wastewater into marine environments can lead to significant alterations in the water and sediment quality of coastal ecosystems, as evidenced in Kuwait Bay.
Sediments, as defined by Sediment Quality Guidelines (SQGs), are a composite of soil particles found at the bottom of water bodies, comprising clay, sand, organic material, or silt. These originate from both natural erosion and decomposition processes [4]. The discharge of raw wastewater effluents introduces a wide range of contaminants, including chemicals, organic materials, hydrocarbons, and emerging pharmaceutical pollutants. Such contaminants can interact in unforeseen ways, potentially exacerbating their toxic effects through synergistic interactions [4, 5]. The presence of metals [6], polycyclic aromatic hydrocarbons (PAHs) [7], pharmaceuticals [8], and biocides [9] in effluents is a major concern. Over time, sediments become repositories for these pollutants, posing significant risks to marine life and ecosystems. The impacts of sewage contamination on marine environments, though less studied than other environmental threats, are increasingly recognized as substantial [10]. Globally, an estimated 80% of sewage is released into the environment without adequate treatment [11]. Consequently, assessing sediment quality is crucial for understanding its impact on marine biology. This is due to several reasons: (i) the dynamic nature of lotic ecosystems receiving wastewater effluents, complicating the characterization of chemical contaminants in water; (ii) the propensity of heavy metals to adsorb onto sediments, acting as a sink for contaminants [12]; and (iii) the potential for sediments to slowly degrade or serve as secondary sources of contaminants [13, 14]. Elevated levels of heavy metals, regardless of their source, are known to exert toxic effects on marine organisms. Moreover, contaminants from treated wastewater plants have been linked to adverse impacts on benthic communities [9, 15] and ecosystem services [16].
Kuwait Bay and Khor Al-Sabiyah, prominent features in Kuwait's marine ecosystem, are significantly impacted by anthropogenic activities, leading to various forms of contamination. Industrial activities, power and desalination plants, and effluents from the Shatt-Al-Arab River contribute to making Kuwaiti waters a challenging environment for marine life. Common pollutants in Kuwait Bay include total petroleum hydrocarbons (TPHs), trace elements (Cu, Cd, Hg), and sewage contamination [17, 18]. These ecosystems are crucial for Kuwait’s marine productivity, contributing approximately 40-50% of the country's food demand [19]. The identification of benthic sediments, based on morphology, is a labor-intensive, costly, and time-consuming process requiring specialized expertise [20, 21]. Nonetheless, standard laboratory analyses remain the most valid method for assessing contamination and predicting its impact on marine biota. Research focusing on benthic foraminiferal occurrence in Kuwait has been undertaken [22, 23], with previous studies identifying foraminifera as potential bio-indicators of contamination [24, 25]. However, comprehensive analyses of benthic sediments in the Arabian Gulf, particularly in Kuwaiti coastal areas, are still limited.
It is established that the nitrogenous component of organic matter in sediments is partially regenerated as ammonia, which is then oxidized to nitrate in sediments possessing a positive Redox Potential (Eh) and in the overlying water [26, 27]. Phosphate regeneration is most intense in anaerobic sediments, with local net deposition occurring in aerobic sediments of low pH. Dissolved silicate concentrations increase with depth in all sediments. The water immediately overlying the sediment surface is enriched with these nutrients where active regeneration occurs in the sediment. However, the return of nutrients from sediment to water accounts for less than 1% of the annual consumption by phytoplankton. The availability of these nutrients is directly or indirectly fundamental to all life forms.
Addressing the research gap in sediment pollutant analysis in Kuwait Bay, the current study aims to analyze the presence of chemical contamination in 46 spatially distributed sediment samples, focusing on areas known to be polluted. A multidisciplinary and integrated approach was employed, combining physicochemical analyses of water with organic and inorganic geochemistry, alongside sediment characteristics, to ascertain sediment quality. The primary objectives are to characterize the physicochemical conditions of the sediments and assess contamination levels and nutrient availability therein.
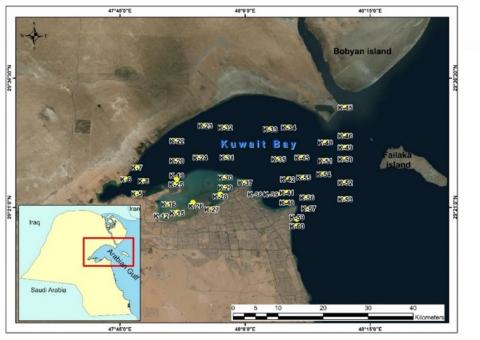
The focus of this study is Kuwait Bay, as depicted in Figure 1. The bay was selected due to its proximity to Kuwait City and its direct exposure to effluent discharge, posing a potential threat to the marine environment over time. The Kuwaiti coastline is delineated into northern and southern provinces. Along the coast, tidal patterns are predominantly semidiurnal to mixed in the northern sector and transition to diurnal in the south, with a mean tidal range of approximately 3 meters (mesotidal). The offshore areas, particularly in the north, are characterized by their shallow nature, which constrains the generation of significant wave activity along the shoreline. A marked seasonal variation in temperature is observed, with differences exceeding 20℃ between summer and winter. Summer temperatures can reach up to 36℃, with salinity levels surpassing 45 parts per thousand (PPT) [28]. Previous literature reviews have highlighted extensive research on sediment contamination in terrestrial environments due to wastewater effluents [29-31]. However, the impact on marine sediments, a crucial ecological component, has been relatively under investigated in terms of wastewater effluent as a source of environmental hazard and contamination.
Kuwait Bay is particularly susceptible to contamination from sewage discharge and various anthropogenic activities, rendering the seawater less conducive to marine life. In light of Kuwait Bay's exposure to these contaminants, sampling was conducted at multiple locations within the bay, as shown in Figure 1.
Figure 1. Sampling locations in the Kuwait Bay
It is hypothesized that wastewater serves as a primary vector for transporting a wide range of contaminants to both seawater and sediments. This study was undertaken to investigate the potential of effluent discharge to contaminate the sediment, and to determine the extent of contamination, whether it be high or low level.
In November 2018, a comprehensive sampling campaign was conducted in Kuwait Bay. A total of 46 sites were sampled using the KISR research vessel as a platform for collecting surface sediment samples and measuring various physicochemical parameters. The locations of all sampling sites, including the Sulaibikhat Bay and areas known for high contamination such as Al Ghazali, Salmiya, Al Bedaa, Al Messela, and the Shatt Al-Arab Delta, were georeferenced and illustrated in Figure 1. These sites were strategically chosen to explore variations in sediment quality across different locations and bathymetric depths.
Surface sediment samples were collected using a grab sampler, a marine geological sampling tool. Utmost care was taken to ensure the samples were undisturbed, critical for quantitative analysis. From each site, only the uppermost 1cm of sediment was collected. The collected samples were then subjected to inorganic geochemistry analyses, focusing on trace elements.
The sediment samples were analyzed for organic matter (OM), total carbon (TC), total nitrogen (TN), and total organic carbon (TOC) contents. TC and TN concentrations were determined using the Dynamic Flash Combustion Technique (Thermo Flash 2000 EA1112 Elemental Analyzer), while TOC was measured via the modified Walkley-Black method (Mebius method). For inorganic geochemistry, the fine fraction (<63 μm) of the sediment was digested using the USEPA 3050A method, followed by trace metal analysis using inductively coupled plasma-optical emission spectroscopy (ICP-OES, iCAP 6000, Thermo Scientific). Concurrently, water samples were analyzed for TPH content as per the USEPA 8440 method. All analyses were conducted in the laboratories of the Kuwait Institute for Scientific Research, utilizing standard methods recognized globally. Quality assurance and control were emphasized through blank runs and triplicate analysis of each sample.
This section presents the findings of the current study, elucidated through various tables and figures.
5.1 Contaminants in wastewater effluents discharged to the sea
It has been established that raw wastewater effluents typically contain contaminants, including metals, pathogens, hydrocarbons, and pharmaceuticals, at concentrations exceeding acceptable levels. Following treatment, these contaminants are significantly reduced, though traces remain unless advanced combined treatment techniques are employed. The effluent discharged into the sea with minimal treatment mirrors the composition of raw sewage in terms of contaminant levels [32]. It is recognized that contaminants tend to adsorb onto both the organic fraction and the mineral components of the sediments [33, 34].
5.2 Nutrients and chemical analyses of seawater samples
Table 1. Mean, standard deviation, min and max values in water samples
|
Parameters |
n |
Mean |
SD |
Minimum |
Maximum |
|
Depth [m] |
46 |
6.4 |
6.7 |
1.0 |
29.9 |
|
Temperature [℃] |
46 |
17.3 |
3.6 |
12.9 |
24.3 |
|
EC [μS/cm] |
46 |
64338 |
1345 |
61797 |
66801 |
|
Density [kg/m3] |
46 |
1031 |
1.0 |
1029 |
1033 |
|
pH |
46 |
7.4 |
0.6 |
7.0 |
8.6 |
|
NO3 (mg/L) |
43 |
0.023 |
0.024 |
0.002 |
0.090 |
|
NO2 (mg/L) |
43 |
0.028 |
0.024 |
0.004 |
0.100 |
|
NH3 (mg/L) |
43 |
0.061 |
0.033 |
0.020 |
0.170 |
|
PO4 (mg/L) |
43 |
1.098 |
0.285 |
0.720 |
1.880 |
|
SiO2 (mg/L) (LR) |
43 |
0.615 |
0.234 |
0.212 |
1.230 |
|
T.S.S (mg/L) |
43 |
23.6 |
11.8 |
10.0 |
69.0 |
|
TPH (mg/L) |
34 |
2.7 |
2.2 |
0.5 |
9.3 |
|
V (mg/L) |
44 |
57.2 |
16.8 |
4.1 |
74.2 |
|
Zn (mg/L) |
44 |
33.7 |
13.2 |
3.4 |
73.0 |
|
Al (mg/L) |
44 |
4.6 |
1.6 |
0.4 |
6.9 |
|
Fe (mg/L) |
44 |
2.7 |
0.9 |
0.2 |
3.9 |
|
TN (mg/l) |
45 |
0.1 |
0.0 |
0.0 |
0.2 |
|
TC (mg/L) |
45 |
5.3 |
1.0 |
4.2 |
10.4 |
|
TOC (mg/L) |
45 |
0.5 |
0.3 |
0.1 |
1.5 |
n = number of samples; SD = standard deviation
Water samples from 46 sites in Kuwait Bay exhibited variability in physicochemical parameters. The analyses focused on parameters such as electrical conductivity, pH, TOC, TPH, nutrients, and density. Table 1 summarizes the mean, minimum, maximum values, and standard deviation (SD) for each parameter. The pH of water samples ranged from 7.0 to 8.6, categorizing the water from neutral (6.6 to 7.3) to moderately alkaline (7.9 to 8.5), with a few samples reaching up to 8.6. The highest pH levels were recorded in the northern central region of Kuwait Bay. Electrical conductivity exhibited a narrow range (61.7 × 10³ to 66.8 × 10³ µS/cm), with the highest values observed in the outer part of the bay. Consistent water density was noted at 1.03 tons per cubic meter. The mean concentrations of TPH and TOC were 2.7 mg/L and 0.5 mg/L, respectively.
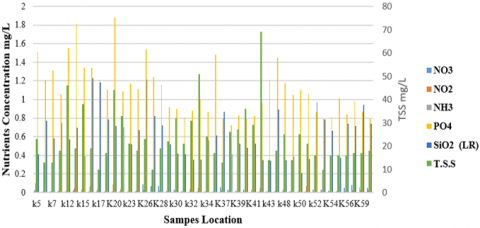
Figure 2 illustrates the nutrient concentrations in seawater samples, with phosphate contents being the highest among the nutrients, reaching levels up to 1.9 mg/L in certain samples. Elevated phosphate levels could result from external loads (discharged effluent) and retention in sediments due to transport, microbial, and chemical processes, including occlusion in calcium carbonates and the formation of authigenic minerals [35]. The nitrogen cycle review indicates that under reduced conditions, ammonia is the only nitrogenous compound that can enter the water from the sediment, whereas nitrite, nitrate, and molecular nitrogen can originate from sediments [26].
Figure 2. Nutrient concentrations in seawater
5.3 Sediments analyses
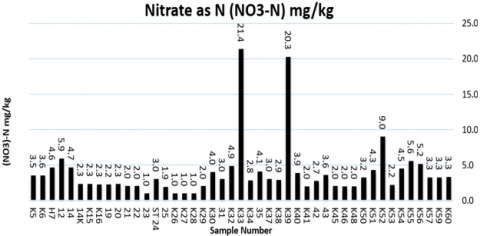
The arid climate and limited water resources in the region necessitate the desalination of seawater for public use. This process, however, contributes to an increase in both the temperature and salinity of the water returned to the sea. In the aftermath of the 1991 Gulf War, research efforts were intensified to evaluate the heightened levels of contamination in water and sediments. Consequently, a baseline for metal contamination was established, with ranges specified as follows: Zn (30-60 mg/kg), Pb (15-30 mg/kg), Cd (1.2-2.0 mg/kg), Ni (70-80 mg/kg), Mn (300-600 mg/kg), Fe (10,000-20,000 mg/kg), V (20-30 mg/kg), and Cu (15-30 mg/kg) [36]. In the analyzed sediment samples, as depicted in Figure 3, the concentration of ammonia varied significantly, ranging from 539.2 mg/kg in sample K-52 to 953.0 mg/kg in sample K-45. The concentration of nitrates (including nitrites) exhibited a range from 1.0 mg/kg in sample K-26 to 21.4 mg/kg in sample K-33. It was observed that in most samples, nitrate levels fluctuated between 1.0 to 9.0 mg/kg, with only two samples displaying notably higher values.
Figure 4 illustrates the nitrate concentrations (mg/kg) in the sediment samples from Kuwait Bay. Figure 5 displays the phosphate concentrations in sediment samples from Kuwait Bay.
The analysis of total phosphates, quantified as phosphorus (P), showed a range from 95.6mg/kg in sample K-25 to 1,072.7mg/kg in sample K-42, as shown in Figure 5. An overall assessment of phosphorus values indicated a range from 95.6 to 681.3mg/kg, with one sample (K-42) identified as an outlier (1,072.7mg/kg).
Figure 3. Ammonia concentration in the sediments from Kuwait Bay
Figure 4. Nitrate concentration (mg/kg) in the sediments from Kuwait Bay
Figure 5. Phosphate concentration in the sediments from Kuwait Bay
5.3.1 Trace metals concentrations in the sediments of Kuwait Bay
Trace metal concentrations in the sediment samples from Kuwait Bay were quantified, as shown in Table 2. The analysis revealed varying levels of different metals. Arsenic and cobalt were detected in a limited number of samples, while mercury was not detected in any samples. The observed concentrations of chromium (2.3-70.6 mg/kg), nickel (0-32.2 mg/kg), copper (0-40.2 mg/kg), iron (2,000-39,000 mg/kg), lead (0-33 mg/kg), vanadium (4.1-74.2 mg/kg), and aluminum (4,000-69,000 mg/kg) were all below the toxic effect thresholds (TET). The TET levels for various elements are as follows: chromium 100 mg/kg, nickel 61 mg/kg, copper 86 mg/kg, lead 170 mg/kg, and zinc 540 mg/kg.
A significant contribution to marine environmental contamination was observed following the breakdown of the Mishref pumping station in August 2009, which led to the discharge of 150,000 m3 of untreated sewage directly into the sea each day for over 24 months. A comparative study conducted in the Black Sea [37] reported the highest metal concentrations in sediments from eight stations ranging from 4.97 to 29.65 mg/kg for nickel; 7.57–44.14 mg/kg for chromium; 9.84–42.76 mg/kg for copper; and 48.08–103.77 mg/kg for zinc. The study concluded that the pollutant sources indicated a clear anthropogenic impact on the discharge environments. The results of the current study show higher concentrations of chromium and lower concentrations of zinc compared to the Black Sea study, attributable to differences in geographical location and contamination sources. However, both studies indicate sediment contamination at varying levels [37].
The discharge affected an approximate 20 km stretch of the coastal area. Preliminary data indicate that several areas within the Sulaibikhat Bay were impacted by relatively high values of trace elements due to various anthropogenic activities. The concentrations of trace elements, as presented in Table 2, were compared with international standard sediment guidelines, such as those established by the U.S. Environmental Protection Agency [38], detailed in Tables 3 and 4.
Table 2. Trace element content in sediment of the Kuwait Bay
|
S. No. |
As |
Cd |
Co |
Cr |
Cu |
Ni |
Pb |
V |
Zn |
Al |
Fe |
|
mg/kg |
% |
||||||||||
|
K42 |
ND |
0.42 |
0.0 |
59.9 |
11.7 |
23.0 |
29.9 |
65.0 |
39.3 |
5.7 |
3.8 |
|
K43 |
ND |
0.38 |
0.0 |
58.7 |
10.7 |
23.8 |
27.6 |
66.6 |
35.7 |
5.4 |
3.2 |
|
K35 |
ND |
0.42 |
0.0 |
62.7 |
12.2 |
26.9 |
29.9 |
68.4 |
38.2 |
5.9 |
3.5 |
|
K31 |
ND |
0.32 |
1.9 |
70.6 |
12.0 |
32.2 |
24.5 |
74.2 |
43.8 |
5.4 |
3.3 |
|
K24 |
ND |
0.33 |
0.1 |
60.6 |
20.1 |
27.1 |
22.3 |
66.9 |
41.7 |
6.6 |
3.8 |
|
K22 |
ND |
0.27 |
2.3 |
64.5 |
9.7 |
28.8 |
20.9 |
66.6 |
38.8 |
5.3 |
3.2 |
|
K21 |
ND |
0.30 |
0.0 |
55.7 |
10.6 |
21.7 |
22.8 |
62.3 |
33.5 |
6.3 |
3.7 |
|
K20 |
ND |
0.38 |
0.5 |
57.2 |
17.5 |
26.4 |
24.2 |
62.8 |
40.1 |
5.3 |
3.1 |
|
K19 |
ND |
0.42 |
0.0 |
60.5 |
19.8 |
26.6 |
24.3 |
67.5 |
47.0 |
6.9 |
3.9 |
|
K14 |
ND |
0.36 |
1.1 |
60.6 |
22.9 |
27.4 |
25.1 |
66.7 |
54.5 |
5.7 |
3.3 |
|
K5 |
ND |
0.33 |
0.0 |
54.0 |
18.8 |
19.6 |
25.2 |
63.5 |
50.4 |
4.9 |
2.7 |
|
K6 |
ND |
0.36 |
0.0 |
55.2 |
10.1 |
22.3 |
27.2 |
63.3 |
32.6 |
5.1 |
3.0 |
|
K12 |
ND |
0.29 |
0.0 |
54.3 |
18.7 |
20.6 |
23.8 |
59.3 |
45.9 |
4.3 |
2.4 |
|
K14 |
ND |
0.37 |
0.2 |
52.7 |
25.8 |
22.6 |
33.0 |
59.1 |
68.2 |
4.9 |
2.7 |
|
K15 |
ND |
0.19 |
5.5 |
55.8 |
15.6 |
30.8 |
0.0 |
57.2 |
42.6 |
6.8 |
3.5 |
|
K16 |
ND |
0.39 |
1.2 |
60.5 |
35.4 |
28.2 |
28.5 |
68.5 |
62.0 |
6.2 |
3.6 |
|
K7 |
ND |
0.40 |
0.0 |
61.0 |
13.8 |
26.2 |
28.5 |
68.3 |
36.2 |
6.1 |
3.7 |
|
K25 |
ND |
0.00 |
0.2 |
12.4 |
4.0 |
3.7 |
0.0 |
15.8 |
11.2 |
1.4 |
0.9 |
|
K53 |
ND |
0.32 |
0.0 |
53.9 |
10.2 |
21.1 |
22.4 |
59.6 |
31.2 |
5.3 |
3.1 |
|
K52 |
ND |
0.19 |
4.9 |
51.3 |
7.1 |
26.7 |
0.0 |
53.2 |
25.2 |
4.4 |
2.5 |
|
K46 |
ND |
0.30 |
0.0 |
54.4 |
8.9 |
16.9 |
25.3 |
59.5 |
27.2 |
4.6 |
2.7 |
|
K48 |
ND |
0.27 |
0.0 |
54.7 |
7.2 |
18.3 |
26.4 |
61.2 |
25.9 |
6.3 |
3.4 |
|
K50 |
ND |
0.11 |
1.9 |
54.5 |
3.6 |
18.3 |
16.5 |
53.5 |
22.1 |
4.8 |
2.7 |
|
K32 |
ND |
0.38 |
0.0 |
59.8 |
11.2 |
22.9 |
27.3 |
66.2 |
34.3 |
5.6 |
3.5 |
|
K33 |
ND |
0.35 |
0.0 |
60.0 |
14.2 |
24.0 |
24.5 |
66.7 |
37.5 |
5.3 |
3.0 |
|
K51 |
ND |
0.17 |
5.2 |
52.2 |
5.8 |
26.0 |
0.0 |
54.4 |
23.4 |
5.0 |
2.8 |
|
K55 |
ND |
0.33 |
2.1 |
71.0 |
10.1 |
32.1 |
24.9 |
73.5 |
39.4 |
5.6 |
3.4 |
|
K56 |
ND |
0.37 |
0.0 |
45.4 |
9.1 |
15.7 |
25.5 |
52.1 |
31.4 |
3.9 |
2.4 |
|
K59 |
ND |
0.00 |
0.0 |
23.1 |
2.1 |
1.6 |
9.8 |
23.6 |
17.9 |
1.6 |
1.0 |
|
K54 |
ND |
0.29 |
1.3 |
67.9 |
8.3 |
26.0 |
25.6 |
66.9 |
30.1 |
5.3 |
3.3 |
|
K45 |
ND |
0.36 |
0.0 |
58.4 |
8.7 |
22.0 |
27.4 |
65.7 |
31.2 |
3.8 |
2.2 |
|
K60 |
ND |
0.26 |
0.0 |
48.4 |
10.2 |
16.5 |
23.3 |
52.3 |
30.9 |
4.2 |
2.6 |
|
K57 |
1.33 |
0.00 |
0.0 |
2.3 |
0.0 |
0.0 |
15.5 |
4.4 |
3.4 |
0.4 |
0.3 |
|
K34 |
ND |
0.31 |
0.2 |
60.0 |
8.5 |
23.3 |
23.4 |
65.2 |
32.4 |
5.0 |
3.0 |
|
K23 |
ND |
0.33 |
5.1 |
57.8 |
10.1 |
22.4 |
0.0 |
64.8 |
30.2 |
3.7 |
2.2 |
|
K29 |
ND |
0.32 |
5.6 |
60.1 |
13.9 |
24.9 |
0.0 |
65.1 |
38.3 |
4.8 |
2.8 |
|
K40 |
ND |
0.20 |
4.1 |
47.8 |
7.4 |
15.6 |
2.3 |
53.8 |
25.1 |
3.1 |
1.7 |
|
K37 |
ND |
0.13 |
2.0 |
31.3 |
4.8 |
6.1 |
0.0 |
36.0 |
18.9 |
2.3 |
1.2 |
|
K41 |
ND |
0.28 |
6.2 |
62.7 |
12.9 |
26.2 |
0.0 |
67.4 |
35.0 |
4.4 |
2.5 |
|
K27 |
ND |
0.36 |
5.3 |
56.8 |
40.1 |
24.8 |
0.0 |
66.1 |
73.0 |
3.9 |
2.6 |
|
K28 |
ND |
0.29 |
5.7 |
57.6 |
15.6 |
25.7 |
0.4 |
65.1 |
39.4 |
4.4 |
2.6 |
|
K39 |
ND |
0.24 |
6.2 |
58.0 |
11.0 |
26.0 |
0.2 |
63.5 |
34.0 |
3.8 |
2.4 |
|
K30 |
ND |
0.11 |
1.5 |
27.5 |
4.8 |
4.7 |
0.0 |
32.0 |
16.0 |
2.1 |
1.1 |
|
K38 |
ND |
0.27 |
4.7 |
51.3 |
13.1 |
20.2 |
0.0 |
57.2 |
30.8 |
3.3 |
1.9 |
|
K26 |
ND |
0.06 |
0.0 |
4.8 |
0.9 |
0.0 |
0.0 |
4.1 |
4.6 |
0.6 |
0.2 |
Table 3. The lowest and the highest levels of metals in sediments at different locations
|
Metal |
Lowest Value (mg/kg) |
Location (Sample No.) |
Highest Value (mg/kg) |
Location (Sample No.) |
|
Arsenic (As) |
0 |
K42 |
1.334 |
K57 |
|
Cadmium (Cd) |
0 |
K25 |
0.42 |
K19 |
|
Cobalt (Co) |
0 |
K42 |
6.20 |
K39 |
|
Chromium (Cr) |
2.3 |
K57 |
71.0 |
K55 |
|
Copper (Cu) |
0 |
K57 |
40.1 |
K27 |
|
Nickel (Ni) |
0 |
K57 |
32.2 |
K31 |
|
Lead (Pb) |
0 |
K15 |
33.0 |
K14 |
|
Vanadium (V) |
4.1 |
K26 |
74.2 |
K31 |
|
Zinc (Zn) |
3.4 |
K57 |
73.0 |
K27 |
|
Aluminum (Al) |
4000 |
K57 |
69,000 |
K19 |
|
Iron (Fe) |
2000 |
K26 |
39,000 |
K19 |
Table 4. Mean, min and max values of trace element concentrations in sediments and international sediment guidelines
|
Parameters |
As |
Cd |
Co |
Cr |
Cu |
Ni |
Pb |
V |
Zn |
Al |
Fe |
|
|
mg/kg |
% |
|||||||||
|
mean |
0.029 |
0.28 |
1.8 |
52.4 |
12.2 |
21.1 |
16.1 |
57.5 |
34.4 |
4.6 |
2.7 |
|
min |
0.000 |
0.00 |
0.0 |
2.3 |
0.0 |
0.0 |
0.0 |
4.1 |
3.4 |
0.4 |
0.2 |
|
max |
1.334 |
0.42 |
6.2 |
71.0 |
40.1 |
32.2 |
33.0 |
74.2 |
73.0 |
6.9 |
3.9 |
|
TEL (threshold effect Level) |
5.90 |
0.60 |
n. a. |
37.3 |
35.7 |
18.0 |
35.0 |
n. a. |
123.0 |
n. a. |
n. a. |
|
ERL (effect range low) |
33.0 |
5.00 |
n. a. |
80.0 |
70.0 |
30.0 |
35.0 |
n. a. |
120 |
n. a. |
n. a. |
|
LEL (lowest effect level) |
6.0 |
0.6 |
n. a. |
26.0 |
16.0 |
16.0 |
31.0 |
n. a. |
120 |
n. a. |
n. a. |
|
PEL (probable effect level) |
17.0 |
3.53 |
n. a. |
90.0 |
197 |
36.0 |
91.3 |
n. a. |
315 |
n. a. |
n. a. |
|
ERM (effect range median) |
85.0 |
9.0 |
n. a. |
145 |
390 |
50.0 |
110 |
n. a. |
270 |
n. a. |
n. a. |
|
TET (toxic effect threshold) |
17.0 |
3.0 |
n. a. |
100 |
86.0 |
61.0 |
170 |
n. a. |
540 |
n. a. |
n. a. |
|
SEL (severe effect level) |
33.0 |
10.0 |
n. a. |
110 |
110 |
75.0 |
250 |
n. a. |
820 |
n. a. |
n. a. |
n. a.= not available
5.3.2 TC, TN, and TOC in sediments of Kuwait Bay
Table 5 presents the analyses of sediment samples for nitrogen and carbon content. The TC content ranged between 4.18% and 10.43%, while TN varied from 0.024% to 0.227%. The carbon to nitrogen ratio (C/N) varied, with the highest values recorded in the innermost parts of the bay, ranging from 1.64 to 6.67.
Table 5. TC, TN and TOC in sediments of Kuwait Bay
|
Sample No. |
TN (%) |
TC (%) |
Mean TC (%) |
TOC (%) |
*C/N |
|
K5 |
0.227 |
5.417 |
5.376 |
1.426 |
6.28 |
|
K5D |
0.222 |
5.335 |
1.427 |
6.43 |
|
|
K6 |
0.097 |
4.955 |
4.989 |
0.551 |
5.68 |
|
K6D |
0.088 |
5.023 |
|
||
|
H7 |
0.123 |
4.899 |
4.888 |
0.688 |
5.43 |
|
H7D |
0.124 |
4.878 |
|
||
|
K12 |
0.157 |
4.700 |
4.695 |
0.742 |
4.73 |
|
K12D |
0.138 |
4.690 |
|
||
|
K14 |
0.198 |
4.860 |
4.833 |
1.037 |
5.24 |
|
K14D |
0.200 |
4.806 |
|
||
|
K14R |
0.218 |
3.951 |
4.181 |
1.455 |
6.67 |
|
K14RD |
0.221 |
4.411 |
|
||
|
K15 |
0.149 |
4.631 |
4.617 |
0.959 |
6.44 |
|
K15D |
0.147 |
4.603 |
|
||
|
K16 |
0.185 |
4.646 |
4.680 |
0.816 |
4.41 |
|
K16D |
0.191 |
4.714 |
|
||
|
19 |
0.190 |
4.742 |
4.677 |
0.875 |
4.61 |
|
19D |
0.172 |
4.612 |
|
||
|
20 |
0.156 |
4.619 |
4.655 |
0.787 |
5.04 |
|
20D |
0.159 |
4.692 |
|
||
|
21 |
0.130 |
5.019 |
4.997 |
0.494 |
3.80 |
|
21D |
0.111 |
4.976 |
|
||
|
22 |
0.093 |
4.952 |
4.975 |
0.365 |
3.92 |
|
22D |
0.095 |
4.998 |
|
||
|
K23 |
0.096 |
4.767 |
4.861 |
0.383 |
3.99 |
|
K23D |
0.098 |
4.955 |
|
||
|
24 |
0.169 |
4.657 |
4.668 |
0.646 |
3.82 |
|
24D |
0.173 |
4.679 |
|
||
|
K25 |
0.086 |
10.546 |
10.429 |
0.175 |
2.03 |
|
K25D |
0.096 |
10.313 |
|
||
|
K26 |
0.087 |
4.718 |
5.462 |
0.218 |
2.51 |
|
K26D |
0.085 |
6.207 |
|
||
|
K27 |
0.203 |
5.053 |
4.923 |
0.889 |
4.38 |
|
K27D |
0.209 |
4.794 |
|
||
|
K28 |
0.132 |
4.643 |
4.677 |
0.566 |
4.29 |
|
K28D |
0.128 |
4.711 |
|
||
|
K29 |
0.131 |
4.952 |
4.906 |
0.533 |
4.07 |
|
K29D |
0.120 |
4.861 |
|
||
|
K30 |
0.067 |
6.670 |
6.054 |
0.225 |
3.36 |
|
K30D |
0.064 |
5.439 |
|
||
|
31 |
0.131 |
4.825 |
4.840 |
0.551 |
4.21 |
|
31D |
0.132 |
4.854 |
|
||
|
K32 |
0.106 |
4.828 |
4.769 |
0.429 |
4.05 |
|
K32D |
0.103 |
4.710 |
|
||
|
K33 |
0.098 |
4.980 |
4.899 |
0.321 |
3.28 |
|
K33D |
0.088 |
4.819 |
|
||
|
K34 |
0.072 |
5.194 |
5.145 |
0.231 |
3.21 |
|
K34D |
0.075 |
5.096 |
|
||
|
35 |
0.107 |
5.019 |
5.011 |
0.383 |
3.53 |
|
35D |
0.099 |
5.003 |
|
||
|
K37 |
0.084 |
6.619 |
6.611 |
0.273 |
3.25 |
|
K37D |
0.079 |
6.604 |
|
||
|
K38 |
0.108 |
5.503 |
5.801 |
0.347 |
3.21 |
|
K38D |
0.093 |
6.099 |
|
||
|
K39 |
0.105 |
5.150 |
5.162 |
0.402 |
3.83 |
|
K39D |
0.102 |
5.174 |
|
||
|
K40 |
0.073 |
4.868 |
4.945 |
0.312 |
4.27 |
|
K40D |
0.087 |
5.022 |
|
||
|
K41 |
0.096 |
4.797 |
4.804 |
0.410 |
4.27 |
|
K41D |
0.096 |
4.810 |
|
||
|
42 |
0.111 |
5.040 |
5.246 |
0.320 |
2.88 |
|
42D |
0.096 |
5.452 |
|
||
|
43 |
0.084 |
5.024 |
5.079 |
0.301 |
3.58 |
|
43D |
0.083 |
5.134 |
|
||
|
K45 |
0.058 |
5.054 |
5.043 |
0.259 |
4.47 |
|
K45D |
0.065 |
5.032 |
|
||
|
K46 |
0.058 |
5.194 |
5.172 |
0.214 |
3.69 |
|
K46D |
0.061 |
5.150 |
|
||
|
K48 |
0.058 |
4.979 |
5.013 |
0.214 |
3.69 |
|
K48D |
0.060 |
5.047 |
|
||
|
K50 |
0.052 |
5.040 |
5.039 |
0.231 |
4.44 |
|
K50D |
0.052 |
5.037 |
|
||
|
K51 |
0.058 |
5.071 |
5.088 |
0.214 |
3.69 |
|
K51D |
0.055 |
5.105 |
|
||
|
K52 |
0.068 |
5.143 |
5.149 |
0.259 |
3.81 |
|
K52D |
0.066 |
5.154 |
|
||
|
K53 |
0.070 |
5.180 |
5.171 |
0.354 |
5.06 |
|
K53D |
0.069 |
5.162 |
|
||
|
K54 |
0.061 |
5.212 |
5.210 |
0.284 |
4.66 |
|
K54D |
0.059 |
5.209 |
|
||
|
K55 |
0.088 |
5.007 |
5.048 |
0.319 |
3.62 |
|
K55D |
0.092 |
5.088 |
|
||
|
K56 |
0.081 |
5.542 |
5.877 |
0.235 |
2.90 |
|
K56D |
0.079 |
6.213 |
|
||
|
K57 |
0.024 |
7.208 |
7.408 |
0.056 |
2.33 |
|
K57D |
0.028 |
7.608 |
|
||
|
K59 |
0.077 |
6.865 |
7.006 |
0.126 |
1.64 |
|
K59D |
0.075 |
7.146 |
|
||
|
K60 |
0.103 |
5.179 |
5.198 |
0.380 |
3.69 |
|
K60D |
0.094 |
5.216 |
|
* TOC is used for C/N calculation.
The detection of trace elements in the sediments of Kuwait Bay suggests potential threats to marine fauna from contamination sources such as industries, desalination, power plants, and the influx from the Shatt Al-Arab. The sediment analysis plays a pivotal role in assessing environmental quality within the bay [1]. Trace metals were found in all sediment samples at concentrations below toxic effect thresholds (TET), indicating current contamination levels are low. However, continual effluent discharge could escalate these levels, potentially impacting marine fauna. Despite the low contamination levels, effluents are identified as potential sources of seawater and sediment contamination, necessitating effective mitigation strategies [39]. It has been observed in previous studies [40, 41] that industrial effluent discharge significantly increases metal concentrations in recipient ecosystems, such as Kuwait Bay. The metal concentration is influenced by the metal abundance in the influents. For instance, effluent discharge into Kuwait Bay, possibly low in metal abundance, may cause sediments to exhibit low to moderate levels of contamination, remaining below TET levels.
Trace elements are inherently present in both sediment and seawater. In this study, trace element concentrations were found to be higher in sediment compared to the water column, indicating sediment's role as a reservoir for these elements [42]. The concentrations of cadmium (Cd), mercury (Hg), and arsenic (As) were below the detection limits. Nickel (Ni) concentrations exceeded the Effect Range Low (ERL) levels as per the guidelines of the USEPA [38]. Other trace elements, including chromium (Cr), copper (Cu), nickel (Ni), and lead (Pb), exhibited values higher than Threshold Effect Levels (TEL), which are below concentrations known to adversely affect marine biota. Marine contamination in shallow embayments presents significant hazards to human and marine health [43].
In this context, vanadium (V) and chromium (Cr) displayed the highest concentrations. Oil slicks from the northwestern part of the Gulf and seepage from power-generation plants are postulated as sources of elevated vanadium levels [44]. Chromium likely originates from increasing industrial and developmental activities, with prior studies also reporting high Cr concentrations in Sulaibikhat Bay [25, 45]. Comparing the trace element concentrations from this study with USEPA guidelines suggests a gradual contamination of Kuwait Bay.
The study's findings indicate that trace elements (Al, V, Ni, Cr, Fe, Pb, Zn, and Cu), along with TOC, TN, and salinity, are predominant factors in the bay's sediment. These results correlate with the negative impact of both organic matter and trace element concentration on the morphospecies diversity and organic matter content on the molecular diversity of benthic foraminifera [21]. Thus, these trace elements and organic compounds are instrumental in shaping the biology of Kuwait Bay's sediments. A related study [21] demonstrated that certain foraminifera species (Ammonia cf. parkinsoniana, A. convexa, and Q. parakneriana) exhibited positive correlations with TOC, TN, and salinity. In contrast, other species (A. agglutinans, A. inflata, Q. bubyanensis, and A. dentata) showed negative correlations with these environmental variables. Most porcelaneous taxa were adversely affected by inorganic enrichment.
This study has highlighted that the sediment contamination in Kuwait Bay ranges from low to moderate levels. Without intervention, the contamination is likely to intensify over time due to continuous effluent discharge into the bay and additional input from the Shatt Al-Arab. While controlling contamination from external sources such as the Shatt Al-Arab may be challenging, mitigating effluent discharge from within Kuwait is feasible. A viable solution involves rerouting effluent away from discharge points directly into liquid waste treatment plants for decontamination and chemical neutralization [46]. Implementing this measure would maintain sediment contamination levels below the TEL. This process allows for the precipitation and isolation of contaminants from effluents before their release into the sea. Consequently, consideration of sediment contamination is crucial in establishing operational benchmarks for wastewater treatment plants (WWTPs), which often focus primarily on effluent composition. This current practice may lead to either overestimation or underestimation of the long-term impact of effluent discharge on recipient waterways, including sea sediments [47]. Post-treatment, some level of contamination remains in the water, potentially impacting the ecosystem [48]. The complete removal of contaminants in a WWTP is an energy-intensive process. While tertiary treatment still leaves some contaminants in the water, the incorporation of ozonation into the system can significantly enhance contaminant removal, though it increases energy consumption by 40-50% [49]. Utilizing combined multiple removal methods could further enhance contaminant elimination [50-52]. However, the cost-benefit analysis of such an extensive treatment process may not be feasible for developing countries. In contrast, energy-rich nations, such as those within the Gulf Cooperation Council, might find this approach more viable.
This study, focused on evaluating the contamination levels in Kuwait Bay, Kuwait, employed a multidisciplinary approach integrating water parameters, nutrients, and sediment characteristics. The comparison of trace element concentrations in this study with background levels and the guidelines set by the USEPA suggests that contamination levels in Kuwait Bay are relatively low. Nevertheless, the presence of contaminants in discharged effluent emerged as potential environmental threats, highlighting the need for establishing stringent discharge regulatory benchmarks aimed at environmental protection. It was observed that the central part of Kuwait Bay is the most affected area, with significant variations in sediment quality across different sampling locations. These variations are attributed to differing quantities of organic matter, trace metals, and hydrocarbon contamination. The study concludes that most of the coastal and offshore marine environment in Kuwait Bay is subject to low to moderate levels of contamination. Furthermore, it suggests that SQGs developed for other regions may not be entirely applicable to the Gulf region, particularly regarding metal concentrations due to naturally high background levels in sediments.
The findings of this research provide a foundational framework for environmental monitoring and contamination control programs to assess the long-term effects of effluent discharge on sediments and marine populations. The results should serve as a baseline reference for future monitoring studies, particularly concerning marine sewage outfalls in Kuwait Bay. Continued monitoring is essential to understanding the evolving environmental impact and guiding effective management and mitigation strategies.
[1] Al-Enezi, E., Khader, S., Balassi, E., Frontalini, F. (2020). Modern benthic foraminiferal diversity: an initial insight into the total foraminiferal diversity along the Kuwait coastal water. Diversity, 12(4): 142. https://doi.org/10.3390/d12040142
[2] Geography of Kuwait. https://www.thoughtco.com/geography-of-kuwait-1435081.
[3] Lishman, L., Smyth, S.A., Sarafin, K., Kleywegt, S., Toito, J., Peart, T., Lee, B., Servos, M., Beland, M., Seto, P. (2006). Occurrence and reductions of pharmaceuticals and personal care products and estrogens by municipal wastewater treatment plants in Ontario, Canada. Science of the Total Environment 367: 544-558. https://doi.org/10.1016/j.scitotenv.2006.03.021
[4] Kienle, C., Vermeirssen, E.L.M., Schifferli, A., Singer, H., Stamm, C., Werner, I. (2019). Effects of treated wastewater on the ecotoxicity of small streams - unravelling the contribution of chemicals causing effects. PLoS ONE 14: 1-30. https://doi.org/10.1371/journal.pone.0226278
[5] Cedergreen, B. (2014). Quantifying synergy: A systematic review of mixture toxicity studies within environmental toxicology. PLoS ONE, 9(5): e96580. https://doi.org/10.1371/journal.pone.0096580
[6] Jones, L., Sullivan, T., Kinsella, B., Furey, A., Regan, F. (2017). Occurrence of selected metals in wastewater effluent and surface water in Ireland. Analytical Letters 50: 724-737. https://doi.org/10.1080/00032719.2016.1194854
[7] Qiao, M., Bai, Y., Cao, W., Huo, Y., Zhao, X., Liu, D., Li, Z. (2018). Impact of secondary effluent from wastewater treatment plants on urban rivers: Polycyclic aromatic hydrocarbons and derivatives. Chemosphere, 211: 185-191. https://doi.org/10.1016/j.chemosphere.2018.07.167
[8] Papageorgiou, M., Zioris, I., Danis, T., Bikiaris, D., Lambropoulou, D. (2019). Comprehensive investigation of a wide range of pharmaceuticals and personal care products in urban and hospital wastewaters in Greece. Science of the Total Environment, 694: 133565. https://doi.org/10.1016/j.scitotenv.2019.07.371
[9] Münze, R., Hannemann, C., Orlinskiy, P., Gunold, R., Paschke, A., Foit, K., Becker, J., Kaske, O., Paulsson, E., Peterson, M., Jernstedt, H., Kreuger, J., Schüürmann, G., Liess, M. (2017). Pesticides from wastewater treatment plant effluents affect invertebrate communities. Science of the Total Environment, 599-600: 387-399. https://doi.org/10.1016/j.scitotenv.2017.03.008
[10] Halpern, B.S., Kimberly, A., Selkoe, F.M., Carrie, V.K. (2007). Evaluating and ranking the vulnerability of global marine ecosystems to anthropogenic threats. Conservation Biology, 21(5): 1301-15. https://doi.org/10.1111/j.1523-1739.2007.00752.x.
[11] The United Nations World Water Development Report. (2017). Wastewater the untapped resource.” United Nations World Water Assessment Programme. http://www.unesco.org/new/en/natural-sciences/environment/water/wwap/wwdr/.
[12] Chamorro, S., Hernández, V., Matamoros, V., Domínguez, C., Becerra, J., Vidal, G., Piña, B., Bayona, J.M. (2013). Chemical characterization of organic microcontaminant sources and biological effects in riverine sediments impacted by urban sewage and pulp mill discharges. Chemosphere, 90(2): 611-619. https://doi.org/10.1016/j.chemosphere.2012.08.053
[13] Förstner, U., Heise, S., Schwartz, R., Westrich, B., Ahlf, W. (2004). Historical contaminated sediments and soils at the River Basin scale. Journal of Soils and Sediments, 4: 247-260. https://doi.org/10.1007/BF02991121
[14] Förstner, U. (2015). Sediments and the EU-water framework directive: Revisiting the Elbe 2015 River Basin management plan. Journal of Soils and Sediments, 15: 1863-1864. ttps://doi.org/10.1007/s11368-015-1206-3
[15] Beasley, G., Kneale, P. (2002). Reviewing the impact of metals and PAHs on macroinvertebrates in urban watercourses. Progress in Physical Geography: Earth and Environment, 26: 236-270. https://doi.org/10.1191/0309133302pp334ra
[16] Gerbersdorf, S.U., Hollert, H., Brinkmann, M., Wieprecht, S., Schüttrumpf, H., Manz, W. (2011). Anthropogenic pollutants affect ecosystem services of freshwater sediments: the need for a “triad plus x” approach. Journal of Soils and Sediments, 11: 1099-1114. https://doi.org/10.1007/s11368-011-0373-0
[17] Saeed, T., Al-Shimmari, F., Al-Mutairi, A., Abdullah, H. (2015). Spatial assessment of the sewage contamination of Kuwait’s marine areas. Marine Pollution Bulletin, 94(1): 307-317. https://doi.org/10.1016/j.marpolbul.2015.01.030
[18] Nicolaus, E.E.M., Wright, S.R., Barry, J., Bolam, T.P.C., Ghareeb, K., Ghaloom, M., Al-Kanderi, N., Harley, B.F.M., Le Quesne, W.J.F., Devlin, M.J., Lyons, B.P. (2017). Spatial and temporal analysis of the risks posed by total petroleum hydrocarbon and trace element contaminants in coastal waters of Kuwait. Marine Pollution Bulletin, 120(1): 422-427. https://doi.org/10.1016/j.marpolbul.2017.04.031
[19] Al-Mutairi, N., Abahussain, A., El-Battay, A. (2014). Spatial and temporal characterizations of water quality in Kuwait Bay. Marine Pollution Bulletin, 83(1): 127-131. https://doi.org/10.1016/j.marpolbul.2014.04.009
[20] Pawlowski, J., Lejzerowicz, F., Esling, P. (2014). Next-generation environmental diversity surveys of foraminifera: preparing the future. Biological Bulletin, 227(2): 93-106. https://doi.org/10.1086/BBLv227n2p93
[21] Pawlowski, J., Esling, P., Lejzerowicz, F., Cordier, Y., Visco, J.A., Martins, C.I.M., Kvalvik, A., Steaven, K., Cedhagen, T. (2016). Benthic monitoring of salmon farms in Norway using foraminiferal metabarcoding. Aquaculture Environmental Interaction, 8: 371-386. https://doi.org/10.3354/aei00182
[22] Al-Zamel, A., Cherif, OH., Al-Rifaiy, I.A. (1996). Tidal creeks foraminiferal distribution in khor Al-mufateh and khor Al-mamlaha, khiran area, south-East Kuwait. Revue de Micropaléontologie, 39: 3-23.
[23] Al-Enezi, A., Francescangeli, F., Balassi, E., Borderie, S., Al-Hazeem, S., Al-Salameen, F., Anwar, A.B., Pawlowski, J., Frontalini, F. (2022). Benthic foraminifera as proxies for the environmental quality assessment of the Kuwait Bay (Kuwait, Arabian Gulf): Morphological and metabarcoding approaches. Science of the Total Environment, 833: 155093. https://doi.org/10.1016/j.scitotenv.2022.155093
[24] Al-Zamel, A.Z., Al-Sarawi, M.A., Khader, M.A., Al-Rifaiy, I.A. (2009). Benthic foraminifera from polluted marine environment of Sulaibikhat Bay (Kuwait). Environmental Monitoring and Assessment, 149(1-4): 395-409. http://doi.org/10.1007/s10661-008-0216-7
[25] Al-Enezi, E., Frontalini, F. (2015). Benthic foraminifera and environmental quality: The case study of Sulaibikhat Bay (Kuwait). Arabian Journal of Geosciences, 8: 8527-8538. http:// doi.org/10.1007/s12517-015-1812-9
[26] Rittenberg, S.C., Emery, K.O., Wilson, L., Orr, W.L. (1955). Regeneration of nutrients in sediments of marine basins. Deep-Sea Research, 8: 28-42. https://doi.org/10.1016/0146-6313(55)90034-4
[27] Luo, Y., Guo, W., Ngo, H.H., Nghiem, L.D., Hai, F.I., Zhang, J., Liang, S., Wang, X.C. (2014). A review on the occurrence of micropollutants in the aquatic environment and their fate and removal during wastewater treatment. Science of the Total Environment, 473-474: 619-641. https://doi.org/10.1016/j.scitotenv.2013.12.065
[28] Al-Yamani, F., Bishop, J., Ramadhan, E., Al-Husaini, M., Al-Ghadban, A.N. (2004). Oceanographic Atlas of Kuwait’s Waters. Kuwait: Kuwait Institute for Scientific Research.
[29] Lu, Q., Jürgens, M.D., Johnson, A.C., Graf, C., Sweetman, A., Crosse, J., Whitehead, P. (2017). Persistent organic pollutants in sediment and fish in the river thames catchment (UK). Science of the Total Environment, 576: 78-84. http://10.1016/j.scitotenv.2016.10.067
[30] Blum, K.M., Anderson, P.L, Ahrens, L., Wiberg, K., Haglund, P. (2018). Persistence, mobility and bioavailability of emerging organic contaminants discharged from sewage treatment plants. Science of the Total Environment, 612: 1532-1542. https://doi.org/10.1016/j.scitotenv.2017.09.006
[31] Lin, H., Chen, L., Li, H., Luo, Z., Lu, J., Yang, Z. (2018). Pharmaceutically active compounds in the Xiangjiang River, China: Distribution pattern, source apportionment, and risk assessment. Science of The Total Environment, 636: 975-984. https://doi.org/10.1016/j.scitotenv.2018.04.267
[32] Hargreaves, A.J., Constantino, C., Dotro, G., Cartmell, E., Campo, P. (2018). Fate and removal of metals in municipal wastewater treatment: A review. Environmental Technology Reviews, 7: 1-18. https://doi.org/10.1080/21622515.2017.1423398
[33] Khan, B., Ullah, H., Khan, S., Aamir, M., Khan, A., Khan, W. (2016). Sources and contamination of heavy metals in sediments of Kabul River: The role of organic matter in metals retention and accumulation. Soil and Sediment Contamination, 25: 891-904. https://doi.org/10.1080/15320383.2016.1224226
[34] Fan, J.Y., He, X.Y., Wang, D.Z. (2013). Experimental study on the effects of sediment size and porosity on contaminant adsorption/desorption and interfacial diffusion characteristics. Journal of Hydrodynamics, Ser. B, 25: 20-26. https://doi.org/10.1016/S1001-6058(13)60334-0
[35] Boers, P.C.M., Raaphorst, W.V., Van, der. Molen, D.T. (1998). Phosphorus retention in sediments. Water Science and Technology, 37(3): 31-39. https://doi.org/10.1016/S0273-1223(98)00053-5
[36] Fowler, S.W., Readman, J.W., Oregioni, B., Villeneuve, J.P., McKay, K. (1993). Petroleum hydrocarbons and trace metals in nearshore Gulf sediments and biota before and after the 1991 war: An assessment of temporal and spatial trends. Marine Pollution Bulletin, 27: 171-182. https://doi.org/10.1016/0025-326X(93)90022-C
[37] Akdemir, T., Dalgic, G. (2021). The impact of the marine sewage outfalls on the sediment quality: The Black Sea and the Marmara case. Saudi Journal of Biological Sciences, 28(1): 238-24. https://doi.org/10.1016/j.sjbs.2020.09.055
[38] Long, E.R., Macdonald, D., Smith, S.L., Calder, F.D. (1995). Incidence of adverse biological effects within ranges of chemical concentrations in marine and estuarine sediments. Environmental Management, 19: 81-97. https://doi.org/10.1007/BF02472006
[39] Neale, P.A., Munz, N.A., Aїt-Aїssa, S., Altenburger, R., Brion, F., Busch, W., Escher, B.I., Hilscherová, K., Kienle, C., Novák, J., Seiler, T.B., Shao, Y., Stamm, C., Hollender, J. (2017). Integrating chemical analysis and bioanalysis to evaluate the contribution of wastewater effluent on the micropollutant burden in small streams. Science of the Total Environment, 576: 785-795. https://doi.org/10.1016/j.scitotenv.2016.10.141
[40] Hsu, S.C., Hsieh, H.L., Chen, C.P., Tseng, C.M., Huang, S.C., Huang, C.H., Huang, Y.T., Radashevsky, V., Lin, S.H. (2011). Tungsten and other heavy metal contamination in aquatic environments receiving wastewater from semiconductor manufacturing. Journal of Hazardous Materials, 189: 193-202 http://10.1016/j.jhazmat.2011.02.020
[41] Kolawole, T.O., Olatunji, A.S., Jimoh, M.T., Fajemila, O.T. (2018). Heavy metal contamination and ecological risk assessment in soils and sediments of an industrial area in southwestern Nigeria. Journal of Health and Pollution, 8(19): 180906. https://doi.org/10.5696/2156-9614-8.19.180906
[42] Thomas, R.L. (1972). The distribution of mercury in the sediments of Lake Ontario. Canadian Journal of Earth Sciences, 9: 636-651. https://doi.org/10.1139/e72-054
[43] Alkhalidi, M.A., Al-Nasser, Z.H., Al-Sarawi, H. (2022). Environmental impact of sewage discharge on shallow embayment and mapping of microbial indicators. Frontiers in Environmental Science, 10: 914011. https://doi.org/10.3389/fenvs.2022.914011
[44] Khader, S. (1997). Coastal geomorphology and environmental assessment of Sulaibikhat Bay. Unpublished Master’s Thesis, Kuwait University, Kuwait City, Kuwait.
[45] Al-Kandari, A. (2009). Trace metals concentration and their effect on foraminifera at coastal area adjacent to kuwait university campus in Shuwaikh. Masteral Thesis in Geology, Kuwait University, Kuwait City, Kuwait.
[46] Netter, P. (2012). 16 - Reprocessing of spent oxide fuel from nuclear power reactors, In Woodhead Publishing Series in Energy, Nuclear Fuel Cycle Science and Engineering. Woodhead Publishing. https://doi.org/10.1533/9780857096388.4.459
[47] Silva, C., Cachada, A., Gonçalves, F.J.M., Nannou, C., Lambropoulou, D., Patinha, C., Abrantes, N., Pereira, J.L. (2022). Chemical characterization of riverine sediments affected by wastewater treatment plant effluent discharge. Science of the Total Environment, 839: 156305. https://doi.org/10.1016/j.scitotenv.2022.156305
[48] Margot, J., Rossi, L., Barry, D.A., Holliger, C. (2015). A review of the fate of micropollutants in wastewater treatment plants. Wiley Interdiscip, 2: 457-487. https://doi.org/10.1002/wat2.1090
[49] Ahmed, M.B., Zhou, J.L., Ngo, H.H., Guo, W., Thomaidis, N.S., Xu, J. (2017). Progress in the biological and chemical treatment technologies for emerging contaminant removal from wastewater: A critical review. Journal of Hazardous Materials, 323: 274-298. https://doi.org/10.1016/j.jhazmat.2016.04.045
[50] Ibáñez, M., Gracia-Lor, E., Bijlsma, L., Morales, E., Pastor, L., Hernández, F. (2013). Removal of emerging contaminants in sewage water subjected to advanced oxidation with ozone. Journal of Hazardous Materials, 260: 389-398. https://doi.org/10.1016/j.jhazmat.2013.05.023
[51] Ashauer, R. (2016). Post-ozonation in a municipal wastewater treatment plant improves water quality in the receiving stream. Environmental Sciences Europe, 28: 1-7. https://doi.org/10.1186/s12302-015-0068-z
[52] Naddeo, V., Secondes, M.F.N., Borea, L., Hasan, S.W., Ballesteros, F.V., Belgiorno, V. (2020). Removal of contaminants of emerging concern from real wastewater by an innovative hybrid membrane process – UltraSound, Adsorption, and Membrane ultrafiltration (USAMe®) Ultrason. Sonochem, 68(2020): 105237. https://doi.org/10.1016/j.ultsonch.2020.105237