Hazrin Izwan Che Haron*![]() | Hamdy Abdullah
| Hamdy Abdullah![]() | Sheikh Ahmad Faiz Sheikh Ahmad Tajuddin
| Sheikh Ahmad Faiz Sheikh Ahmad Tajuddin![]() | Nurul Aisyah Awanis A. Rahim
| Nurul Aisyah Awanis A. Rahim![]()
© 2023 IIETA. This article is published by IIETA and is licensed under the CC BY 4.0 license (http://creativecommons.org/licenses/by/4.0/).
OPEN ACCESS
This study examines the mediating effect of tourist satisfaction on the relationship between determinant factors that influence tourist satisfaction and lead intention to revisit in the context of Terengganu's focus on edu-tourism. The study uses a sample of 384 tourists from seven edu-tourism destinations chosen through stratified random sampling. The data are analyzed using Statistical Package for the Social Sciences (SPSS) and Analysis of Moment Structures (AMOS) to conduct Structural Equation Modelling (SEM). The beta estimate analysis reveals that all determinant factors have a positive relationship with tourist intention to revisit. Tourist satisfaction has mediation effects between educational institutions and tourism organizations. The study provides an innovative research approach by examining the mediating roles of tourist satisfaction between tourism operators, event management, local communities, and investment towards tourist intention to revisit. The study has theoretical and practical contributions to tourism organizations, tourism operators, event managers, academicians, and government sectors.
confirmatory factor analysis, tourist satisfactions, edu-tourism, tourist destination, sustainability, tourism development, Structural Equation Modelling (SEM)
1.1 Background
Terengganu has an area of 1,295,638.3 hectares with an estimated population of 1,280,000 people (Department of Statistics Malaysia, 2021). The capital city is named Kuala Terengganu. The Terengganu State Government aspires to make the state the main tourist destination on the east coast of Malaysia by utilizing nature, adventure, and heritage as the main attraction. The policy and strategy are also aimed at attracting more visitors and encouraging them to stay longer, by creating great packages, and development as well as modernizing the tourism products to be more viable.
Terengganu has many edu-tourism products with their own "wow factor” towards tourist attraction and seems to be part of a contributor to the state’s economy. The Tourism action plan (2009 - 2013) which was prepared by the tourism state government is actively promoting tourism and results showed that edu-tourism is among the important medium and with the increasing number of tourist arrival, it can give benefits to a lot of people, especially to the local people in Terengganu [1].
Edu-tourism is a sub-tourism sector in Terengganu which contributes sustainability of the tourism industry. However, many tourist and visitor were not aware of the existence of this segment in Terengganu that have the potential in attracting tourist intention to visit and revisit. Efforts have been undertaken by all tourism parties to stimulate this sector but need to be formulated and synchronized with determinant factors that influence tourist intention to visit and revisit. This is correspondingly in line with the analysis [2] suggested that more doubling effort is needed to formulate the edu-tourism sectors.
Possible solutions and effective determinant factors have been professionally addressed to encounter inconstancy that could increase attraction towards tourist intention to visit and revisit the edu-tourism destinations in Terengganu [3]. Following this, tourism operators, event managements, local communities, investments, educational institutions, and tourism organizations are part of determinants factors that able to develop the edu-tourism sectors [4-7].
On the other hand, tourist satisfactions is conceived as the mediator that creates, produces, and strengthens customer loyalty in edu-tourism which develop tourist long-term relationship that led revisit to destinations. Management in edu-tourism sector needs to focus on effective tourist satisfactions with a good image of a touristic place to improve tourist loyalty and intention to visit or revisit [8]. However, there is still a lack of concern towards this mediator among tourism facilities where packages offered are inappropriate and lead to low tourist satisfactions and this mediator deserves attention from researchers in the viewpoint of edu-tourism setting [9].
However, this study is expected to provide valuable insights by exploring the absence of any mediating role of tourist satisfaction between tourism operators, event management, local communities, and investment impact on tourists' intention to revisit. By examining these mediation relationships, the research can shed light and uncover potential drivers and offer a fresh perspective on the factors that influence tourists' decision-making processes. Furthermore, the findings can provide valuable insights to various stakeholders, including tourism operators, event organizers, local communities, and investors, enabling them to develop more targeted strategies and initiatives to attract repeat visitors and foster sustainable tourism growth.
1.2 Need for the study
1.2.1 Theoretical view
Many previous studies have emphasized that medium such as promotion and infrastructure believed are significance in relationship and challenges towards tourism industry especially in edu-tourism [10-12]. Also, policies and strategies practice were often discussed as the driven key which drives edu-tourism growth in Malaysia [13].
Furthermore, empirical observationshave found that tourism operators, event managements, local communities, investments, educational institutions and tourism organizations are factors that able to influence tourist satisfactions and bring development towards edu-tourism in Terengganu and also perceived as exploration opportunities for the research gap [10, 14-18].
In theoretical terms, this study contributed to the literature on tourism operators, event managements, local communities, investments, educational institutions and tourism organisations by filling the research gap which was identified in the course of a thorough review of previous studies on the same subject matter. This study helps tourism players to understand why and how to vary happens so that tourism programs can utilize most of the development potential of this sector. It is significantly important that a full understanding of challenges, assumptions, solutions and indicators is built for the tourism industry.
1.2.2 Practical view
The Ministry of Tourism and Culture introduced edu-tourism packages in 2015 and the intensity of involvement in this area is still limited with many potential areas [19]. Similarly, Malaysia has many edu-tourism areas that are yet to be empirically examined which affect promotion efforts in this segment significantly [20].
Besides that, some research stated that less exploration of tourist satisfactions from the viewpoint of edu-tourism is considered important and crucial [9]. Furthermore, players in the edu-tourism sector have offered inappropriate packages in the market segment which could strike an image toward visitors’ intention to revisit [21]. To achieve tourist satisfactions, tourism players should realize and analyses issues and challenges in determinant factors; tourism operators, event management, local communities, investment, educational institutions and tourism organizations.
The practical contributions of the studies also help to concern the identification, management and protection of heritage values which involved understanding the impact of edu-tourism on communities and regions, achieving economic and social benefits, providing financial resources for protection, as well as marketing and promotion. It also helps tourism departments, organizations, government sectors and tourism players to improve their management competence and development to identify opportunities associated with edu-tourism industries. Moreover, this study support to improving education and skills training in edu-tourism among players and creating employment opportunities. In addition, the direct effect on edu-tourism can produce additional employment opportunities through its stimulating influence on tourism sectors. Above all, these causal associations between tourism growth and the economy will expand the contribution of edu-tourism to the state's economy and its gross domestic product.
The main purpose of tourist’s approach towards edu-tourism segmentation is to derive learning experiences that have broad courses, classes and categories such as arts, culture, history and technology. Therefore, any existing edu-tourism destinations must need to be designed and provided with memorable experiences where it will create a subjective experience and an outstanding edu-tourism environment and these will attract more tourists and visitors to any edu-tourism destinations [22].
Previously, empirical researches have discovered that tourism operators, event managements, local communities, investments, educational institutions and tourism organizations are determinant factors that able to influence revisit intention [16, 23-26]. Moreover, some authorshave supported that these determinant factors are capable to improve the edu-tourism industries in Terengganu [27, 28]. Also, study about travel needs to achieve tourist satisfactions is compulsory and to support this, tourism players should realize that the challenges issues of tourist operators, event managements, local communities, investment, educational institutions and tourism organizations are determinant factors in edu-tourism that need to be analyzed to achieve tourist satisfactions and good image in the tourism industries which lead visitors intention to revisit [29].
The special places access, behind-the-scenes tour enjoyments and exclusive experiences in edu-tourism places will give tour operators a repeat business that visitors intend to revisit and tour operators are vitally important as the resource specialists and local people have a different role of characteristic. Hence, it is important to have a very well-experienced tour operator in the tourism industry, especially in the edu-tourism fields [30]. Tourist who experienced service and engaged enjoyment will impact their satisfaction which is an important root of future business and recommendation behavior among tourists. In conclusion, strengthening the package tour by tourism operators as tourist satisfaction requires the quality of experiences during their trip at the destination [31].
Event managers also need to present the public with education and recreation to convey association direction through the edu-tourism industry. Tourist satisfaction towards events refers to their perception discrepancy between prior expectations, and perceived performance after consumption and when performance differs from their expectation will lead to dissatisfaction occurs. Great experience with edu-tourism events will make them feel satisfied after the services or products. It is necessary for event management to manage the events efficiently and effectively to aim for positive social and cultural impacts on surroundings that will avoid deflection, poor public, negative social, cultural and political impacts [32].
Edu-tourism is also involved with the local communities where its products deal with many challenges from local communities to achieve comprehensive and sustainable development of edu- tourism. Poor management such as waste, sound pollution and degradation of heritage elements especially the local culture products in edu-tourism events will negatively impact local communities’ sense and comfortableness and negatively impact visitation intention [33]. In the local communities’ context, tourists however did not seem to enjoy edu-tourism destinations that are not environment friendly. Local communities activities could effect tourists’ satisfaction and will directly influencing the success of edu-tourism destination [34].
On the other hand, the indirect benefits are the returns of investment in edu-tourism events which increase creative capital, and induce visitors to travel and revisit which becomes vital in the ‘new economy’ in edu-tourism. However, several costs need to be borne by these tourism organizations which included taxes if they receive investment through direct funding [35]. The increment number of tourists revisiting will lead to competitiveness and attracts large investments for tourism infrastructure development including services and this is necessary to meet the needs of tourists satisfaction during their stay at the edu-tourism destinations. The deficiency level of development and function in the vicinity of destinations has become an obstacle that can affect the experience and satisfaction of tourists and hence, good investments are needed [36].
Edu-tourism consists of intensive knowledge and offers long-term socio-economic benefits where the economic knowledge growth has shaped globally the incorporation of higher education. Educational Institution that provides quality human capital will lead the edu-tourism development as a platform of knowledge transfer in the world of the economy [37]. Education programs provided can affect education quality and tourist satisfaction positively and it is crucial to put forth that tourist satisfaction is important in terms of education instruction quality among educational institutions [38].
The tourism organizations in Malaysia have promoted various tourism events and education tourism is one of the types that received an increased demand from visitors. Meanwhile, World Tourism Organization has defined edu-tourism as one of the approaches of cultural motivations in cultural and heritage tourism. The variety of cultural diversity that appeared in the successful “Malaysia Truly Asia” campaign by Malaysia’s tourism department has developed broadly in attracting more tourists to visit and revisit [39]. Tourism organizations should realize and recognize tourist satisfaction is the key to success for them. The great productivity of tourism organizations could recognize the need and encourage both new and repeat tourists and this mission can best be accomplished by ensuring their current offerings are satisfying tourist expectations, needs and desires which will contribute to their tendency to recommend others of the destination [40].
Some findings indicated that tourist satisfactions have a great impact on tourist intention and potentially affects their revisit intention [41]. Tourist satisfactions depend on a comparison of expectations, where a good travel experience will result in pleasant feelings while dissatisfaction results when they felt displeasure. Additionally, some researches support this and claimed that pleasant feelings derived from edu-tourism destinations will lead to satisfaction and increase tourist intention to revisit [42-44].
By realizing the determinant factors that could ably shape tourist satisfactions, it will anticipate and form a great marketing strategy that can be implemented to enhance satisfaction and further arouse the intention to revisit. Therefore, it is crucial to understand and manage determinant factors wisely as it promotes tourist satisfaction and the role of satisfaction is very significant that factors out the intention to revisit [45]. In this context, the mentioned factors that are referred to as determinant factors are; tourism operators, event managements, local communities, investments, educational institutions and tourism organizations.
2.1 Theoretical foundation
In mid-19802, Dr. Icek Ajzen's theorized the theory of planned behavior which present the psychological viewpoint which reflects the relation between attitudes and behaviors. The theory stated that the action of an individual is constructed by attitude, subjective norms, and perceived behavioral control. Attitude is transformed into behavior by the intention to act. In several experimental studies, Dr. Ajzen's findings on behavioral intention have been used to explain the leisure participation of an individual. Since tourists actively participate in each step of the model as they participate in tourism, this idea can be applied to the tourism industry. In selecting a travel destination, tourists’ decision is formed by their attitude and perceived attributes of the destination [46].
Additionally, this theory points out that peoples’ evaluations are determined by their accessible beliefs, where a belief is defined as the subjective probability that produces a certain outcome. This method enables specific identification of how messages influence visitor beliefs and behavior that comes from understanding their needs and this includes a better understanding of how they respond [47]. The behavioral element of the theory of planned behavior explores behavioral changes and this will make a significant contribution to the tourism industry's sustainability as it aims to improve behavior effectively and can inspire tourists to consider or act instantly. Hence, to access the reality of interpretation, it is important to consider tourist variables on attitude, behavior and which interpretations are reliable [48]. In edu-tourism, the theory of planned behavior is widely applied as it helps to assist tourism players to intervene with tour operators, event managements, local community, investments, educational institutions and tourism organizations which affect tourist intention to revisit.
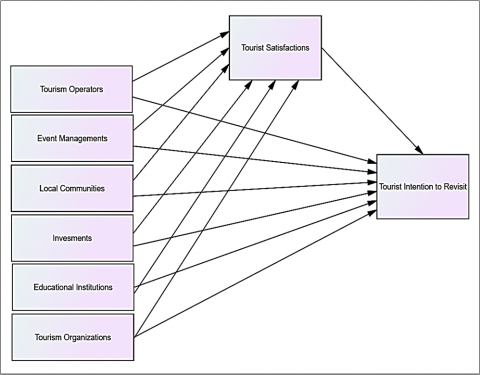
2.2 The research framework (Figure 1)
Figure 1. Research framework
2.3 Hypotheses development
2.3.1 Relationship between tourism operators and tourist intention to revisit Terengganu
This finding is in line with Samat et al. [49], who expressed that the special access and exclusive experiences in edu-tourism destinations give tour operators a repeat business where visitors intend to revisit and tour operators are vitally important as the resource specialists and local people have a different role of characteristic. The author emphasized that it is important to have a very well-experienced tour operator in the tourism industry, especially in the edu-tourism fields. Another author also discovered that the role of tour operators plays a major role in promoting tourism to attract revisit intention where they meet tourist needs and preserve edu-tourism products [50]. Hence, the following hypothesis was proposed:
Hypothesis 1 (H1). There is a positive effect between tourism operators and tourist intention to revisit Terengganu.
2.3.2 Relationship between event managements and tourist intention to revisit Terengganu
With a holistic approach in the edu-tourism market, event managements can integrate strategic management to achieve the best short- and long-term performance and contribute benefits to all subjects involved through a monitoring system with the possible aim of goals especially designed to attract people to revisit the edu-tourism [51]. In addition, great creativity for new businesses in edu-tourism from event managements will make benefit by widening potential partners nationally and internationally, nurturing their staff and their stakeholders and ensuring that it reaches a wide audience of tourists and visitors to revisit the destinations. Therefore, the following hypothesis was posited:
Hypothesis 2 (H2). There is a positive effect between event managements and tourist intention to revisit Terengganu.
2.3.3 Relationship between local communities and tourist intention to revisit Terengganu
Mustafa [52] stated that the uniqueness of tradition and cultural activities practiced by the local communities has attracted tourists to visit and revisit homestays in Malaysia as part of their education visitations. Furthermore, edu-tourism is defined as an approach to recognizing the local heritage in Malaysia which has diverse communities by encouraging harmony, respect and sharing knowledge across cultures that will surely create tourist intention to revisit [53]. Therefore, the following hypothesis was posited:
Hypothesis 3 (H3). There is a positive effect between local communities and tourist intention to revisit Terengganu.
2.3.4 Relation between investments and tourist intention to revisit Terengganu
All investment efforts to improve edu-tourism have a direct positive impact to host the event successfully and contribute to a longer-term tourism industry. By determining the milestones and contributing investments in conducting events as a fast track of development, sustainable tourism will continue to be sustained and developed which eventually contribute to tourists’ visit intention [54]. Similarly, another authors stated that government needs to invest in a project community that responds to the edu-tourism demand market where they could develop and sustain creative endeavors which are substantial that depict the edu-tourism industry as part of the creative industries holds that lead tourists to revisit destinations [55]. Hence, the following hypothesis was proposed:
Hypothesis 4 (H4). There is a positive effect between investments and tourist intention to revisit Terengganu.
2.3.5 Relationship between educational institutions and tourist intention to revisit Terengganu
The edu-tourism industry draws educational institutions to enhance unforgettable learning experiences and nowadays these institutions have become a subset of the edu-tourist industry that boosted the economic activity which able to attract tourists’ intention to visit and revisit [8]. Moreover, the art education institutions in Bali have attracted many foreign students as they are keen and enthusiastic about learning the Balinese cultural arts. This phenomenon has stimulated the tourism industry and attracts visitors to visit and revisit.Therefore, the following hypothesis was posited:
Hypothesis 5 (H5). There is a positive effect between educational institutions and tourist intention to revisit Terengganu.
2.3.6 Relationship between tourism organizations and tourist intention to revisit Terengganu
To position Malaysia as a preferred edu-tourism destination, a vast of tourism marketing activities and promotion materials have been launched by tourism organizations in Malaysia and had arouses visitors to revisit [38]. The tourism organizations in Kerala also have established great initiatives in opening many units of accommodation, developed policy frameworks and successfully motivated tourists’ intention to revisit [55]. Hence, the following hypothesis was proposed:
Hypothesis 6 (H6). There is a positive effect between tourism organizations and tourist intention to revisit Terengganu.
2.3.7 Relationship between mediating role of tourist satisfactions in the relationship between tourism operators and tourist intention to revisit Terengganu
The findings are in line with the researchwho define that the importance of tourism operator’s services in the destination will ensure satisfaction or dissatisfaction among tourists and the more their displeasure with tourism operators, the high intention degree for them to disengage in satisfactions which lead non revisit intention in respect to the bad service provided [56].
Hypothesis 7 (H7). There is no positive mediating effect of tourist satisfactions in the relationship between tourism operators and tourist intention to revisit Terengganu.
2.3.8 Relationship between mediating role of tourist satisfactions in the relation between event managers and tourist intention to revisit Terengganu
Event management’s quality and its ability to gain competitive advantage are measured by the level of satisfaction or dissatisfaction impact on tourists [57]. Tourists are more satisfied when they perceived higher quality, highly involved and experienced great activities offered in any event conducted at the destination. However, event managements that failed to meet expectations caused dissatisfaction among tourists and will conversely result an insignificant satisfactions in motivating them to revisit the destination anymore [58].
Hypothesis 8 (H8). There is no positive mediating effect of tourist satisfactions in the relationship between event managements and tourist intention to revisit Terengganu.
2.3.9 Relationship between mediating role of tourist satisfactions in the relationship between local communities and tourist intention to revisit Terengganu
This finding is consistent with the statement where they claimed that the less mature local communities interact with tourists, the fewer repeaters tourist will come due to dissatisfaction [59]. The poor way of local communities interacts would negatively influence tourist and dissatisfaction which indirectly mediate no intention to revisit. However, mature local communities will contribute and influence the level of satisfaction among tourists and therefore affects their revisit intention [60].
Hypothesis 9 (H9). There is no positive mediating effect of tourist satisfactions in the relationship between local communities and tourist intention to revisit Terengganu.
2.3.10 Relationship between mediating role of tourist satisfactions in the relationship between investments and tourist intention to revisit Terengganu
It is essential to examine and formulate a strategic marketing plan for the investment to persuade tourists to revisit. Investments contribute to increasing economic growth, business activities, facilities and competitiveness in the tourism industry will lead to survivor processes and improve tourist satisfactions [61]. Bad investments which drive sceneries of low entrepreneurs’ skills, low tourism business activities and facilities will sedate tourist satisfactions level and cause them not to revisit [61]. Therefore, is essential to examine and formulate a strategic marketing plan for the investment to persuade tourists to revisit.
Hypothesis 10 (H10). There is no positive mediating effect of tourist satisfactions in the relationship between investments and tourist intention to revisit Terengganu.
2.3.11 Relationship between mediating role of tourist satisfactions in the relationship between educational institutions and tourist intention to revisit Terengganu
Some authorsalso stated that education institutions’ potential could be developed wider and able to transform the levels of satisfaction towards tourists [62]. Tourist satisfactions index is very high when they gain experience from the academic institution’s service and product and these improvements contribute possibility of visitor repetition.
Hypothesis 11 (H11). There is a positive mediating effect of tourist satisfactions in the relationship between educational institutions and tourist intention to revisit Terengganu.
2.3.12 Relationship between mediating role of tourist satisfactions in the relationship between tourism organizations and tourist intention to revisit Terengganu
The tourism organizations that offer a high degree of commitment will deliver active postures toward tourists and impress their satisfaction, positive effect on commitment and loyalty in visitation [63].
Hypothesis 12 (H12). There is a positive mediating effect of tourist satisfactions in the relationship between tourism organizations and tourist intention to revisit Terengganu.
3.1 Unit analysis
The research questions will determine the unit analysis and for this study, the objective is to focus on tourists, visitors and students who visited the selected edu-tourism destinations in Terengganu [64]. The reason why students are also considered a tourist is based on the research [65] statement that students with less than one year of visitation are directly falling under foreign tourists as they visited various edu-tourism destinations. Therefore, foreign students in semester one are selected as they have less than one year of visitation. It is necessary to choose the correct unit of analysis when developing the research questions since the data collection method, sample size, and even the variables included in the framework may count on the level at which data are gathered for analysis.
3.2 Sample and procedure
The sample is a true representation of a population that it belongs to, so sampling is the process of selecting the sample [64]. A sample is an extraction of elements from the population which is also regarded as a device that reflects the entire population of the study whereby the findings from a sample can be used to make conclusions about the entire population. the sample of this study constituted mainly of the tourists that visit edu-tourism destinations in Terengganu. Sampling is selecting scientific units from a population. A researcher can't reach every tourist in surveying due to big population and limited resources. Therefore, to conclude accurately on the findings of the research, a stratified random sampling technique has been adopted as this focused on the total population of tourists who visited Terengganu’s edu-tourism destinations in 2019. In brief, stratified random sampling involves the process of stratification whereby different class is made and then a random sample is then drawn from each class [66].
To conduct this study, 10-point Likert scale questionnaires have been distributed to a total of 384 respondents that visited seven (7) edu-tourism destinations in Terengganu. The list of destinations was advised by Jabatan Pelancongan Negeri Terengganu and the total sample size is based on population and as referred to in the table from previous study [64]. In order to develop and analyze edu-tourism, it is important to determine attribute selections and they have distributed questionnaires to tourists who visited the research areas [67]. A cover letter has been obtained from faculty under the University of Sultan Zainal Abidin, Terengganu, to serve as an introductory and permission from the seven (7) selected edu-tourism destinations. The researcher contacted the receptionist to distribute the survey questionnaires and once approved, the researcher distributed the questionnaires to visitors and students at the main entrance of destinations and inside the buildings. Before they answered the questionnaire, they were informed about the research objectives and informed that their participation is voluntary. The questionnaires were collected in stages within one month of duration separately by each selected destination. All questionnaires were successfully collected by the researcher from 384 respondents.
Table 1 shows the populations based on the number of visitors and students with the number of breakdowns for samples collected in each selected edu-tourism destination in 2019. The total attendance recorded is 150,200 visitors and exceeds the representative of the opinion of population size and synchronizes with the range outcome which can be used to determine the appropriate sample size [68].
Table 1. Summary population and breakdown in each destination
|
No. |
Edutourism Destinations |
Population Arrivals(2019) |
Total Percentage |
Total Sample |
Total Sample for Each Destination |
|
1. |
Terengganu state Museum |
83,045 |
55% |
|
211 |
|
2. |
Setiu Wetland |
4,846 |
3% |
|
11 |
|
3. |
Wood Carving Village |
185 |
1% |
|
4 |
|
4. |
Universiti Malaysia Terengganu |
473 |
1% |
|
4 |
|
5. |
Universiti Sultan Zainal Abidin |
240 |
1% |
|
4 |
|
6. |
Pusat Budaya Craft Terengganu |
24,000 |
15% |
|
58 |
|
7. |
Turtle and Marine Ecosystem Center |
37,411 |
24% |
384 |
92 |
|
|
Total |
150,200 |
100% |
384 |
384 |
3.3 Measurements
Questionnaires were adapted from several scholars to meet the objectives of this study. This study will use survey questionnaires that consist of ten sections. A pre-test of the instrument was carried out to determine the reliability and consistency of the measurement scales which is the regular criteria that must be attained through the validity and reliability of the constructs. For the pre-test in this study, the items in the questionnaires are reviewed and validated by a group of experts to ensure the items are valid, reliable, appropriate, and sufficient before the pilot study was conducted. Thus, all items went through the test of content validity.
The Likert scale is used in the questionnaires to measure personality, perception, social and psychological attitude research [69]. The advantage of using the Likert scale could minimize the amount of time needed to use it and convenience to the researcher. This study used a Likert scale to measure all the constructs and a ten-point Likert- scale which ranges from 1- ‘strongly disagree’ to 10- ‘strongly agree’ was used. Moreover, the ten-point Likert scale is an attitude scale that is used widely and more suitable compared to other point scales such as the 5-point Likert scale or 7-point Likert scale as it allows greater differentiation [70].
3.4 Data analysis
Statistical Package for the Social Sciences (SPSS) is used to analysis generate tabulated reports, descriptive statistics and complex statistical analysis. Consequently, the data has been analyzed using the software of Analysis of Moments and Structures (AMOS) for the computation of Structural Equation Modelling (SEM).
4.1 Demographic profiles of respondents
A number of 282 tourists happened to be local, constituting 73.3% while 102 of them were foreign which constitute 26.5% of the tourists. To be a more specific large number of tourists are local tourists in the sample aged from 30 to 39 years old. In addition, 230 tourists happened to be male, constituting 59.8% while 154 of them were female which constitute 40.1% of the tourists. There are 132 respondents which constitute 34% from the public sector and most of them are from the degree level in the sample whereas 143 respondents from the degree level which constitute 37%. Lastly, 203 respondents have below RM 24,000.00 house income which equals 53%.
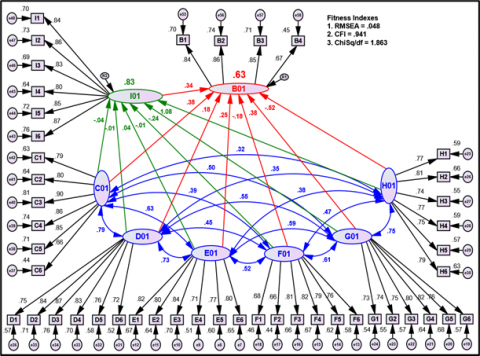
4.2 Measurement model assessment
The Fitness Indexes for the measurement model in this study fit and prove that the measurement model has met the threshold values stated in Table 1. The Absolute Fit category namely RMSEA is 0.043 (less than the threshold of 0.08), the Incremental Fit category namely CFI is 0.943 (greater than the threshold of 0.90), and the Parsimonious Fit category namely the ratio of Chisq/df is 1.721 (less than threshold 3.0). Thus, the measurement model in this study has achieved the requirement for construct validity [71-73].
Table 2. The fitness index for model
|
Name of Category |
Name of Index |
Index Value |
|
Absolute Fit |
RMSEA |
0.048 |
|
Incremental Fit |
IFI |
0.944 |
|
TLI |
0.937 |
|
|
CFI |
0.941 |
|
|
Parsimonious Fit |
Chisq/df |
1.863 |
Validity and reliability were first assessed by looking at the loadings, average variance extracted (AVE) and composite reliability (CR) [74]. As shown in Table 2, all the AVE were greater than 0.5, and the CR was greater than 0.7. Since the AVE and the CR all met the required cut-o values, it was concluded that the measurement had convergent validity and reliability (Table 3).
Table 4 below reveals that the diagonal value in bold is the square root of the AVE, while the other values are the correlations between the constructs within the columns and rows. The table indicates that the discriminant validity for the model is achieved since the diagonal values for all constructs are higher than the value of the correlation between all constructs [73].
Table 3. Mean, standard deviation, average variance extracted and composite reliability
|
Construct |
CR |
AVE |
Mean |
SD |
|
Tourism Operators |
0.920 |
0.659 |
8.07 |
1.346 |
|
Event Managements |
0.920 |
0.660 |
8.12 |
1.333 |
|
Local Communities |
0.911 |
0.631 |
8.18 |
1.277 |
|
Investments |
0.888 |
0.571 |
8.74 |
0.914 |
|
Educational Institutions |
0.897 |
0.591 |
8.57 |
1.057 |
|
Tourism Organizational |
0.898 |
0.596 |
8.89 |
0.960 |
|
Tourist Satisfactions |
0.936 |
0.709 |
8.68 |
0.950 |
Table 4. Discriminant validity
|
Constructs |
Tourist Intention to Visit |
Tourist Operators |
Event Managements |
Local Communities |
Investments |
Educational Institutions |
Tourism Organizations |
Tourist Satisfaction |
|
Tourist Intention to Visit |
0.806 |
|
|
|
|
|
|
|
|
Tourist Operators |
0.35 |
0.812 |
|
|
|
|
|
|
|
Event Managements |
0.21 |
0.29 |
0.812 |
|
|
|
|
|
|
Local Communities |
0.27 |
0.35 |
0.15 |
0.794 |
|
|
|
|
|
Investments |
0.29 |
0.39 |
0.43 |
0.52 |
0.756 |
|
|
|
|
Educational Institutions |
0.51 |
0.50 |
0.27 |
0.21 |
0.27 |
0.769 |
|
|
|
Tourism Organizations |
0.27 |
0.32 |
0.34 |
0.37 |
0.47 |
0.35 |
0.772 |
|
|
Tourist Satisfaction |
0.21 |
0.20 |
0.22 |
0.27 |
0.36 |
0.27 |
0.27 |
0.842 |
4.3 The standardized regression weights
Next is the standardized model where AMOS output provided the standardized beta coefficient between constructs which namely are: tourist intention to visit, tourism operators, event management, local communities, investments, education institutions, tourism organizations and tourist satisfactions. In addition, this AMOS output consists of factor loading for items as well as factor loading for the components and the R2 for the model. Figure 2 shows the output in the standardized regression coefficient of tourist intention to visit, tourism operators, event managements, local communities, investments, educational institutions, tourism organizations and tourist satisfactions.
Figure 2 shows the results of standardized estimates which consist of the proportion of variance explained in the model. The endogenous construct for this study is tourist intention to revisit. Based on the results given, the squared multiple correlations (R2) for this study are 0.31 or 31%. It could be said that 63% was explained by tourist intention to visit, tourism operators, event managements, local communities, investments, education institutions, tourism organizations, tourist satisfactions and Muslim friendly. Meanwhile, 31% of the total variance could be predicted by other factors. Significantly, a value above 26% is considered a large effect as this is proven in this study [75].
Figure 2. The standardized regression weights for every path in the model
4.4 Hypotheses testing
Structural Equation Modelling has been used to test the hypotheses and Table 5 shows the adequate corresponding output to test the hypotheses for causal effects. Below are twelve following hypotheses that are direct hypotheses (path analysis) and these hypotheses represent the effects of exogenous constructs on the respective endogenous constructs.
4.4.1 Hypotheses 1
The results of hypothesis testing for the causal effect tourism operators on tourist intention to revisit are as expressed in H1. The path coefficient of tourism operators to tourist intention to revisit is 0.428. This value indicates that in every one-unit increase in tourism operators, its effect would contribute 0.428 unit increase in tourist intention to revisit. The regression weight estimated at 0.428 has a standard error of about 0.093. The critical ratio is shown as 4.687 standard errors above zero. The probability of getting a critical ratio of 4.687 in an absolute value is 0.000. In other words, the regression weight for tourism operators in the prediction of tourist intention to revisit is significant at a 1% level. Hence, the hypothesis that tourism operators have a significant effect on tourist intention to revisit is duly supported.
4.4.2 Hypotheses 2
The results of hypothesis testing for the causal effect event managements on tourist intention to revisit are as expressed in H2. The path coefficient of event managements to tourist intention to revisit is 0.205. This value indicates that in every one-unit increase in event managements, its effect would contribute to a 0.205 unit increase in tourist intention to revisit. The regression weight estimate of at 0.205 has a standard error of about 0.102. The critical ratio is shown as 2.017 standard errors above zero. The probability of getting a critical ratio of 2.017 in an absolute value is 0.044. In other words, the regression weight for event managements in the prediction of tourist intention to revisit is significant at 1% level. Hence, the hypothesis that event managements have a significant effect on tourist intention to revisit is duly supported.
4.4.3 Hypotheses 3
The results of hypothesis testing for the causal effect of local communities on tourist intention to revisit are as expressed in H3. The path coefficient of local communities to tourist intention to revisit is 0.219. This value indicates that in every one-unit increase in local communities, its effect would contribute 0.219 unit increase in tourist intention to revisit. The regression weight estimated at 0.219 has a standard error of about 0.097. The critical ratio is shown as 2.254 standard errors above zero. The probability of getting a critical ratio of 2.254 in an absolute value is 0.024. In other words, the regression weight for local communities in the prediction of tourist intention to revisit is significant at a 1% level. Hence, the hypothesis that local communities have a significant effect on tourist intention to revisit is duly supported.
4.4.4 Hypotheses 4
The results of hypothesis testing for the causal effect investments on tourist intention to revisit are as expressed in H4. The path coefficient of investments to tourist intention to revisit is -0.265. This value indicates that in every one-unit increase investment, its effect would contribute a -0.265 unit increase in tourist intention to revisit. The regression weight estimate at -0.265 has a standard error of about 0.086. The critical ratio is shown as -3.063 standard errors above zero. The probability of getting a critical ratio of -3.063 in an absolute value is 0.002. In other words, the regression weight for investments in the prediction of tourist intention to revisit is significant at 1% level. Hence, the hypothesis that investments have a significant effect on tourist intention to revisit is duly supported.
4.4.5 Hypotheses 5
The results of hypothesis testing for the causal effect educational institutions on tourist intention to revisit are as expressed in H5. The path coefficient of educational institutions to tourist intention to revisit is 0.767. This value indicates that in every one-unit increase educational institutions, its effect would contribute 0.767 unit increase in tourist intention to revisit. The regression weight estimated at 0.767 has a standard error of about 0.257. The critical ratio is shown as 2.990 standard errors above zero. The probability of getting a critical ratio of 2.990 in an absolute value is 0.003. In other words, the regression weight for educational institutions in the prediction of tourist intention to revisit is significant at a 1% level. Hence, the hypothesis that educational institutions have a significant effect on tourist intention to revisit is duly supported.
4.4.6 Hypotheses 6
The results of hypothesis testing for the causal effect tourism organizations on tourist intention to revisit are as expressed in H6. The path coefficient of tourism organizations to tourist intention to revisit is -1.395. This value indicates that in every one-unit increase tourism organization, its effect would contribute -1.395 unit increase in tourist intention to revisit. The regression weight estimated at -1.395 has a standard error of about 0.577. The critical ratio is shown as -2.418 standard errors above zero. The probability of getting a critical ratio of -2.418 in an absolute value is 0.016. In other words, the regression weight for tourism organizations in the prediction of tourist intention to revisit is significant at a 1% level. Hence, the hypothesis that tourism organizations significantly affect tourist intention to revisit is duly supported.
4.4.7 Testing mediations
The testing mediations contained six hypotheses that need for the assessment of indirect effect. This study intended to test the hypotheses concerning the mediating effects of tourist satisfactions constructs in the relationship between the exogenous construct and the endogenous construct.
4.4.8 Hypotheses 7
Table 6 below shows the results of the bootstrapping findings for tourism operators on tourist intention to revisit constructs, and the direct effect of the same route is 0.010, while the indirect effect is 0.608. This indicates that there is no mediating effect on tourist satisfactions and the indirect effect is less than the direct effect between tourist operators and tourist intention to revisit relationships.
The findings in Table 5 also show that the direct effect is significant and the indirect effect is insignificant. Therefore, it can be concluded that the bootstrapping findings in Table 6 are no mediation effects because the indirect effect is insignificant.
Table 5. Hypotheses testing
|
Construct |
Path |
Construct |
Estimate |
S.E |
C.R |
P-Value |
Result |
|
Tourist intention to revisit |
<--- |
Tourist operators |
0.428 |
0.093 |
4.587 |
*** |
Significant |
|
Tourist intention to revisit |
<--- |
Event managements |
0.205 |
0.102 |
2.017 |
0.044 |
Significant |
|
Tourist intention to revisit |
<--- |
Local communities |
0.219 |
0.097 |
2.254 |
0.024 |
Significant |
|
Tourist intention to revisit |
<--- |
Investments |
-0.265 |
0.086 |
-3.063 |
0.002 |
Significant |
|
Tourist intention to revisit |
<--- |
Educational institutions |
0.767 |
0.257 |
2.99 |
0.003 |
Significant |
|
Tourist intention to revisit |
<--- |
Tourism organizations |
-1.395 |
0.577 |
-2.418 |
0.016 |
Significant |
|
Tourist satisfactions |
<--- |
Tourism operators |
-0.029 |
0.049 |
-0.586 |
0.558 |
Insignificant |
|
Tourist satisfactions |
<--- |
Event Managements |
-0.01 |
0.056 |
-0.169 |
0.866 |
Insignificant |
|
Tourist satisfactions |
<--- |
Local Communities |
0.066 |
0.049 |
1.36 |
0.174 |
Insignificant |
|
Tourist satisfactions |
<--- |
Investments |
-0.006 |
0.047 |
-0.126 |
0.9 |
Insignificant |
|
Tourist satisfactions |
<--- |
Educational institutions |
-0.299 |
0.084 |
-3.558 |
*** |
Significant |
|
Tourist satisfactions |
<--- |
Tourism organizations |
0.962 |
0.088 |
10.934 |
*** |
Significant |
(*** P values is less than 0.0001 statistically highly significant)
Table 6. Bootstrapping result for tourist satisfactions in the relationship between tourism operators and tourist intention to revisit Terengganu
|
The Standardized Indirect Effects: Tourism operators to Tourist intention to revisit = 0.608 |
||||
|
Construct |
Tourism operators |
Tourist satisfactions |
Tourist intention to revisit |
|
|
Tourist satisfactions |
0.00 |
0.00 |
0.00 |
|
|
Tourist intention to revisit |
0.608 |
0.00 |
0.00 |
|
|
The P-value (indirect effects) Tourism operators to Tourist intention to revisit = 0.692 |
||||
|
Construct |
Tourism operators |
Tourist satisfactions |
Tourist intention to revisit |
|
|
Tourist satisfactions |
... |
... |
... |
|
|
Tourist intention to revisit |
0.692 |
... |
... |
|
|
The Standardized Direct Effects: Tourism operators to Tourist intention to revisit = 0.010 |
||||
|
Construct |
Tourism operators |
Tourist satisfactions |
Tourist intention to revisit |
|
|
Tourist satisfactions |
0.00 |
0.00 |
0.00 |
|
|
Tourist intention to revisit |
0.010 |
0.00 |
0.00 |
|
|
The P-value (Direct Effects) Tourism operators to Tourist intention to revisit = 0.010 |
||||
|
Construct |
Tourism operators |
Tourist satisfactions |
Tourist intention to revisit |
|
|
Tourist satisfactions |
... |
... |
... |
|
|
Tourist intention to revisit |
0.010 |
... |
... |
|
|
The Significance of Indirect and Direct Effects |
||||
|
|
Indirect Effect (a × b) |
Direct Effect (c) |
||
|
Bootsrapping Result |
0.608 |
0.010 |
||
|
Bootsrapping P-Value |
0.692 |
0.010 |
||
|
Result |
Insignificant |
Significant |
||
|
Type of Mediation |
Not Mediation |
|||
4.4.9 Hypotheses 8
Table 7 below shows the results of the bootstrapping findings for event managements on tourist intention to revisit constructs, and the direct effect of the same route is 0.126, while the indirect effect is 0.767. This indicates that there is no mediating effect on tourist satisfactions and the indirect effect is less than the direct effect between event managements and tourist intention to revisit relationships.
The findings in Table 5 also show that the direct effect is insignificant and the indirect effect is insignificant. Therefore, it can be concluded that the bootstrapping findings in Table 7 are partial mediation effects because the indirect effect is insignificant.
Table 7. Bootstrapping result for tourist satisfactions in the relationship between event managements and tourist intention to revisit Terengganu
|
The Standardized Indirect Effects: Event managements to Tourist intention to revisit = 0.767 |
||||
|
Construct |
Event managements |
Tourist satisfactions |
Tourist intention to revisit |
|
|
Tourist satisfactions |
0.00 |
0.00 |
0.00 |
|
|
Tourist intention to revisit |
0.767 |
0.00 |
0.00 |
|
|
The P-value (indirect effects) Event Managementsto Tourist intention to revisit = 0.868 |
||||
|
Construct |
Event managements |
Tourist satisfactions |
Tourist intention to revisit |
|
|
Tourist satisfactions |
... |
... |
... |
|
|
Tourist intention to revisit |
0.868 |
... |
... |
|
|
The Standardized Direct Effects: Event Managements s to Tourist intention to revisit = 0.126 |
||||
|
Construct |
Event managements |
Tourist satisfactions |
Tourist intention to revisit |
|
|
Tourist satisfactions |
0.00 |
0.00 |
0.00 |
|
|
Tourist intention to revisit |
0.126 |
0.00 |
0.00 |
|
|
The P-value (Direct Effects) Event Managements to Tourist intention to revisit = 0.126 |
||||
|
Construct |
Event managements |
Tourist satisfactions |
Tourist intention to revisit |
|
|
Tourist satisfactions |
... |
... |
... |
|
|
Tourist intention to revisit |
0.126 |
... |
... |
|
|
The Significance of Indirect and Direct Effects |
||||
|
|
Indirect Effect (a × b) |
Direct Effect (c) |
||
|
Bootsrapping Result |
0.767 |
0.126 |
||
|
Bootsrapping P-Value |
0.868 |
0.126 |
||
|
Result |
Insignificant |
Insignificant |
||
|
Type of Mediation |
Not Mediation |
|||
4.4.10 Hypotheses 9
Table 8 below shows the results of the bootstrapping findings for local communities on tourist intention to revisit constructs, and the direct effect of the same route is 0.156, while the indirect effect is 0.057. This indicates that there is no mediating effect on tourist satisfactions and the indirect effect is less than the direct effect between local communities and tourist intention to revisit relationships.
The findings in Table 5 also show that the direct effect is insignificant and the indirect effect is insignificant. Therefore, it can be concluded that the bootstrapping findings in Table 8 are no mediation effects because the indirect effect is insignificant.
Table 8. Bootstrapping result for tourist satisfactions in the relationship between local communities and tourist intention to revisit Terengganu
|
The Standardized Indirect Effects: Local communities to Tourist intention to revisit = 0.057 |
||||
|
Construct |
local communities |
Tourist satisfactions |
Tourist intention to revisit |
|
|
Tourist satisfactions |
0.00 |
0.00 |
0.00 |
|
|
Tourist intention to revisit |
0.057 |
0.00 |
0.00 |
|
|
The P-value (indirect effects) Local communities to Tourist intention to revisit = 0.156 |
||||
|
Construct |
local communities |
Tourist satisfactions |
Tourist intention to revisit |
|
|
Tourist satisfactions |
... |
... |
... |
|
|
Tourist intention to revisit |
0.156 |
... |
... |
|
|
The Standardized Direct Effects: Local communities to Tourist intention to revisit = 0.125 |
||||
|
Construct |
local communities |
Tourist satisfactions |
Tourist intention to revisit |
|
|
Tourist satisfactions |
0.00 |
0.00 |
0.00 |
|
|
Tourist intention to revisit |
0.125 |
0.00 |
0.00 |
|
|
The P-value (Direct Effects) Local communities to Tourist intention to revisit = 0.125 |
||||
|
Construct |
local communities |
Tourist satisfactions |
Tourist intention to revisit |
|
|
Tourist satisfactions |
... |
... |
... |
|
|
Tourist intention to revisit |
0.125 |
... |
... |
|
|
The Significance of Indirect and Direct Effects |
||||
|
|
Indirect Effect (a × b) |
Direct Effect (c) |
||
|
Bootsrapping Result |
0.057 |
0.125 |
||
|
Bootsrapping P-Value |
0.156 |
0.125 |
||
|
Result |
Insignificant |
Insignificant |
||
|
Type of Mediation |
Not Mediation |
|||
4.4.11 Hypotheses 10
Table 9 below shows the results of the bootstrapping findings for investments on tourist intention to revisit constructs, and the direct effect of the same route is 0.008, while the indirect effect is 0.731. This indicates that there is no mediating effect on tourist satisfactions and the indirect effect is less than the direct effect between investments and tourist intention to revisit relationships.
The findings in Table 5 also show that the direct effect is significant and the indirect effect is insignificant. Therefore, it can be concluded that the bootstrapping findings in Table 9 are no mediation effects because the indirect effect is insignificant.
Table 9. Bootstrapping result for tourist satisfactions in the relationship between investments and tourist intention to revisit Terengganu
|
The Standardized Indirect Effects: Investments to Tourist intention to revisit = 0.731 |
||||
|
Construct |
Investments |
Tourist satisfactions |
Tourist intention to revisit |
|
|
Tourist satisfactions |
0.00 |
0.00 |
0.00 |
|
|
Tourist intention to revisit |
0.731 |
0.00 |
0.00 |
|
|
The P-value (indirect effects) Investments to Tourist intention to revisit = 0.936 |
||||
|
Construct |
Investments |
Tourist satisfactions |
Tourist intention to revisit |
|
|
Tourist satisfactions |
... |
... |
... |
|
|
Tourist intention to revisit |
0.936 |
... |
... |
|
|
The Standardized Direct Effects: Investments to Tourist intention to revisit = 0.008 |
||||
|
Construct |
Investments |
Tourist satisfactions |
Tourist intention to revisit |
|
|
Tourist satisfactions |
0.00 |
0.00 |
0.00 |
|
|
Tourist intention to revisit |
0.008 |
0.00 |
0.00 |
|
|
The P-value (Direct Effects) Investments to Tourist intention to revisit = 0.008 |
||||
|
Construct |
Investments |
Tourist satisfactions |
Tourist intention to revisit |
|
|
Tourist satisfactions |
... |
... |
... |
|
|
Tourist intention to revisit |
0.008 |
... |
... |
|
|
The Significance of Indirect and Direct Effects |
||||
|
|
Indirect Effect (a × b) |
Direct Effect (c) |
||
|
Bootsrapping Result |
0.731 |
0.008 |
||
|
Bootsrapping P-Value |
0.936 |
0.008 |
||
|
Result |
Insignificant |
Significant |
||
|
Type of Mediation |
Not Mediation |
|||
4.4.12 Hypotheses 11
Table 10 below shows the results of the bootstrapping findings for educational institutions on tourist intention to revisit constructs, and the direct effect of the same route is 0.004, while the indirect effect is 0.008. This indicates that there is a mediating effect on tourist satisfactions and the indirect effect is greater than the direct effect between educational institutions and tourist intention to revisit relationships.
The findings in Table 5 also show that the direct effect and the indirect effect are significant. Therefore, it can be concluded that the bootstrapping findings in Table 10 are partial mediation effects because the direct effect is significant.
Table 10. Bootstrapping result for tourist satisfactions in the relationship between educational institutions and tourist intention to revisit Terengganu
|
The Standardized Indirect Effects: Educational institutions to Tourist intention to revisit = 0.008 |
||||
|
Construct |
Educational institutions |
Tourist satisfactions |
Tourist intention to revisit |
|
|
Tourist satisfactions |
0.00 |
0.00 |
0.00 |
|
|
Tourist intention to revisit |
0.008 |
0.00 |
0.00 |
|
|
The P-value (indirect effects) Educational institutions to Tourist intention to revisit = 0.004 |
||||
|
Construct |
Educational institutions |
Tourist satisfactions |
Tourist intention to revisit |
|
|
Tourist satisfactions |
... |
... |
... |
|
|
Tourist intention to revisit |
0.004 |
... |
... |
|
|
The Standardized Direct Effects: Educational institutions to Tourist intention to revisit = 0.004 |
||||
|
Construct |
Educational institutions |
Tourist satisfactions |
Tourist intention to revisit |
|
|
Tourist satisfactions |
0.00 |
0.00 |
0.00 |
|
|
Tourist intention to revisit |
0.004 |
0.00 |
0.00 |
|
|
The P-value (Direct Effects) Educational institutions to Tourist intention to revisit = 0.004 |
||||
|
Construct |
Educational institutions |
Tourist satisfactions |
Tourist intention to revisit |
|
|
Tourist satisfactions |
... |
... |
... |
|
|
Tourist intention to revisit |
0.004 |
... |
... |
|
|
The Significance of Indirect and Direct Effects |
||||
|
|
Indirect Effect (a × b) |
Direct Effect (c) |
||
|
(Cont.) |
||||
|
Bootsrapping Result |
0.008 |
0.004 |
||
|
Bootsrapping P-Value |
0.004 |
0.004 |
||
|
Result |
Significant |
Significant |
||
|
Type of Mediation |
Partial Mediation since direct is also significant |
|||
4.4.13 Hypotheses 12
Table 11 below shows the results of the bootstrapping findings for tourism organizations on tourist intention to revisit constructs, and the direct effect of the same route is 0.009, while the indirect effect is 0.013. This indicates that there is a mediating effect on tourism satisfactions and the indirect effect is greater than the direct effect between tourism organizations and tourist intention to revisit relationships.
The findings in Table 5 also show that the direct effect and the indirect effect are significant. Therefore, it can be concluded that the bootstrapping findings in Table 11 are partial mediation effects because the direct effect is significant.
Table 11. Bootstrapping result for tourist satisfactions in the relationship between tourist organizations and tourist intention to revisit Terengganu
|
The Standardized Indirect Effects: Tourism organizations to Tourist intention to revisit = 0.013 |
||||
|
Construct |
Tourism organizations |
Tourist satisfactions |
Tourist intention to revisit |
|
|
Tourist satisfactions |
0.00 |
0.00 |
0.00 |
|
|
Tourist intention to revisit |
0.013 |
0.00 |
0.00 |
|
|
The P-value (indirect effects) Tourism organizations to Tourist intention to revisit = 0.004 |
||||
|
Construct |
Tourism organizations |
Tourist satisfactions |
Tourist intention to revisit |
|
|
Tourist satisfactions |
... |
... |
... |
|
|
Tourist intention to revisit |
0.004 |
... |
... |
|
|
The Standardized Direct Effects: Tourism organizations to Tourist intention to revisit = 0.009 |
||||
|
Construct |
Tourism organizations |
Tourist satisfactions |
Tourist intention to revisit |
|
|
Tourist satisfactions |
0.00 |
0.00 |
0.00 |
|
|
Tourist intention to revisit |
0.009 |
0.00 |
0.00 |
|
|
The P-value (Direct Effects) Tourism organizations to Tourist intention to revisit = 0.009 |
||||
|
Construct |
Tourism organizations |
Tourist satisfactions |
Tourist intention to revisit |
|
|
Tourist satisfactions |
... |
... |
... |
|
|
Tourist intention to revisit |
0.009 |
... |
... |
|
|
The Significance of Indirect and Direct Effects |
||||
|
|
Indirect Effect (a × b) |
Direct Effect (c) |
||
|
Bootsrapping Result |
0.013 |
0.009 |
||
|
Bootsrapping P-Value |
0.004 |
0.009 |
||
|
Result |
Significant |
Significant |
||
|
Type of Mediation |
Partial Mediation since direct is also significant |
|||
To answer the research questions and test the hypotheses, SEM analysis has been conducted and measured the model’s normality of data, undimensionality, validity and realibity. The undemensionality is achieved where all factor loadings are above 0.60. Meanwhile, validity is achieved by assessing the convergent vailidity, construct validity and discriminant validity. All values of all constructs in the measurement model were above 0.50 and this indicated that the convergent vailidity is achieved. Next, all items in the measurement model were free of redundancy and attained discriminant validity. Furthermore, all fitness indexes meet the acceptance level and construct validity is achieved. Significantly, the model fit is achieved with at least one fit statistic in fix indexes that are greater than the certain figure (The Goodness of Fitness Indexes for RMSEA < 0.08, CFI > 0.9, IFI > 0.9, TLI > 0.9, Chi sq/df < 3.0). Afterward, both components which are; reliability and Average Variance Expected (AVE) have met the required level and attained achievement in reliability. Lastly, the Cronbach alpha is greater than 0.6 and AVE is above 0.5 were demonstrated reliability.
Significantly, tourist satisfactions on educational institutions is a necessity that affects the success of educational institutions and induces revisit intention towards edu-tourism industry as well [76]. Great programs by educational institutions can affect satisfaction positively and consequently, may recommend this to their relatives and friends to visit again the destination. The tourist satisfactions also show a positive mediating effect between tourist organizations and tourist intentions to revisit. This finding of who claimed that great productivity of tourism organizations could lead and encourage both new and repeat tourists and this mission can best be accomplished by ensuring tourist satisfactions [77].
On the other hand, the hypothesis test for mediating effects found that hypotheses H7, H8, H9 and H10 are not supported. In conclusion, tourist satisfactions seemed to fail to significantly mediate the relationship between tourism operators, event managements, local communities and investments toward tourist intention to revisit. The findings who define that the importance of tourism operator’s services in the destination will ensure the satisfaction or dissatisfaction among tourists [56]. The more tourist displeasure on tourism operators, the high intention degree for them to disengage in satisfactions which lead to non-revisit intention concerning the bad service provided. Tourism operators should note that enforcing educational tourism programs requires adaptation in socio-cultural, environmental and economic structures which help them to build capacity in engaging the development of edu-tourism plans.
On the other hand, event managements that failed to meet expectations caused dissatisfaction among tourists and will conversely result in insignificant tourist satisfactions in motivating them to revisit the destination anymore [78]. Event managements need to provide higher quality and offer great experience activities in any event conducted at the destination. Thus, this will increase tourist satisfactions with event managements and increase repeat visits.
The next findings indicated that tourist satisfactions have no mediating effect on local communities at edu-tourism destinations where the less mature local communities interact with tourist, the fewer repeaters tourist will come due to dissatisfaction [59]. Hence the local communities need to interact positively which contributes influence the level of satisfaction among tourists and therefore affects their revisit intention.
Bad investments which drive sceneries of low entrepreneurs’ skills, low tourism business activities and facilities will sedate tourist satisfactions level and cause them not to revisit [61]. Therefore, is essential to examine and formulate a strategic marketing plan for the investment to persuade tourists to revisit.
6.1 Practical contributions
Tourism operators need to understand their tourists needs in connecting and delivering satisfaction services to tourists. Tourism operators need to add a positive impact, keep an honest marketing communication, give more than their customer expects and be different from their competitors. Tourism operators need to be creative to attract tourists’ attention and create excitement for their tourism products. They need to make sure that they advertise the best picture of destinations that depicts fantastic tours.
By identifying needs in the marketplace, tourism operators could build stages of product development based on the target market and these are tailored to visitors’ needs which will improve the profitability of their tourism business [79].
Tourism operators could conduct a tour approach using a new perspective such as virtual reality to create an interactive tour. This could help them to build trust and satisfaction among tourists and visitors. New technology such as virtual reality has become a phenomenon in both tourism destination marketing and on-site experience and could overcome certain industries’ challenges such as over-tourism which creates an alternative to traditional travel [80].
Enhancing tourist satisfaction and fostering loyalty can be achieved through virtual experiences, thereby providing added value that encourages tourists to choose a destination. By offering pre-visit virtual experiences, tourism brands can significantly enhance the overall tourism brand experience [80]. Tourism operators should be creative and avoid poor management of tourism operators in practicing determinant factors content will lead to a decrease in the future intention of a revisit. Hence, it is recommended that tourist operators need to adapt and fully comprehend determinant factors concepts in edu-tourism industries.
Tourists are more satisfied when they perceived higher quality, highly involved and experienced great activities offered in any event conducted at the destination. Hence, event managers need to realize the opportunity of hosting major events to address and change ‘outdated’ tourism strategies. Event managers also must ensure a continuous link between legislative (especially the public sector authorities) for tourism marketing, various related government sectors, private event agencies and local community links. Event managements need to create a powerful, dedicated event marketing campaign to promote the edu-tourism destination; that is supported by all stakeholders. Event managers also could promote accessibility (distribution) of the event through Fan Parks and employ famous public figures to support the edu-tourism event and enhance communication campaigns towards visitors.
Event management carried out activities that also promote and develop rural tourism. Through tourism events, they created interactivity of selective modalities of tourism and its positive effects on the destination. Based on that attitudes, event management contributes significance of the elements of local events with recognition and an image of the destination and they need to explore the selected tourism forms, as well their role in the creation of innovative edu-tourism products. Events selection for the edu-tourism portfolio needs to be implemented by event managers to reflect educational expressions that are truly owned by the destination. Furthermore, they need to determine the best ways to enhance the visitor and tourist experience to build great satisfaction. Event management plays a crucial role in promoting and developing rural tourism by organizing activities that encourage interaction with various tourism modalities. They organized events that have positive effects on the destination by generating recognition and enhancing its image. vent management recognizes the significance of local events and aims to explore specific forms of tourism that contribute to the creation of innovative educational tourism products [81].
The merging of education with tourism industries has converged education facilitates, mobility and learning to become an important part of a tourist’s experience. Hence, Terengganu could become more successful if they can link both the education and tourism industries as a line of approach for local or international exchange and learning. Furthermore, international edu-tourists from emerging economies will not stop studying abroad if edu-tourist resources in Terengganu satisfy their needs. These discoveries are useful in edu- tourism product development activities in Terengganu where it helps to plan tourism product segmentation, design tourism promotion programs, and develop destination decisions.
6.2 Theoretical contributions
Liao et al. [82] suggest that the theory of planned behavior be employed as a useful instrument for investigating tourists’ behavior where it attempts to examine the theory model which are: attitude, perceived behavior control and subjective norm that can determine tourists’ satisfaction in edu-tourism. The satisfied tourist is more likely to revisit the same place for transactions and they are willing to share their positive experiences with others. The positive experiences from satisfaction will introduce word-of-mouth recommendations in terms of marketing that are conceived as the most reliable and one of the most attempted after information sources for potential tourists [83]. Hence, edu-tourism players need to observe the impact of tourist satisfaction on behavioral intentions such as intention to revisit which is imbalance from different perspectives.
This study aimed to investigate factors that effect tourist intention to revisit in edu-tourism industry in Terengganu with the mediating effect of tourist satisfactions. The study was based on theory planned behavior whereby a basic cognitive process or belief towards a target or behavior could affect tourists’ attitudes which finally increases the behavior intention and loyalty that lead to their intention to revisit. It also provides particular findings regarding bodies involved in edu-tourism environments and proposes a framework that empirically investigates from the tourists’ perspectives in edu-tourism segmentations. By utilizing the theory of planned behavior, this framework provides an in-depth understanding of tourist behavior that represent significant constructs which are; tourism operators, event managements, local communities, investments, educational institution, tourism organizations and tourist satisfactions.
Moreover, this study examines and provide evidence that tourism operators, event managements, local communities, investments, educational institution, tourism organizations have a significant effect on tourist intention to revisit edu-tourism industry in Terengganu. Tourist satisfactions seemed to fail to significantly mediate the relationship between tourism operators, event managements, local communities and investments toward tourist intention to revisit. However, tourist satisfactions mediates between educational institutions and tourism organizations. The confirmation of the mediating roles of tourist satisfactions commitment in this study has an important implication for management in edu-tourism fields. The study resulted in several theoretical and practical contributions to tourism organizations, tourism operators, event managers, tourism operators, academicians and government sectors.
Purposely, various limitations have been played up in the study whereases these limitations could open the possibility to improve future related research. Despite the apparent above, to drive the research work to the next degree, some suggestions are addressed. This is supposed to further enhance the literature on subjects being explored and to provide more empirical data for experts to provide a clearer understanding of the needs of tourists in terms of developing edu-tourism segmentations.
The conclusions and results of this study should be considered with few limitations. Overall results using SEM is not completely generalizable even though the sample size had the requisite qualities to test the hypotheses. The significance of the research model is limited by the sample size which may conduce more or less error to the insignificant results found in this study. Furthermore, this research however has been explored in Terengganu where cultural variations will exist between Terengganu and other developed and modern states.
Several recommendations can be carefully considered in future research. For future studies, a triangulation or mixed process is suggested where it is using both qualitative and quantitative methods. The process of triangulation will include an advanced value of data accuracy to improve the awareness of the researcher about the specific subject which will be explored. Additionally, the most appropriate approach to examining human behavior in social science is to incorporate both the questionnaire and the interview into the data collection process.
The relevance of current findings able to be evaluated by reproducing and enhancing this research in other states and countries as well as other environments in the tourism industry. The external evaluation of the framework constructed in this research would provide a basis for understanding the cultural and regional patterns in tourist behavior.
I would like to express my profound gratitude to my supervisor, Professor Dr. Ahmad Syukri bin Yazid, whose expertise, understanding, and patience, added considerably to my graduate experience. I appreciate his vast knowledge, skill and his assistance which provides insight and expertise that greatly assisted the research. Finally, I would like to thank those people, such as the postgraduate students who provided much information needed for my studies. Also deserve thanks to Pusat Pengajian Siswazah, Universiti Sultan Zainal Abidin (Unisza), which allowed me to undertake this research and allow me to attend conferences and meet so many interesting people.
[1] Hamid, M.A., Isa, S.M., Kiumarsi, S. (2021). Sustainable tourism practices and business performance from the tour operators’ perspectives. Anatolia, 32(1): 23-32. https://doi.org/10.1080/13032917.2020.1830135
[2] Hassan, H., Nezakati, H. (2014). Hospitality and Tourism Sustainability. UPM Press.
[3] Rosnan, H., Abdullah, N.C. (2018). Challenges in Upholding Edutourism Initiatives. Asian Journal of Behavioural Studies, 3(14): 1. http://dx.doi.org/10.21834/ajbes.v3i14.161
[4] Kumar, D. (2016). Educational tourism in lndia: Past, Present and Future.
[5] Tomasi, S., Paviotti, G., Cavicchi, A. (2020). Educational tourism and local development: The role of universities. Sustainability, 12(17): 6766. https://doi.org/10.3390/su12176766
[6] The Star Online. (2017). https://www.thestar.com.my/lifestyle/entertainment/arts/2013/08/05/whats-eating-the-arts/.
[7] Wang, Y. (2020). Factors that affecting customer satisfaction among local tourists toward budget hotels in Malaysia. World Scientific Research Journal, 6(4), 65-85. http://eprints.utar.edu.my/id/eprint/2017.
[8] Rahman, M.M., Haque, A., Suib, F.H., Kabir, S.M.H. (2021). Students’ learning need and perceived value in selection of educational institutions mediated by satisfaction from edu-tourism context in Malaysia. International Journal of Innovative Research and Publications, 1(1): 12-25. https://doi.org/10.51430/ijirp.2021.11.002
[9] Hawkins, D.E., Goldblatt, J.J. (1995). Event management implications for tourism education. Tourism Recreation Research, 20(2): 42-45. https://doi.org/10.1080/02508281.1995.11014747
[10] Robert, C.M., Morrison, A. (1992). The Tourism System: An Introductory Text. Amerika Serikat: Prentice Hall. https://doi.org/10.1177/004728758702500313
[11] Burkart, A.J. (1981). Tourism: Past, present and future (Ed. 2). Wm Collins & Sons & Co.
[12] Ojo, B.Y., Yusof, R.N.R. (2020). Influence of policy strategies, instruments, and Malaysians’ attitude on sustainable edu-tourist industry in Malaysia. Journal of Tourism & Management Research, 4(2): 497-514. https://iiste.org/Journals/index.php/JTHS/article/view/27717.
[13] Sie, L., Patterson, I., Pegg, S. (2016). Towards an understanding of older adult educational tourism through the development of a three-phase integrated framework. Current Issues in Tourism, 19(2): 100-136. https://doi.org/10.1080/13683500.2015.1021303
[14] Sharma, A. (2015). Educational tourism: Strategy for sustainable tourism development with reference of Hadauti and Shekhawati regions of Rajasthan, India. Journal of Business Economics and Information Technology, 11(4): 1-12.
[15] Maga, A., Nicolau, P. (2018). Conceptualizing educational tourism and the educational tourism potential (evidence from ASEAN countries). In International Scientific Conference" Competitive, Sustainable and Secure Development of the Regional Economy: Response to Global Challenges"(CSSDRE 2018), pp. 343-348. Atlantis Press. https://doi.org/10.2991/cssdre-18.2018.72
[16] Ojo, B.Y., Yusofu, R.N.R. (2013). Edutourism: international student’s decision making process in selecting a host university in Malaysia. European Journal of Business and Management, 5(30): 51-56. https://www.iiste.org/Journals/index.php/EJBM/article/view/9444/9649.
[17] Unković, S. (2017). Talent development and education in tourism. The European Journal of Applied Economics, 14(2): 70-75. http://dx.doi.org/10.5937/ejae14-15571
[18] Kosmo Online. (2017). Pakej edutourism di universiti awam. https://repo.uum.edu.my/id/eprint/15334.
[19] Chandrashekar, R., Ann, T.J. (2021). Analysis of Edu-Tourism Factors among Students in Public Universities in Johor. Research in Management of Technology and Business, 2(2): 241-254. https://publisher.uthm.edu.my/periodicals/index.php/rmtb/article/view/5138/1100.
[20] Lim, C.C., Lim, H.L., Ng, S.Y., Phan, Y.X. (2015). Determinants of travel intention among foreign student in Malaysia-perspective from push-pull motivations. http://eprints.utar.edu.my/1784/1/MK-006-1501-Travel-Intention.pdf.
[21] Wijayanti, A., Damanik, J., Fandeli, C. (2017). Analysis of Supply and Demand to Enhance Educational Tourism Experience in the Smart Park of Yogyakarta, Indonesia. Economies, 5(4): 42. https://doi.org/10.3390/ECONOMIES5040042
[22] da Silva, M.A., Costa, R.A., Moreira, A.C. (2018). The influence of travel agents and tour operators' perspectives on a tourism destination. The case of Portuguese intermediaries on Brazil's image. Journal of Hospitality and Tourism Management, 34: 93-104. http://dx.doi.org/10.1016/j.jhtm.2018.01.002
[23] Mihajlović, I. (2017). The importance of local events for positioning of tourist destination. European Journal of Social Science Education and Research, 4(4): 228-239. http://dx.doi.org/10.26417/ejser.v10i2.p228-239
[24] Nguyen, Q.H. (2021). Impact of investment in tourism infrastructure development on attracting international visitors: A nonlinear panel ARDL approach using Vietnam’s data. Economies, 9(3): 131. https://doi.org/10.3390/economies9030131
[25] Ojo, B.Y., Yusof, R.N.R. (2019). The contemporary edu-tourism destination selection process: a structural regression model. Ottoman: Journal of Tourism and Management Research, 4(2): 497-514. https://doi.org/10.26465/ojtmr.2018339524
[26] Afthanorhan, A., Awang, Z., Fazella, S. (2017). Perception of tourism impact and support tourism development in Terengganu, Malaysia. Social Sciences, 6(3): 106. http://dx.doi.org/10.3390/socsci6030106
[27] Zulkefli, N.S., Jaafar, M., Marzuki, A. (2017). Government Involvement on Tourism Policy and Programmes Implementation: A Case Study in Perhentian Island. Postgraduate Colloquium & Social Sciences Postgraduate International Seminar. https://core.ac.uk/download/pdf/158571274.pdf.
[28] Fazil, F., Razak, M.I.M., Marshahadi, F., Yusof, A.M., Sakrani, S.N.R., Wahab, S.A. (2014). Measuring tourist propensity to visit heritage city of Melaka, Malaysia. International Journal of Economics, Commerce and Management, II(12): 1-12. http://ijecm.co.uk/wp-content/uploads/2014/12/21228a.pdf.
[29] Lu, C., Liujien, W., Hashim, R. (2018). An Importance Performance Analysis (IPA) of Tour Guide in Mainland China. International Journal of Academic Research in Business and Social Sciences, 8(14): 200-217. http://dx.doi.org/10.6007/IJARBSS/v8-i14/6036
[30] Aslan, A., Yasar, A.G., Cetin,G., Akova,O., Balik, M., Demirciftci, T. (2015). The package tour experiences and tourist satisfaction. In tourism engagement: Co-creating well-being. Proceedings of the 6th Advances in Tourism Marketing Conference, September, 8-10, 2015, Joensuu, Finland.
[31] Lill, G. (2015). The impacts of events on local community. Case: City of Tallinn. Aalborg. https://projekter.aau.dk/projekter/files/210109303/THESIS.pdf.
[32] Sharif, N.M., Lonik, K.A.T. (2020). Physical Environment and Residents’ Perception towards Tourism Impacts: A Case Study of Tioman Island. http://dx.doi.org/10.6007/IJARBSS/v10-i11/7948
[33] Tran, H., Hwang, Y., Yu, C., Yoo, S. (2018). The effect of destination social responsibility on tourists’ satisfaction: The mediating role of emotions. Sustainability, 10(9): 3044. https://doi.org/10.3390/su10093044
[34] Khan, A., Bibi, S., Lorenzo, A., Lyu, J., Babar, Z.U. (2020). Tourism and development in developing economies: A policy implication perspective. Sustainability, 12(4): 1618. https://doi.org/10.3390/su12041618
[35] Jovanović, S., Ivana, I.L.I.Ć. (2016). Infrastructure as important determinant of tourism development in the countries of Southeast Europe. Ecoforum Journal, 5(1): 1-34.
[36] Da Wan, C., Sirat, M., Razak, D.A. (2018). Education in Malaysia towards a developed nation. https://www.iseas.edu.sg/images/pdf/ISEASEWP2018-4Wan.pdf.
[37] Rahimizhian, S., Avci, T., Eluwole, K.K. (2020). A conceptual model development of the impact of higher education service quality in guaranteeing edu‐tourists' satisfaction and behavioral intentions. Journal of Public Affairs, 20(3): e2085. https://doi.org/10.1002/pa.2085
[38] Mosbah, A., Al Khuja, M.S.A. (2015). A review of tourism development in Malaysia. European Journal of Business and Management, 6(5): 1-9.
[39] Constantin, C.P., Ispas, A., Candrea, A.N. (2022). Examining the Relationships between Visitors Profile, Satisfaction and Revisit Intentions: Evidence from Romanian Ecotourism Destinations. Land, 11(2): 186. http://dx.doi.org/10.3390/land11020186
[40] Nguyen Viet, B., Dang, H.P., Nguyen, H.H. (2020). Revisit intention and satisfaction: The role of destination image, perceived risk, and cultural contact. Cogent Business & Management, 7(1): 1796249. https://doi.org/10.1080/23311975.2020.1796249
[41] Assaker, G., Hallak, R. (2013). Moderating effects of tourists’ novelty-seeking tendencies on destination image, visitor satisfaction, and short- and long-term revisit intentions. Journal of Travel Research, 52(5): 600-13. https://doi.org/10.1177/0047287513478497
[42] Viet, B.N., Phuc, D.H., Nguyen, H.H. (2020). Revisit intention and satisfaction: The role of destination image, perceived risk, and cultural contact. Cogent Business & Management, 7(1): 1-20. https://doi.org/10.1080/23311975.2020.1796249
[43] Khasawneh, M.S. , Alfandi, A.M. (2019). Determining behaviour intentions from the overall destination image and risk perception. Tourism and Hospitality Management, 25(2): 355-375. http://dx.doi.org/10.20867/thm.25.2.6
[44] Adinegara, G.N.J., Suprapti, N.W.S., Yasa, N.N.K., Sukaatmadja, I.P.G. (2017). Factors that influences tourist’s satisfaction and its consequences. European Journal of Business and Management, 9(8): 39-50. https://core.ac.uk/download/pdf/234627773.pdf.
[45] Abbasi, G.A., Kumaravelu, J., Goh, Y.N., Singh, K.S.D. (2021). Understanding the intention to revisit a destination by expanding the theory of planned behaviour (TPB). Spanish Journal of Marketing-ESIC, 25(2): 282-311. https://doi.org/10.1108/SJME-12-2019-0109
[46] Ajzen, I., Schmidt, P. (2020). Changing behavior using the theory of planned behavior. In the Handbook of Behavior Change, pp. 17-31. Cambridge University Press. https://doi.org/10.1017/9781108677318.002
[47] Jackowitz, L., Latkova, P., Tierney, P., Strebel, J. (2017). Understanding coastal tourists' behavioral intentions toward nature-based experiences. Journal of Tourism Insights, 7(1): 6. https://doi.org/10.9707/2328-0824.1063
[48] Cruises, R.S.S. (2004). Defining Tomorrow’s Tourism Product: Packaging Experiences.
[49] Samat, T.P., Chairil, S.M., Huda, M.N., Jamilah, M. (2017). Preserving performing arts through homestay programme: Lesson learnt from bidayuh annah rais longhouse tourism’s experience. 2(2). http://dx.doi.org/10.33736/jbk.468.2016
[50] Krajnović, A., Gortan-Carlin, I.P. (2017). Strategic management in cultural tourism with emphasis on event management: The case study of Croatia. Ekonomska Misao i Praksa, 26(2): 791-812. https://hrcak.srce.hr/191307
[51] Rabu, M.M., Tawil, N.M., Ahmad, H., Rabu, A.R.M. (2016). Membangunkan program eco-agro-edu homestay: Kajian kes di kg. Rawa, negeri sembilan (Developing program ECO-AGRO-EDU of homestay: A case study at Kg. Rawa, Negeri Sembilan). e-Bangi. http://localcontent.library.uitm.edu.my/id/eprint/8952/1/8952.pdf.
[52] Mustafa, M. (2009). Public Art in the Federal Territory of Putrajaya: Questions of Value and Role. Wacana Seni Journal of Arts Discourse, 8: 69-96. https://ejournal.usm.my/wacanaseni/article/view/ws-vol8-2009-3. https://doi.org/10.21315/ws
[53] The South African Department of Labour. (2018). Sector Studies Research Project. Research Commissioned by department of labour south africa. https://www.labour.gov.za/DocumentCenter/Research%20Documents/2001-2009/Tourism,%20Sector%20studies%20research%20project.pdf.
[54] Woolf, K. (2006). Public Support of Performing Arts in America: Investing in the Past, Present or Future?
[55] Radhika, P.C. (2015). Development of a model for tourism for the State of Kerala. http://shodh.inflibnet.ac.in:8080/jspui/bitstream/123456789/5026/2/2_synopsis.pdf.
[56] Seetanah, B., Teeroovengadum, V., Nunkoo, R. (2020). Destination satisfaction and revisit intention of tourists: does the quality of airport services matter? Journal of Hospitality & Tourism Research, 44(1): 134-148. https://doi.org/10.1177/1096348018798446
[57] Osti, L., Disegna, M., Brida, J.G. (2012). Repeat visits and intentions to revisit a sporting event and its nearby destinations. Journal of Vacation Marketing, 18(1): 31-42. https://doi.org/10.1177/1356766711428803
[58] Akgunduz, Y., Koba, Y. (2018). Motivations of event tourism participants and behavioural intentions. Tourism and Hospitality Management, 24(2): 341-358. http://dx.doi.org/10.20867/thm.24.2.4
[59] Som, A.P.M., Badarneh, M.B. (2011). Tourist satisfaction and repeat visitation; toward a new comprehensive model. International Journal of Human and Social Sciences, 6(1): 1106-1113.
[60] Waheed, N., Hassan, Z. (2016). Influence of customer perceived value on tourist satisfaction and revisit intention: A study on guesthouses in Maldives. International Journal of Accounting, Business and Management, 4(1): 101-123.
[61] Guat, C.L. (2013). Factors Influencing the Intentions of Singaporean Tourists to Revisit Malaysia. European Journal of Tourism, 1(2): 35-43. http://eprints.usm.my/28823/1/FACTORS_INFLUENCING_THE_INTENTIONS_OF_SINGAPOREAN_TOURISTS_TO_REVISIT_MALAYSIA.pdf.
[62] García-Rodríguez, F.J., Mendoza Jiménez, J. (2015). The role of tourist destination in international students' choice of academic center: The case of erasmus programme in the Canary Islands. Journal Volume & Issue, 13(1): 175-189. https://doi.org/10.25145/J.PASOS.2015.13.012
[63] Couto, J.P.A., Batista, M.D.G.C., Botelho, D.R. (2011). Tourists' satisfaction and loyalty in the hotel business: an application to the island of São Miguel, Azores. Working Paper Series, 10(1):16-23.
[64] Sekaran, U. (2003). Research Method For Bussiness: A Skill Building Approach 4 th ed New York. John Willey and Son inc.
[65] Abdullateef, A.O., Biodun, A.B. (2014). Are international students tourists? International Journal of Business and Globalisation, 13(3): 298-306. http://dx.doi.org/10.1504/IJBG.2014.064677
[66] Sekaran, U., Bougie, R. (2016). Research Methods for Business: A Skill Building Approach. John Wiley & Sons. https://doi.org/10.1016/0024-6301(93)90168-f
[67] Park, C., Petrick, J.F. (2016). Developing the Optimal Korean Performing Arts Tourism Product for Japanese Tourists.
[68] Krejcie, R.V., Morgan, D.W. (1970). Determining sample size for research activities. Educational and Psychological Measurement. https://doi.org/10.1177/001316447003000308
[69] Hodge, D.R., Gillespie, D. (2003). Phrase completions: An alternative to Likert scales. Social Work Research, 27(1): 45-55. http://dx.doi.org/10.1093/swr/27.1.45
[70] De Vaus, D. (2002). Analyzing Social Science Data: 50 Key Problems in Data Analysis. Sage.
[71] Awang, Z. (2012). Research Methodology and Data Analysis Second Edition. UiTM Press.
[72] Awang, Z. (2014). A Handbook on Structural Equation Modeling. MPWS Rich Resources.
[73] Awang, P. (2015). SEM Made Simple: A Gentle Approach to Learning Structural Equation Modeling. MPWS Rich Publication, Bangi.
[74] Hair, J.F., Black, W.C., Babin, B.J., Anderson, R.E. (2010). Multivariate data analysis: Pearson College division. Person: London, UK.
[75] Cohen, J. (1992). A power primer. Psychological Bulletin, 112(1): 155-159. http://dx.doi.org/10.1037/0033-2909.112.1.155
[76] Lütfi, A.T.A.Y., YILDIRIM, H.M. (2010). Determining the factors that affect the satisfaction of students having undergraduate tourism education with the department by means of the method of classification tree. Tourismos: An Internatıonal Multidisciplinary Journal Of Tourism, 5(1): 73-87.
[77] Shahrivar, R.B. (2012). Factors that influence tourist satisfaction. Journal of Travel and Tourism Research (Online), 12(1): 61.
[78] Akgunduz, Y., Coşar, Y. (2018). Motivations of event tourism participants and behavioural intentions. Tourism and Hospitality Management, 24(2): 341-358. https://doi.org/10.20867/thm.24.2.4
[79] Government of Northwest Territories. (2021). Tourism product development. https://www.iti.gov.nt.ca/sites/iti/files/tourism_product_development.pdf.
[80] Godovykh, M., Baker, C., Fyall, A. (2022). VR in tourism: A new call for virtual tourism experience amid and after the COVID-19 pandemic. Tourism and Hospitality, 3(1): 265-275. https://doi.org/10.3390/tourhosp3010018
[81] Mihajlović, I., Vidak, M. (2017). The importance of local events for positioning of tourist destination. European Journal of Social Science Education and Research, 4(4): 228-239.https://doi.org/10.26417/ejser.v10i2.p228-239
[82] Liao, C., Chen, J.L., Yen, D.C. (2007). Theory of planning behavior (TPB) and customer satisfaction in the continued use of e-service: An integrated model. Computers in Human Behavior, 23(6): 2804-2822. https://doi.org/10.1016/j.chb.2006.05.006
[83] Din, N.M., Nuh, R. (2019). Consumer’s satisfaction and behaviour towards personal financing. International Journal of Entrepreneurship, 2(7): 61-79. http://dx.doi.org/10.35631/ijemp.27008