Muhammad Faisal*![]() | Titik Khawa Abdul Rahman
| Titik Khawa Abdul Rahman![]()
© 2023 IIETA. This article is published by IIETA and is licensed under the CC BY 4.0 license (http://creativecommons.org/licenses/by/4.0/).
OPEN ACCESS
This research aims to propose a strategy for equitable development by gathering information on the living conditions of people in rural areas and grouping villages based on the Community Standard of Living Index (CSLI). Rural areas often face issues such as poverty, inequality, and inadequate access to services, necessitating a rural development strategy for poverty alleviation and empowerment of rural communities. The foundation of successful survey-based research is accurately describing the practices, conditions, experiences, personal characteristics, or opinions of respondents through the questions asked. The stages of this study include the validation of 38 criteria by experts, verification and evaluation using the MOO-Fuzzy Delphi method, weighting with the RR method, village scoring, and clustering using the SOM method. The scores from all respondents were calculated and used as input for the scoring process, which determined the village score. The results indicate that 10 villages fall into the Poor Level of CSLI group. The innovation of this study lies in the method used to develop the Community Standard of Living Index for each village, providing a potential solution for addressing the lack of community participation and delays in presenting information about development conditions in villages.
rural, fuzzy delphi, indexing, clustering, rank raciprocal, MOO, SOM
The European Union has discussed a framework for sustainable rural development from 2021 to 2027, related to the growing importance of rural areas. The multiplicity of resources and their positive benefits can be influential factors for sustainable rural development [1]. With regard to the implementation of the European Union's framework, all levels of government can work together to develop rural areas.
The author's concern in this study is the prolonged delivery of the latest information about the status of villages. In addition, there has been no information source explaining the stages of implementing equitable development through village assistance programs. One research paper stated that data collection on village potential was carried out by the Central Bureau of Statistics of South Sulawesi Province every three times in 10 years but did not explain which areas had high or low village potential [2]. Village potential refers to resources or assets owned by a village that can be utilized to advance the village and improve community welfare, covering social, economic, and regional facilities and infrastructure [3].
Subsequent research stated that the Ministry of Rural and Transmigration had not provided the latest data regarding the updating of village data in Yogyakarta city up to 2022. As a result, the classification results displayed still use data from 2016, although several studies reported that some village statuses had changed [4].
The low participation of the community and village institutions in planning, implementing, and controlling village development activities, as well as the preservation of development results, has led to many natural potentials in the village remaining managed traditionally. This is due to the inability to master technology, relatively low community education, and the tendency of villagers to accept conditions as they are. Generally, the development of rural areas has not been implemented due to internal factors originating from the village, such as the lack of initiative and knowledge from the village community, and external factors originating from the government in socializing and providing assistance to rural communities [5].
Implementation of the set strategy takes about 3 to 4 months, starting with collecting information about the living conditions of the community, and then clustering villages based on the Community Standard of Living Index (CSLI), especially in villages in the Province of South Sulawesi. In this study, the Multi-Object Optimization (MOO) method is used to determine priority scales and weighting of multi-criteria to form an instrument sequence that can objectively accommodate information from the public. Research has stated that the multi-objective optimization approach can be applied in a management context to optimize solutions in complex situations and multi-criteria [6]. The clustering approach can be applied to optimize solutions in complex and multi-criteria situations. Clustering is done to group the sub-cluster centers obtained and extract the final clusters from the dataset using criteria [7].
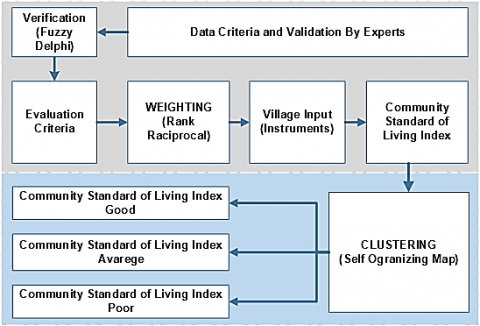
In general, the structure of this research framework is as follows: First, the process of implementing the MOO method is carried out through establishing criteria, validating, verifying, evaluating, and weighting. Second, building Village Input is done by changing the criteria into a questionnaire instrument. Third, building a Cluster Community Standard of Living Index (CSLI). The remaining parts of this study are organized as follows: Section 2 contains the literature review. Section 3 presents the methodology. Section 4 discusses the results and discussion. Finally, conclusions are provided in Section 5.
This section discusses previous research on strategies for implementing development equity, which states that so far, development decentralization has only been for specific regional contexts, such as underdeveloped regions or regions with strategic potential. Often, it is not accompanied by appropriate strategies and political nuances, especially when it comes to financial issues [8]. Although research on village development is increasing, the knowledge supporting the strategy for implementing equitable village development is still lacking. Problems of poverty, inequality, and inadequate access to services are more common in rural areas, so a rural development strategy aimed at poverty alleviation and empowerment of rural communities is needed [9].
Previous research also discussed the indicators, namely Environmental, Social, and Economic, and used the Multi-criteria Group Decision-making ELECTRE method to analyze the success rate of village development. Among other findings, it stated that to achieve sustainable regional development, it is necessary to understand the underlying criteria better and adopt appropriate policies in various parts and sectors [10]. Previous research on the Analytic Network Process (ANP) Approach was used to determine the critical factors of sustainable rural built landscapes in rural planning decision-making procedures [11]. Additionally, rural research offers considerable scope for the application of a more expansive mix of methods and increased focus [12]. This statement is an opportunity for the author to conduct research on village development strategies using Hybrid Multi-Object Optimization (MOO) and Clustering Methodologies.
Clustering is an unsupervised pattern recognition method that can reveal hidden clusters of similar observations and group them [13]. Clustering is used in many fields, such as pattern recognition, machine learning, image analysis, information retrieval, computer graphics, and bioinformatics, by grouping datasets that have similarities or do not have similarities between each cluster [14].
Research has divided the role of village settlements based on the clustering of production, ecology, undeveloped villages, settlements, and industry using the k-means clustering algorithm and Niche-based modeling to help describe various future scenarios of a village [15]. The use of the index in assessing social vulnerability can only describe the general condition of social vulnerability without indicating which factors are dominant in measuring the level of social vulnerability in the community, including community social order, geographical context, community characteristics, building environment, and accessibility [16].
One of the new topics that have piqued the interest of various science scholars today is the vitality of rural communities, which reflects the level of welfare in rural communities [17]. Research has stated that, in addition to the economy, social welfare factors are one of the fields that contribute to rural development [18]. Another study stated that poverty alleviation is one of the main problems faced in underdeveloped and developing countries, which generally refers to a lack of resources. Resources that support welfare as a standard of living for a person or society [19]. Based on the two statements of the researcher, information is obtained that the welfare and standard of living of the community can be considered goals to be achieved in the village development process.
The standard of living measure can provide a future path for a better understanding of the position of people's lives in the socio-economic field in the future [20]. On the other hand, the sustainable development of a country will be achieved if citizens can fulfill their standard of living as human beings [21]. Therefore, the standard of living index is considered an indicator to see the success of the development process of a region.
Research states that the combination of locally relevant indices and an easy-to-understand approach to presenting a set of indicators can offer decision-makers advantages over implementing HDI [22]. A study also states that the standard of living of community groups is influenced by the Original Savings Index, the Global Competitiveness Index, and per capita income [23]. However, in subsequent studies, it was stated that per capita gross domestic product is less valuable if used as an indicator of the assessment of decision-making policies regarding the level of human welfare [24]. Therefore, in this study, the measurement of the standard of living index was carried out based on several factors directly related to the living conditions of the people in a village through indicators that described the actual conditions of the community in a village, to produce an objective standard of living index output.
3.1 Research design
The theoretical contribution of research design is that research can be better evaluated in terms of understanding, theory building, theory development, and theory testing [25]. The research design refers to the plan or strategy that researchers use to guide investigation and answer research questions. The theoretical contribution of research design lies in the fact that can help this research to systematically and rigorously test theories to get generate new knowledge.
The research design can contribute to developing new methods or techniques for collecting and analyzing data. By developing innovative research designs and methods, this research can contribute to the overall advancement of the field and enable others to build the research. Overall, the theoretical contribution of research design lies in its ability to help researchers generate new knowledge and advance existing theories through rigorous and systematic. The research design is used to gather relevant data and techniques to facilitate the smooth scaling of various research operations so as to produce maximum information, it also provides the researcher with structure for planning to answer research questions or testing of hypotheses [26]. Figure 1 illustrates the research design in this research.
Figure 1. Research design
Based on the illustration shown in Figure 1 that each stage will be explained particularly in order to obtain a deep understanding.
Table 1. List of criteria
|
ID |
Code |
Criteria |
|
1 |
C1 |
Welfare status |
|
2 |
C2 |
Ownership Status of residential buildings |
|
3 |
C3 |
Status of ownership of the land of residence |
|
4 |
C4 |
Types of the widest flooring |
|
5 |
C5 |
The widest types of walls |
|
6 |
C6 |
The widest types of roofs |
|
7 |
C7 |
Widest wall quality |
|
8 |
C8 |
The widest quality of the roof |
|
9 |
C9 |
Sources of drinking water |
|
10 |
C10 |
How to get drinking water |
|
11 |
C11 |
Use of defecation facilities |
|
12 |
C12 |
Types of toilets |
|
13 |
C13 |
Fecal landfill |
|
14 |
C14 |
Main sources of illumination |
|
15 |
C15 |
Installed electrical power (PLN) |
|
16 |
C16 |
Fuel for cooking |
|
17 |
C17 |
Ownership of gas cylinders of 5.5kg or more |
|
18 |
C18 |
Telephone connection ownership (PSTN) |
|
19 |
C19 |
Ownership of a computer/laptop |
|
20 |
C20 |
Ownership of bicycles |
|
21 |
C21 |
Motorcycle ownership |
|
22 |
C22 |
Car ownership |
|
23 |
C23 |
Boat ownership |
|
24 |
C24 |
Outboard Motor Ownership |
|
25 |
C25 |
Ownership of outboard motor/tractor |
|
26 |
C26 |
Ship ownership |
|
27 |
C27 |
Ownership of the refrigerator |
|
28 |
C28 |
Ownership of air conditioning |
|
29 |
C29 |
Ownership of water heater |
|
30 |
C30 |
Ownership of Television |
|
31 |
C31 |
Ownership of gold/jewelry/savings worth 10 grams |
|
32 |
C32 |
Ownership of Land |
|
33 |
C33 |
Homeownership in other locations |
|
34 |
C34 |
There are household members who have joint businesses |
|
35 |
C35 |
Have a psc/kps |
|
36 |
C36 |
Participants of the PKH program |
|
37 |
C37 |
Raskin program participants |
|
38 |
C38 |
Participants of the KUR program |
3.2 Identification of criteria
A research stated that the foundation of any successful survey-based research is that the questions asked can be used to accurately describe the practices, conditions, experiences, personal characteristics, or opinions of the respondents [27]. Therefore, interviews were conducted with sources including local governments, experts in the field of regional development planning, and village heads to collect information as an initial stage in building a questionnaire. Asking questions is an essential component of the learning experience, which is structurally embedded in critical thinking [25]. The questionnaire format is based on 38 criteria arranged as guidelines in this study. The criteria for this research is shown in Table 1.
All criteria were obtained through an interview process with experts from representatives of academics, government, researchers and village officials totalling 16 experts.
3.3 Verification of criteria
In this study, the validation process was carried out by evaluating the criteria used as input values using the Multy Objective Optimization (MOO) Fuzzy Delphi Method (FDM). As explained that Fuzzy Delphi provides a robust framework that can handle a lack of precision and clarity, as incomplete or inaccurate information is considered a problem in decision-making [28]. The flowchart of Fuzzy Delphi is shown in Figure 2.
Figure 2. Flowchart of fuzzy delphi methodology
Based on Figure 2 is explained that the stages of the criteria evaluation process are carried out to determine the priority scale of criteria and weighting that was used in determining the village index and cluster. The process of comparing the performance of the MOO algorithm with each other is very necessary in order to guarantee the weight value of each criterion for the evaluation process [29]. The performance of the MOO algorithm is assessed based on the balance between convergence and diversity of non-dominated solutions which are measured using different evaluation criteria than quality performance indicators. The threshold value is calculated using the following formula.
$d(\bar{m}, \bar{n})=\sqrt{\frac{1}{3} *[(m 1+m 2+m 3)]}$ (1)
As the data analysis is based on the triangular fuzzy number where it aims to get threshold value (d). The first condition to be followed is threshold value (d) must be less or equal to 0.2. Therefore, all experts are considered to have reached the agreement and made a consensus.
The aggregate calculation process is a fuzzy evaluation process to determine the value of the fuzzy score that obtain using the following formula:
$A_{M a x}=\frac{1}{3} *(M 1+M 2+M 3)$ (2)
Finally, stage is determining the position or ranking of each criteria as follows:
$\bar{A}=\left[\frac{\overline{A 1}}{\frac{\overline{A 2}}{A \ldots n}}\right] \quad A=1 . . m$
The Delphi method allows research to act independently and adapt its dynamics to research objectives and make strategic decisions because an objective opinion of a group of specialists always is of higher quality than the opinion of one individual.
3.4 Validation of criteria
A fuzzy scale is a type of measurement scale that used in fuzzy logic, which is a mathematical approach to dealing with uncertain or unclear information using linguistic terms to describe the degree of membership of an object in a particular set. In this study, a validation process was carried out on the criteria through determining the approval weight and fuzzy scale, then all assessments by experts will be processed using the fuzzy delphi method to find out the total score against each criterion. Fuzzy scales are shown in Table 2.
Table 2. Fuzzy scale for validation of criteria
|
Weight |
Scale |
Statement |
|
5 |
1 |
Totally Agree |
|
4 |
0.8 |
Agree |
|
3 |
0.6 |
Simply Agree |
|
2 |
0.4 |
Less Agree |
|
1 |
0.2 |
Disagree |
Table 2 shows guidelines and instructions to experts as a provision for the declaration and approval of each criteria. Based on the data in Table 2. On a traditional 0.2 to 1 scale, a score of 0.6 would represent the exact midpoint between low and high scores. However, on a fuzzy scale, the term Simply Agree can be used instead to describe the uncertainty or vagueness of a particular concept.
3.5 Weighting of criteria
In this Research the focus of the research is to determine the index value of the community standard of living index. After the criteria evaluation stage by the expert is completed. Respondents as representatives from each village will provide answers through instrument data as village input, and then the process of calculating the score for the village will be carried out according to the results of the answers from the respondents, the next step is to carry out a weighting process for all criteria using the Rank Reciprocal (RR) algorithm. The village score will be a measure of the CSLI value of a village and is also used as an input value in the self-organizing map algorithm as the initial stage of the clustering process. The process of weighting the criteria uses the Rank Reciprocal (RR) method to determine the magnitude of the weight values and works by emphasizing that the order of indexes has different importance values. The RR method is formulated as follows:
$W_j(\mathrm{RR})=\frac{1 / R_j}{\sum_{k=1}^n\left(1 / R_k\right)}$ (3)
Descriptions:
Wj = Weighted value (criteria/subcriteria)
Rj = Rank order value (criteria/subcriteria)
Rk = Total number of goals(criteria/subcriteria).
For giving weighting to each criteria is done using Rank Reciprocal method. The flowchart is given in Figure 3.
Figure 3. Flowchart rank reciprocal algorithm
Weighting in the Rank Reciprocal method gives a value to each criteria based on its ranking position. The score is then inverted and summed up for all relevant criteria, where the lower the total score generated, the better the ranking position of the criteria.
3.6 Clustering of community standard of living index
The clustering result is the grouping of villages based on the community standard of living score index in the high, medium and low-level categories. The standard of living index was combined with previous indicators so that each indicator can represent the actual conditions of the community in a village hence the decision-making process on the level of distribution of village development provides more objective information. In general, the stages of the process of determining the CSLI include:
Declaration of variable Wj, Rk, Rj, TS, TC, TP.
Rk =Total goals(criteria/subcriteria)
Rj = Rank order value (criteria/subcriteria)
TC = Total of Community
TP = Total of Patriarch.
Wj = Weight processing criteria/instrument.
Determine the total value generated from the answers to the community questionnaire for each village. Mathematically the formula used is as follows:
$\begin{aligned} & \text { TS } \quad=\text { Total of Scoring } \\ & (T S)=\frac{\sum \text { Criteria }(\mathrm{w}) * \text { Instrument }(\mathrm{w})}{\sum \text { Respondents }} \\ & \end{aligned}$ (4)
Initiation of output neuron output each y1, y3, ...yn.
Initial weight.
Finding the shortest distance from each output neuron to the input data using the Euclidian distance formula. Mathematically the formula used is as follows:
$D_j=\sum_{\mathrm{j}}\left(\mathrm{w}_{\mathrm{ji}}-\mathrm{x}_{\mathrm{j}}\right)$ (5)
Each weight wij is updated by neighbouring weights using the formula with the following equation:
$\mathrm{W}_{\mathrm{ij}}$ (new) $=\mathrm{W}_{\mathrm{ij}}($ old $)+\alpha\left(\mathrm{X}_{\mathrm{i}}-\mathrm{W}_{\mathrm{ij}}\right.$ (old) $)$ (6)
Update bias weight (error).
Repeat steps g to h until there is no weight update or it has reached a stop condition or error in the smallest
Save the convergent weight, Initiation cluster
Determine the total of clusters built
Determine the rank value (W)
Initialize the initial partition matrix
Calculating the centroid value using the formula:
$\mathrm{Vkj}=\frac{\Sigma_{\mathrm{i}=1}^{\mathrm{n}}\left((\mu \mathrm{ik})^{\mathrm{w}} * \mathrm{Xij}\right)}{\Sigma_{\mathrm{ij}}^{\mathrm{n}}(\mu \mathrm{ik})^{\mathrm{w}}}$ (7)
Calculating the value of membership degrees using the formula:
$\mathrm{Qj}=\sum_{\mathrm{k}=1}^{\mathrm{c}} \mu \mathrm{ik}$ (8)
Determine the cluster of selected
Save the data clusters.
In the early stages of the clustering process, initial weights are set randomly to initialize the weights or parameters so that more accurate patterns can be found in the data. The initial weight is shown in Table 3.
Table 3. Initiation weight
|
Initial Weight |
Cluster |
|||
|
0.39 |
0.934 |
0.875 |
Excellent |
|
|
0.94 |
0.553 |
0.177 |
Average |
|
|
0.849 |
0.338 |
0.506 |
Poor |
|
The process for clustering of villages is shown in the flowchart given in Figure 4.
Figure 4. Flowchart clustering village
Figure 4 illustrates that the engineering process for indexing the community standard of living index consists of the data input process and the indexing process. In the data input process, criteria are set to guide the construction of a questionnaire, where each questionnaire has an answer that has a predetermined weight.
All questionnaires are stored on the server to access the public as responders. In the indexing process, the entire answer score from the respondent was calculated and then used as input in the scoring process and then set as the village score. After determining the score for each village, the following process combines the score, Total of the patriarch, and Total of residents to serve as input for the clustering process. Furthermore, from the clustering process, an index of the community standard of living index was generated, which is divided into three groups of categories, namely First, Excellent Level of CSLI, village with a high level of community welfare to create prosperity in life. Second, Average Level of CSLI, the village has a moderate level of community welfare, so it is seen that it still requires assistance from the government in several matters relating to improving community welfare. Third, Poor Level of CSLI, village with a low level of community welfare, so it is seen as in dire need of assistance from the government in all fields related to improving community welfare.
4.1 Evaluation of criteria
In the fuzzy delphi method, there is a stage of evaluating the criteria to determine the ideal order of criteria based on scores and ranking decisions. The first stage is all the experts input the agreement value for all criterias that consist of 1-5. Input scoring each criteria by the experts shown in Table 4.
Table 4. Input agreement value
|
Experts |
Fuzzy Scale |
||||||||
|
C1 |
C2 |
.. |
.. |
C7 |
.. |
.. |
C37 |
C38 |
|
|
1 |
5 |
4 |
.. |
.. |
5 |
.. |
.. |
4 |
5 |
|
2 |
5 |
4 |
.. |
.. |
5 |
.. |
.. |
5 |
5 |
|
3 |
5 |
5 |
.. |
.. |
4 |
.. |
.. |
5 |
5 |
|
4 |
5 |
5 |
.. |
.. |
4 |
.. |
.. |
5 |
4 |
|
5 |
5 |
5 |
.. |
.. |
4 |
.. |
.. |
3 |
3 |
|
6 |
5 |
5 |
.. |
.. |
5 |
.. |
.. |
5 |
5 |
|
7 |
5 |
5 |
.. |
.. |
5 |
.. |
.. |
5 |
3 |
|
8 |
5 |
5 |
.. |
.. |
5 |
.. |
.. |
3 |
5 |
|
9 |
5 |
5 |
.. |
.. |
5 |
.. |
.. |
4 |
3 |
|
10 |
5 |
5 |
.. |
.. |
5 |
.. |
.. |
3 |
5 |
|
11 |
5 |
5 |
.. |
.. |
5 |
.. |
.. |
4 |
5 |
|
12 |
5 |
5 |
.. |
.. |
5 |
.. |
.. |
3 |
4 |
|
13 |
5 |
5 |
.. |
.. |
4 |
.. |
.. |
4 |
3 |
|
14 |
5 |
5 |
.. |
.. |
5 |
.. |
.. |
3 |
3 |
|
15 |
5 |
5 |
.. |
.. |
4 |
.. |
.. |
3 |
5 |
|
16 |
4 |
5 |
.. |
.. |
4 |
.. |
.. |
5 |
4 |
Based on the input value by the expert, next stage is get weight scale m1, m2, m3 each criteria is obtained based on Table 2. The average value each criteria is shown in Table 5.
Based on the value of average m1, m2 and m3 in Table 5, the threshold value for each criterion is obtained using Eq. (1). The threshold value for each criteria is shown in Table 6.
In the process of determining the threshold value, if the value of all criteria is ≤ 2, then all criteria are declared to be in consensus, or all experts have agreed on each decision. Finally, to determine the ranking against each criterion to find out the order based on the fuzzy score using Eq. (2). The result of evaluating the criteria is shown in Table 7.
Table 7 shows the results of the evaluation of the criteria sequence based on the score value and ranking. After the evaluation stage of the criteria was carried out, there was a change in the ranking position on several criteria. Changes in the ranking criteria are shown in Figure 5.
Based on the illustration shown in Figure 5, it was known that after the criteria evaluation process was carried out by experts using the Fuzzy Delphi method, there was a change in the index of the criteria, namely criteria 4 to 38, while the criteria that did not change the index were indexes 1 to 3. The purpose of evaluating the criteria is to determine the appropriate weight for each criteria based on the index at the weighting stage.
Table 5. Determining average m1, m2, m3
|
PAKAR |
AVERAGE (m1, m2, m3) |
||||||||||||||
|
C1 |
C2 |
C7 |
C37 |
C38 |
|||||||||||
|
1 |
0.6 |
0.8 |
1 |
0.4 |
0.6 |
0.8 |
1 |
0.6 |
0.8 |
0.4 |
0.6 |
0.8 |
0.6 |
0.8 |
1 |
|
2 |
0.6 |
0.8 |
1 |
0.4 |
0.6 |
0.8 |
1 |
0.6 |
0.8 |
0.6 |
0.8 |
1 |
0.6 |
0.8 |
1 |
|
3 |
0.6 |
0.8 |
1 |
0.6 |
0.8 |
1 |
1 |
0.4 |
0.6 |
0.6 |
0.8 |
1 |
0.6 |
0.8 |
1 |
|
4 |
0.6 |
0.8 |
1 |
0.6 |
0.8 |
1 |
1 |
0.4 |
0.6 |
0.6 |
0.8 |
1 |
0.4 |
0.6 |
0.8 |
|
5 |
0.6 |
0.8 |
1 |
0.6 |
0.8 |
1 |
1 |
0.4 |
0.6 |
0.2 |
0.4 |
0.6 |
0.2 |
0.4 |
0.6 |
|
6 |
0.6 |
0.8 |
1 |
0.6 |
0.8 |
1 |
1 |
0.6 |
0.8 |
0.6 |
0.8 |
1 |
0.6 |
0.8 |
1 |
|
7 |
0.6 |
0.8 |
1 |
0.6 |
0.8 |
1 |
1 |
0.6 |
0.8 |
0.6 |
0.8 |
1 |
0.2 |
0.4 |
0.6 |
|
8 |
0.6 |
0.8 |
1 |
0.6 |
0.8 |
1 |
1 |
0.6 |
0.8 |
0.2 |
0.4 |
0.6 |
0.6 |
0.8 |
1 |
|
9 |
0.6 |
0.8 |
1 |
0.6 |
0.8 |
1 |
1 |
0.6 |
0.8 |
0.4 |
0.6 |
0.8 |
0.2 |
0.4 |
0.6 |
|
10 |
0.6 |
0.8 |
1 |
0.6 |
0.8 |
1 |
0.8 |
0.6 |
0.8 |
0.2 |
0.4 |
0.6 |
0.6 |
0.8 |
1 |
|
11 |
0.6 |
0.8 |
1 |
0.6 |
0.8 |
1 |
0.8 |
0.6 |
0.8 |
0.4 |
0.6 |
0.8 |
0.6 |
0.8 |
1 |
|
12 |
0.6 |
0.8 |
1 |
0.6 |
0.8 |
1 |
0.8 |
0.6 |
0.8 |
0.2 |
0.4 |
0.6 |
0.4 |
0.6 |
0.8 |
|
13 |
0.6 |
0.8 |
1 |
0.6 |
0.8 |
1 |
0.8 |
0.4 |
0.6 |
0.4 |
0.6 |
0.8 |
0.2 |
0.4 |
0.6 |
|
14 |
0.6 |
0.8 |
1 |
0.6 |
0.8 |
1 |
1 |
0.6 |
0.8 |
0.2 |
0.4 |
0.6 |
0.2 |
0.4 |
0.6 |
|
15 |
0.6 |
0.8 |
1 |
0.6 |
0.8 |
1 |
0.8 |
0.4 |
0.6 |
0.2 |
0.4 |
0.6 |
0.6 |
0.8 |
1 |
|
16 |
0.4 |
0.6 |
0.8 |
0.6 |
0.8 |
1 |
0.8 |
0.4 |
0.6 |
0.6 |
0.8 |
1 |
0.4 |
0.6 |
0.8 |
|
Fuzzy Average |
0.58 |
0.78 |
0.98 |
0.57 |
0.77 |
0.97 |
0.92 |
0.52 |
0.72 |
0.4 |
0.6 |
0.8 |
0.43 |
0.65 |
0.83 |
|
m1 |
m2 |
m3 |
m1 |
m2 |
m3 |
m3 |
m1 |
m2 |
m1 |
m2 |
m3 |
m1 |
m2 |
m3 |
|
Table 6. Threshold value each criteria
|
Experts |
Criteria |
||||
|
C1 |
C2 |
C7 |
C37 |
C38 |
|
|
1 |
0.0125 |
0.175 |
0.075 |
0.0 |
0.162 |
|
2 |
0.0125 |
0.175 |
0.075 |
0.2 |
0.162 |
|
3 |
0.0125 |
0.2 |
0.125 |
0.2 |
0.162 |
|
4 |
0.0125 |
0.2 |
0.125 |
0.2 |
0.037 |
|
5 |
0.0125 |
0.2 |
0.125 |
0.2 |
0.2 |
|
6 |
0.0125 |
0.025 |
0.075 |
0.2 |
0.162 |
|
7 |
0.0125 |
0.025 |
0.075 |
0.2 |
0.2 |
|
8 |
0.0125 |
0.025 |
0.075 |
0.2 |
0.162 |
|
9 |
0.0125 |
0.025 |
0.075 |
0.0 |
0.2 |
|
10 |
0.0125 |
0.025 |
0.075 |
0.2 |
0.162 |
|
11 |
0.0125 |
0.025 |
0.075 |
0.0 |
0.162 |
|
12 |
0.0125 |
0.025 |
0.075 |
0.2 |
0.037 |
|
13 |
0.0125 |
0.025 |
0.125 |
0.0 |
0.2 |
|
14 |
0.0125 |
0.025 |
0.075 |
0.2 |
0.2 |
|
15 |
0.0125 |
0.025 |
0.125 |
0.2 |
0.162 |
|
16 |
0.1875 |
0.025 |
0.125 |
0.2 |
0.037 |
|
d' per Criteria |
0.0234 |
0.043 |
0.093 |
0.15 |
0.162 |
|
d' construction |
0.097 |
||||
Figure 5. Evaluation rank of criteria
Table 7. Evaluation of criteria
|
ID |
Criteria |
Score |
Rank Evaluation |
|
C1 |
Welfare Status |
12,600 |
1 |
|
C2 |
Ownership Status of residential buildings |
12,400 |
2 |
|
C3 |
Status of ownership of the land of residence |
12,200 |
3 |
|
C5 |
Types of the widest flooring |
12,000 |
5 |
|
C8 |
The widest types of walls |
11,800 |
8 |
|
C9 |
The widest types of roofs |
11,600 |
9 |
|
C10 |
Widest wall quality |
11,600 |
10 |
|
C7 |
The widest-quality the roof |
11,867 |
7 |
|
C22 |
Sources of drinking water |
9,600 |
22 |
|
C4 |
How to get drinking water |
12,200 |
4 |
|
C19 |
Use of defecation facilities |
9,800 |
19 |
|
C25 |
Types of toilets |
9,600 |
25 |
|
C23 |
Faecal landfill |
9,600 |
23 |
|
C16 |
Main sources of illumination |
10,000 |
16 |
|
C6 |
Installed electrical power |
12,000 |
6 |
|
C11 |
Fuel for cooking |
10,800 |
11 |
|
C14 |
Ownership of gas cylinders of 5,5kg or more |
10,200 |
14 |
|
C36 |
Telephone connection ownership |
8,800 |
36 |
|
C17 |
Ownership of a computer/laptop |
10,000 |
17 |
|
C35 |
Ownership of bicycles |
9,000 |
35 |
|
C20 |
Motorcycle ownership |
9,800 |
20 |
|
C31 |
Car ownership |
9,400 |
31 |
|
C27 |
Boat ownership |
9,400 |
27 |
|
C26 |
Outboard Motor Ownership |
9,600 |
26 |
|
C18 |
Ownership of outboard motor/tractor |
10,000 |
18 |
|
C13 |
Ship ownership |
10,600 |
13 |
|
C28 |
Ownership of the refrigerator |
9,400 |
28 |
|
C21 |
Ownership of air conditioning |
9,800 |
21 |
|
C33 |
Ownership of water heater |
9,000 |
33 |
|
C34 |
Ownership of Television |
9,000 |
34 |
|
C12 |
Ownership of gold worth 10 grams |
10,800 |
12 |
|
C29 |
Ownership of Land |
9,400 |
29 |
|
C30 |
Homeownership in other locations |
9,400 |
30 |
|
C37 |
There are household members who have joint businesses |
8,800 |
37 |
|
C32 |
Have a psc/kps |
9,200 |
32 |
|
C38 |
Participants of the PKH program |
8,400 |
38 |
|
C24 |
Raskin program participants |
9,600 |
24 |
|
C15 |
Participants of the KUR program |
10,200 |
15 |
4.2 Village input
Village input is an accumulated score obtained by each village based on answers from respondents from each village, then the village input score will be used as a guideline for village index provisions. Village Input Instruments for respondents are shown in Table 8.
Table 8. Weight of criteria and instrument
|
ID |
Weight |
Instruments |
Weight |
||
|
C1 |
0.23652 |
A |
Household/individual welfare 10% lowest |
0.545455 |
|
|
B |
Household/individual welfare 11%-20% lowest |
0.272727 |
|||
|
C |
Households/individuals welfare 21%-30% lowest |
0.181818 |
|||
|
C2 |
0.11826 |
A |
Privately Owned |
0.437956 |
|
|
B |
Contract |
0.218978 |
|||
|
C |
Rent-free |
0.145985 |
|||
|
D |
Service |
0.109489 |
|||
|
E |
Other |
0.087591 |
|||
|
C3 |
0.07884 |
A |
Privately Owned |
0.48 |
|
|
B |
Someone else's |
0.24 |
|||
|
C |
State lands |
0.16 |
|||
|
D |
Other |
0.12 |
|||
|
C4 |
0.02365 |
A |
Buying retail |
0.545455 |
|
|
B |
Client |
0.272727 |
|||
|
C |
Not buying |
0.181818 |
|||
|
C5 |
0.05913 |
A |
Marble/granite |
0.341417 |
|
|
|
|
B |
Ceramics |
0.170709 |
|
|
|
|
C |
Package/vinyl/rug |
0.113806 |
|
|
|
|
D |
Tiles/tiles/terrazzo |
0.085354 |
|
|
E |
High-quality wood/board |
0.068283 |
|||
|
F |
Cement/red brick |
0.056903 |
|||
|
G |
Bamboo |
0.048774 |
|||
|
H |
Low-quality wood/board |
0.042677 |
|||
|
I |
Soil |
0.037935 |
|||
|
J |
Other |
0.034142 |
|||
|
C6 |
0.01576 |
A |
450 watts |
0.408163 |
|
|
B |
900 watts |
0.204082 |
|||
|
C |
1300 watts |
0.136054 |
|||
|
D |
2200 watts |
0.102041 |
|||
|
E |
>2200 watts |
0.081633 |
|||
|
F |
Not using PLN |
0.068027 |
|||
|
C7 |
0.02956 |
A |
Good/high quality |
0.666667 |
|
|
B |
Ugly/low quality |
0.333333 |
|||
|
C8 |
0.0473 |
A |
Wall |
0.385675 |
|
|
B |
Bamboo/wire matting stucco |
0.192837 |
|||
|
C |
Wood |
0.128558 |
|||
|
D |
Bamboo matting |
0.096419 |
|||
|
E |
Logs |
0.077135 |
|||
|
F |
Bamboo |
0.064279 |
|||
|
G |
Other |
0.055096 |
|||
|
C9 |
0.03942 |
A |
Concrete/Concrete Roof Tiles |
0.341417 |
|
|
B |
Ceramic tiles |
0.170709 |
|||
|
C |
Metal tiles |
0.113806 |
|||
|
D |
Clay tiles |
0.085354 |
|||
|
E |
Asbestos |
0.068283 |
|||
|
F |
Zinc |
0.056903 |
|||
|
G |
Shingles |
0.048774 |
|||
|
H |
Bamboo |
0.042677 |
|||
|
I |
Hay/ijuk/leaf/rumbia |
0.037935 |
|||
|
J |
Other |
0.034142 |
|||
|
C10 |
0.03378 |
A |
Good/high quality |
0.666667 |
|
|
B |
Ugly/low quality |
0.333333 |
|||
|
C11 |
0.01478 |
A |
Electricity |
0.353486 |
|
|
B |
Gas>3kg |
0.176743 |
|||
|
C |
Gas 3 kg |
0.117829 |
|||
|
D |
Gas kota/biogas |
0.088371 |
|||
|
E |
Kerosene |
0.070697 |
|||
|
F |
Briquettes |
0.058914 |
|||
|
G |
Charcoal |
0.050498 |
|||
|
H |
Firewood |
0.044186 |
|||
|
I |
Not cooking at home |
0.039276 |
|||
|
C16 |
0.01689 |
A |
PLN Electricity |
0.545455 |
|
|
B |
Non-PLN electricity |
0.272727 |
|||
|
C |
Non-electricity |
0.181818 |
|||
|
C19 |
0.0215 |
A |
Alone |
0.48 |
|
|
B |
Together |
0.24 |
|||
|
C |
Common |
0.16 |
|||
|
D |
Nothing |
0.12 |
|||
|
C22 |
0.02628 |
A |
Branded bottled water |
0.322247 |
|
|
|
B |
Refillable water |
0.161123 |
||
|
C |
Plumbing meter |
0.107416 |
|||
|
D |
Plumbing retail |
0.080562 |
|||
|
E |
Bore/pump wells |
0.064449 |
|||
|
F |
Sumur terlindung |
0.053708 |
|||
|
G |
Shielded wells |
0.046035 |
|||
|
H |
Protected springs |
0.040281 |
|||
|
I |
Unprotected springs |
0.035805 |
|||
|
J |
River/lake/reservoir water |
0.032225 |
|||
|
K |
Rainwater |
0.029295 |
|||
|
L |
Other |
0.026854 |
|||
|
C23 |
0.01971 |
A |
Swan neck |
0.48 |
|
|
B |
Plengsengan |
0.24 |
|||
|
C |
Cemplung/cubluk |
0.16 |
|||
|
D |
Not using the toilet |
0.12 |
|||
|
C25 |
0.01819 |
A |
Tank |
0.408163 |
|
|
B |
SPAL |
0.204082 |
|||
|
C |
Soil pit |
0.136054 |
|||
|
D |
Ponds/rice fields/rivers/lakes/seas |
0.102041 |
|||
|
E |
Beach/field/garden |
0.081633 |
|||
|
F |
Other |
0.068027 |
|||
|
C14 |
0.01391 |
|
|
|
|
|
C36 |
0.01314 |
|
|
|
|
|
C17 |
0.01244 |
|
|
|
|
|
C35 |
0.01182 |
|
|
|
|
|
C20 |
0.01126 |
|
|
|
|
|
C31 |
0.01075 |
|
|
|
|
|
C27 |
0.01028 |
|
|
|
|
|
C25 |
0.00985 |
|
|
|
|
|
C18 |
0.00946 |
A |
Yes |
0.666667 |
|
|
C13 |
0.00909 |
|
|
|
|
|
C28 |
0.00876 |
|
|
|
|
|
C21 |
0.00844 |
|
|
|
|
|
C33 |
0.00815 |
|
|
|
|
|
C34 |
0.00788 |
|
|
|
|
|
C12 |
0.00762 |
|
|
|
|
|
C29 |
0.00739 |
|
|
|
|
|
C30 |
0.00716 |
|
|
|
|
|
C37 |
0.00695 |
|
|
|
|
|
C32 |
0.00675 |
|
|
|
|
|
C38 |
0.00657 |
|
|
|
|
|
C24 |
0.00639 |
B |
No |
0.333333 |
|
|
C15 |
0.00622 |
|
|
|
|
In Table 8, the weight value of the criteria and instruments is determined using the Rank Reciprocal algorithm in Eq. (3), where the number of criteria (Rj) has been determined to be 38. The process of determining the criterion weight value using Eq. (3):
$\begin{gathered}W_j(\mathrm{RR})=\frac{1 / R_j}{\sum_{k=1}^n\left(1 / R_k\right)} \\ \mathrm{R}_{\mathrm{i}}=38 \\ \mathrm{~W}_{\mathrm{j}}: 1..38=\frac{1}{1} \ldots \cdots \frac{1}{38} \\ \mathrm{~W}_{\mathrm{j}}: 1..38=1.00 \ldots \ldots 0.263 \\ \mathrm{~W}_{\mathrm{j}}: 1..38=1.00+\cdots+\cdots+0.263=0.42279 \\ \mathrm{~W}_{\mathrm{j}}: 1=\frac{1}{4.2279}=0.2365\end{gathered}$
$\mathrm{W}_{\mathrm{j}}: 38=\frac{0.263}{4.2279}=0.0062$
Calculations on instrument weights also use the same formula, but the variable value (Rj) is adjusted to the number of items contained in each criteria. Each criteria consisted of weighting to express how much influence one criteria had on other criteria. Respondents who gave answers were randomly selected people representing each village of 30 to 50 people or around 900 to 1000 in total for 30 villages. In the data collection process, respondents will provide answers to the question instrument which is carried out through an online digital form or direct interviews with village officials. In the process of recording answers by village officials, each answer will be stored in an internal database on a smartphone device and then synchronized to the main server.
4.3 Scoring of village
Based on Accumulate scoring village by the community, all scores accumulated use the formula in Eq. (4):
$\begin{gathered}\mathrm{SV}_{\mathrm{j}}=\sum \text { Criteria }(\mathrm{w}) * \text { Instrument }(\mathrm{w}) \\ \mathrm{SV}_{\mathrm{j}}: 1 . .30=\frac{\sum \text { Criteria }(\mathrm{w}) * \operatorname{Instrument}(\mathrm{w})}{\sum \text { Respondents }}\end{gathered}$
Table 9. Score of villages
|
No. |
Village |
Score |
|
1 |
Bonto Cinde |
0.33073 |
|
2 |
Lonrong |
0.3186 |
|
3 |
Bajiminasa |
0.219 |
|
4 |
Borongloe |
0.47335 |
|
5 |
Bonto Karaeng |
0.31336 |
|
6 |
Bonto Tappalang |
0.32778 |
|
7 |
Bonto Lojong |
0.32924 |
|
8 |
Tamatto |
0.33464 |
|
9 |
Kahaya |
0.29003 |
|
10 |
Bialo |
0.30667 |
|
11 |
Bonto Minasa |
0.36471 |
|
12 |
Bonto Marannu |
0.3453 |
|
13 |
Tambangan |
0.37964 |
|
14 |
Darubiah |
0.321 |
|
15 |
Welado |
0.20524 |
|
16 |
Amali Riattang |
0.38065 |
|
17 |
Mallari |
0.4589 |
|
18 |
Bana |
0.5255 |
|
19 |
Bulusirua |
0.31047 |
|
20 |
Laoni |
0.26616 |
|
21 |
Pusungnge |
0.35804 |
|
22 |
Praja Maju |
0.36849 |
|
23 |
Data |
0.31064 |
|
24 |
Nusa |
0.45794 |
|
25 |
Panyili |
0.39561 |
|
26 |
Palajau |
0.3339 |
|
27 |
Tanjonga |
0.31983 |
|
28 |
Pallantikang |
0.33649 |
|
29 |
Garassikang |
0.3339 |
|
30 |
Pappalluang |
0.3339 |
The calculation of the scoring village is determined based on the weight of the criteria and instruments that have been determined, while the number of respondents is the number of samples from each village that inputs data on the instrument document. Village Score is shown in Table 9.
4.4 Clustering of village
In this study, the determination of clusters uses 3 variables, namely Score-Village, Total-Heads of Families and Total-Population in each village. The input for the village score variable contains score village data while the input for the other variables comes from the countryside at the Central Bureau of Statistics of South Sulawesi Province. Variable input data is shown in Table 10.
Table 10. Village input instruments
|
Village |
Score |
Patriarch |
Residents |
|
Bonto Cinde |
0.33073 |
755 |
2110 |
|
Lonrong |
0.3186 |
976 |
3250 |
|
Bajiminasa |
0.219 |
1065 |
3527 |
|
Borongloe |
0.47335 |
1398 |
4198 |
|
Bonto karaeng |
0.31336 |
519 |
1808 |
|
Bonto tappalang |
0.32778 |
523 |
1518 |
|
Bonto Lojong |
0.32924 |
1044 |
3351 |
|
Tamatto |
0.33464 |
912 |
1945 |
|
Kahaya |
0.29003 |
373 |
1291 |
|
Bialo |
0.30667 |
1009 |
3418 |
|
Bonto Minasa |
0.36471 |
350 |
1000 |
|
Bonto Marannu |
0.3453 |
561 |
1743 |
|
Tambangan |
0.37964 |
1100 |
4089 |
|
Darubiah |
0.321 |
836 |
3172 |
|
Welado |
0.20524 |
582 |
2543 |
|
Amali riattang |
0.38065 |
293 |
500 |
|
Mallari |
0.4589 |
698 |
2858 |
|
Bana |
0.5255 |
599 |
2434 |
|
Bulusirua |
0.31047 |
335 |
720 |
|
Laoni |
0.26616 |
200 |
739 |
|
Pusungnge |
0.35804 |
162 |
709 |
|
Praja Maju |
0.36849 |
319 |
1394 |
|
Data |
0.31064 |
212 |
920 |
|
Nusa |
0.45794 |
429 |
1675 |
|
Panyili |
0.39561 |
320 |
1340 |
|
Palajau |
0.3339 |
1172 |
3518 |
|
Tanjonga |
0.31983 |
347 |
1200 |
|
Pallantikang |
0.33649 |
501 |
2285 |
|
Garassikang |
0.3339 |
845 |
2972 |
|
Pappalluang |
0.3339 |
1014 |
3395 |
After inputting the variables, the next step is to determine the initialization of the variables used in the Self Organizing Map(SOM) method, including determining the learning rate value is 0.6, and the number of clusters are 3, finally, setting the limit for the number of iterations needed is 100.
In determining the optimal cluster, the cluster value in each village is determined based on the smallest value that represents the convergent value of an object using Eq. (5), if the iteration process is continuing, then the weight changes are carried out using Eq. (6). The results of selecting convergent clusters are shown in Table 11.
Based on calculations using the SOM method with the number of iterations that occur is 17, the resulting grouping of villages into 3 clusters is shown in Figure 6.
Table 11. Optimal convergen cluster
|
Village |
C1 |
C2 |
C3 |
|
Bonto Cinde |
0.017329 |
0.179011 |
0.13917 |
|
Lonrong |
0.156874 |
0.526118 |
0.00497 |
|
Bajiminasa |
0.305493 |
0.717666 |
0.053227 |
|
Borongloe |
0.621683 |
1.269316 |
0.168207 |
|
Bonto karaeng |
0.017525 |
0.064989 |
0.286284 |
|
Bonto tappalang |
0.027 |
0.042597 |
0.340973 |
|
Bonto lojong |
0.196315 |
0.601277 |
0.00101 |
|
Tamatto |
0.056075 |
0.247012 |
0.134571 |
|
Kahaya |
0.082895 |
0.016447 |
0.490546 |
|
Bialo |
0.198321 |
0.596344 |
0.003968 |
|
Bonto Minasa |
0.099586 |
0.004271 |
0.575907 |
|
Bonto Marannu |
0.009293 |
0.067918 |
0.275481 |
|
Tambangan |
0.355344 |
0.878697 |
0.032249 |
|
Darubiah |
0.101741 |
0.418173 |
0.023958 |
|
Welado |
0.103632 |
0.24095 |
0.212002 |
|
Amali Riattang |
0.19311 |
0.021233 |
0.773887 |
|
Mallari |
0.069803 |
0.330795 |
0.126886 |
|
Bana |
0.09953 |
0.289975 |
0.277579 |
|
Bulusirua |
0.153692 |
0.00868 |
0.669101 |
|
Laoni |
0.220632 |
0.027423 |
0.784322 |
|
Pusungnge |
0.206201 |
0.015032 |
0.808605 |
|
Praja maju |
0.067469 |
0.011958 |
0.498058 |
|
Data |
0.16504 |
0.006477 |
0.704226 |
|
Nusa |
0.055702 |
0.086353 |
0.411796 |
|
Panyili |
0.075026 |
0.018341 |
0.518543 |
|
Palajau |
0.287618 |
0.754016 |
0.011243 |
|
Tanjonga |
0.085019 |
0.004918 |
0.523661 |
|
Pallantikang |
0.00941 |
0.114704 |
0.217699 |
|
Garassikang |
0.078455 |
0.375422 |
0.029658 |
|
Pappalluang |
0.188218 |
0.590169 |
0.000316 |
Figure 6. Clustering the villages
Table 12. Clustering the village
|
Excellent CSLI |
Average CSLI |
Poor CSLI |
|
Bonto Cinde |
Kahaya |
Lonrong |
|
Bonto Karaeng |
Bonto minasa |
Bajiminasa |
|
Bonto Tappalang |
Amali riattang |
Borongloe |
|
Tamatto |
Bulusirua |
Bonto lojong |
|
Bonto marannu |
Laoni |
Bialo |
|
Welado |
Pusungnge |
Tambangan |
|
Mallari |
Praja maju |
Darubiah |
|
Bana |
Data |
Garassikang |
|
Nusa |
Panyili |
Pappalluang |
|
Pallantikang |
Tanjonga |
Palajau |
The mapping of villages into the CSLI cluster is shown in Table 12.
The conclusion of this study is that all elements and resources in each village can synergize in the implementation of equitable development. Through the use of Hybrid Multi-Object Optimization (MOO) and Clustering Methodologies, it is possible to determine the level of village development based on the CSLI. Furthermore, the information generated is more up-to-date and objective, so that it can be the basis for decision-making about village development priorities in the province of South Sulawesi. The innovation of this study is that the method used in the process of developing the Community Standard of Living Index for each village is a new knowledge that can be used as a solution to the problem of the lack of community participation and the delay in presenting information about development conditions in a village. The approach proposes in this study provides a perspective in which village development conditions can be measured through the community standard of living index. Constructing a different value index can be used as a propose in future studies. The propose approach can be used for different methodologies and technologies.
We would like to acknowledge the generous support of the STMIK Profesional Makassar and Yayasan Dipanegara for funding this research project. We are grateful for the support and guidance of our colleagues at AeU University who provided valuable feedback and insights throughout the course of this study. Without their contributions, this study would not have been possible.
[1] Abreu, I., Nunes, J.M., Mesias, F.J. (2019). Can rural development be measured? design and application of a synthetic index to Portuguese municipalities. Social Indicators Research, 145: 1107-1123. https://doi.org/10.1007/s11205-019-02124-w
[2] Nusrang, M., Aidid, M.K., Rais, Z. (2022). K-means cluster analysis for grouping districts in South Sulawesi Province based on village potential. ARRUS Journal of Mathematics and Applied Science, 2(2): 73-82. https://doi.org/10.35877/mathscience739
[3] Fathia, A.N., Rahmawati, R., Tarno, T. (2016). Analisis klaster kecamatan di kabupaten semarang berdasarkan potensi desa menggunakan metode ward dan single linkage. Jurnal Gaussian, 5(4): 801-810. https://doi.org/10.14710/j.gauss.5.4.801-810
[4] Salima, N.N., Ilham, A. (2022). Village status classification based tree algorithm. In ICONSEIR 2021: Proceedings of the 3rd International Conference of Science Education in Industrial Revolution 4.0, ICONSEIR 2021, December 21st, 2021, Medan, North Sumatra, Indonesia, European Alliance for Innovation, p. 96. https://doi.org/10.4108/eai.21-12-2021.2317488
[5] Andari, R.N., Ella, S. (2019). Developing a smart rural model for rural area development in Indonesia. Jurnal Borneo Administrator, 15(1): 41-58. https://doi.org/10.24258/jba.v15i1.394
[6] Niyomubyeyi, O., Pilesjö, P., Mansourian, A. (2019). Evacuation planning optimization based on a multi-objective artificial bee colony algorithm. ISPRS International Journal of Geo-Information, 8(3): 110. https://doi.org/10.3390/ijgi8030110
[7] Altuntas, S., Erdogan, Z., Dereli, T. (2020). A clustering-based approach for the evaluation of candidate emerging technologies. Scientometrics, 124: 1157-1177. https://doi.org/10.1007/s11192-020-03535-0
[8] Farid, M.R.A.A. (2019). Pemerataan pembangunan sosial ekonomi antara Indonesia Timur–Barat sebagai upaya mempererat kebhinekaan. Instructional Development Journal, 2(1): 6-10. http://dx.doi.org/10.24014/idj.v2i1.6092
[9] Sewell, S.J., Desai, S.A., Mutsaa, E., Lottering, R.T. (2019). A comparative study of community perceptions regarding the role of roads as a poverty alleviation strategy in rural areas. Journal of Rural Studies, 71: 73-84. https://doi.org/10.1016/j.jrurstud.2019.09.001
[10] Heravi, G., Fathi, M., Faeghi, S. (2017). Multi-criteria group decision-making method for optimal selection of sustainable industrial building options focused on petrochemical projects. Journal of Cleaner Production, 142: 2999-3013. https://doi.org/10.1016/j.jclepro.2016.10.168
[11] Xia, L., Cheng, W. (2019). Sustainable development strategy of rural built-up landscapes in Northeast China based on ANP approach. Energy procedia, 157: 844-850. https://doi.org/10.1016/j.egypro.2018.11.250
[12] Strijker, D., Bosworth, G., Bouter, G. (2020). Research methods in rural studies: Qualitative, quantitative and mixed methods. Journal of Rural Studies, 78: 262-270. https://doi.org/10.1016/j.jrurstud.2020.06.007
[13] Hämäläinen, J., Jauhiainen, S., & Kärkkäinen, T. (2017). Comparison of internal clustering validation indices for prototype-based clustering. Algorithms, 10(3): 105. https://doi.org/10.3390/a10030105
[14] Verma, H., Gupta, A., Kumar, D. (2019). A modified intuitionistic fuzzy c-means algorithm incorporating hesitation degree. Pattern Recognition Letters, 122: 45-52. https://doi.org/10.1016/j.patrec.2019.02.017
[15] Yu, C., Li, G., Cao, Y., Wang, J., Fang, X., Zhou, L., Liu, Y. (2020). Distinct types of restructuring scenarios for rural settlements in a heterogeneous rural landscape: Application of a clustering approach and ecological niche modeling. Habitat International, 104: 102248. https://doi.org/10.1016/j.habitatint.2020.102248
[16] Nasution, B.I., Kurniawan, R., Siagian, T.H., Fudholi, A. (2020). Revisiting social vulnerability analysis in Indonesia: An optimized spatial fuzzy clustering approach. International Journal of Disaster Risk Reduction, 51: 101801. https://doi.org/10.1016/j.ijdrr.2020.101801
[17] Sadeghi, K., Bazrafshan, J., Hajinejad, A., Yasoori, M. (2020). Investigating the factors affecting the vitality and liveliness of rural households (Case study: Fuman township). Journal of Rural Research, 11(2): 250-269. http://dx.doi.org/10.22059/jrur.2020.291906.1416
[18] Abreu, I., Mesias, F.J. (2020). The assessment of rural development: Identification of an applicable set of indicators through a Delphi approach. Journal of Rural Studies, 80: 578-585. https://doi.org/10.1016/j.jrurstud.2020.10.045
[19] Durgalashmi, C.V., Rajraj, Y., Ajith Kumar, N. (2020). The effect of microfinance on living standards and social aspects of people in Alappuzha District of Kerala, India. J. Adv. Res. Dyn. Control Syst., 12(3): 508-514. https://doi.org/10.5373/JARDCS/V12SP3/20201286
[20] Breheny, M., Stephens, C., Henricksen, A., Stevenson, B., Carter, K., Alpass, F. (2016). Measuring living standards of older people using Sen's Capability Approach: development and validation of the LSCAPE-24 (Living Standards Capabilities for Elders) and LSCAPE-6. Ageing & Society, 36(2): 307-332. https://doi.org/10.1017/S0144686X14001160
[21] Perera, K.J.T. (2018). Impact of micro finance activities to living standard of people in a selected area in Sri Lanka. International Journal of Engineering and Management Research (IJEMR), 8(2): 220-225.
[22] Khalifa, M.A., Connelly, S. (2009). Monitoring and guiding development in rural Egypt: Local sustainable development indicators and local Human Development Indices. Environment, Development and Sustainability, 11: 1175-1196. https://doi.org/10.1007/s10668-008-9173-0
[23] Birčiaková, N., Stávková, J., Antošová, V. (2015). Evaluating living standard indicators. DANUBE, 6(3): 175-188. https://doi.org/10.1515/danb-2015-0011
[24] Hazuchová, N., Stávková, J. (2017). A comparison of living standards indicators. European Journal of Business Science and Technology, 3(1): 54-64. https://doi.org/10.11118/ejobsat.v3i1.99
[25] Ridder, H.G. (2017). The theory contribution of case study research designs. Business Research, 10: 281-305. https://doi.org/10.1007/s40685-017-0045-z
[26] Pawar, N. (2021). Type of Research and Type Research Design. Soc. Res. Methodol., no. June, pp. 46-57. https://www.kdpublications.in.
[27] Einola, K., Alvesson, M. (2021). Behind the numbers: Questioning questionnaires. Journal of Management Inquiry, 30(1): 102-114. https://doi.org/10.1177/1056492620938139
[28] Mohammed, R.T., Yaakob, R., Sharef, N.M., Abdullah, R. (2021). Unifying the evaluation criteria of many objectives optimization using fuzzy delphi method. Baghdad Science Journal, 18(4 (Suppl.)): 1423-1423. https://dx.doi.org/10.21123/bsj.2021.18.4(Suppl.).1423
[29] Mohammed, R.T., Zaidan, A.A., Yaakob, R., Sharef, N.M., Abdullah, R.H., Zaidan, B.B., Albahri, O.S., Abdulkareem, K.H. (2022). Determining importance of many-objective optimisation competitive algorithms evaluation criteria based on a novel fuzzy-weighted zero-inconsistency method. International Journal of Information Technology & Decision Making, 21(1): 195-241. https://doi.org/10.1142/S0219622021500140