Huda A. Kadhim*![]() | Ghufraan Mohammed Aboud
| Ghufraan Mohammed Aboud![]() | Ahmed Al-Bdairi
| Ahmed Al-Bdairi![]()
© 2023 IIETA. This article is published by IIETA and is licensed under the CC BY 4.0 license (http://creativecommons.org/licenses/by/4.0/).
OPEN ACCESS
Many measures have been imposed by governments around the world to limit the spread of COVID-19. Iraqi authorities adopted a continuous cycles of reinforcement and relaxation in the measures, thus travel behaviors are significantly affected as a result of these measures. This study focuses on the impact of the COVID-19 pandemic on travel pattern in Al-Qadisiyah governorate, Iraq, during three different phases, one phase before pandemic and two phases during the pandemic to study the impact of the variation in imposed measures. Data were collected through a qualitative interviews and online questionnaire surveys that included questions on primary purpose of trip, mode choice of transport, frequency of trips before and during pandemic (including two phases). Descriptive analysis and inferential statistical analysis (especially nonparametric tests) were conducted to analyze the collected data. Results show a significant shifting from work/studying trips to shopping and others trips purposes during the first phase, where distance education and teleworking were imposed. In the second phase, the recommendation for work and study from home were lifted thus the primary trips for work or study purposes have resumed somewhat like their previous pace but with less frequent than its usual in pre-pandemic. A significant reduction in public transport and car-sharing usage was observed during first phase-COVID-19 compared to pre-COVID-19 and second phase-COVID-19. People gave the pandemic-related factors a higher priority than general factors when selecting a transport mode during the pandemic. However, they put less priority for such factors during second phase of COVID-19 as compared to first phase, due to relaxation in the imposed measures. Changes in travel behavior during a pandemic have an impact on travel demand and favorable transport modes, thus understanding this behavior can help in transportation planning, and decision-making.
COVID-19, pandemic, travel behavior, Mann-Whitney U test, McNemar test, McNemar-Bowker test
Infection with the 2019 coronavirus (COVID-19) was first detected in China in November. The World Health Organization has acknowledged that the coronavirus has become a global pandemic as a result of the rapid increase in infections worldwide [1]. Different countries restricted social contact such as working from home, travel restrictions, and the closure of schools, universities, and institutions to reduce the spread of the virus [2-5]. The corona pandemic outbreak has caused a significant disturbance in travel habits, daily routines, and mobility patterns. People avoid traveling during pandemics except to perform errands because they recognize that there are higher risks while in contact with others [6]. However, people need to travel for a variety of reasons, from everyday errands to work trips and study trips. The study by Parady et al. [7] revealed significant changes in various activity levels ranging from high reduction in leisure activities and dining out to moderate decline in grocery shopping. In the same area, the study conducted in Pakistan by Lee et al. [8], to investigate the change in trips (by purpose) accordingly to the change in COVID-19 pandemic periods (serious and after serious periods). The findings indicated that there is a sudden decrease in all trip purposes in the most critical COVID-19 periods, but there is an increase in trips made for errands because people are worried about a shortage of food or other essentials. COVID-19 pandemic has a huge economic impact in numerous countries, it has been an immediate and unfavorable influence on the labor market in all directions [9]. Many studies were carried out globally to investigate travel patterns and mode preferences during the pandemic [10]. Most of these studies showed that there were significant reduction in trip frequent (per week) and notable decrease of using shared mobility and public transport during pandemic [2, 11-14].
On February 24, 2020, COVID-19 infection was first detected in Iraq, then the confirmed Cases of COVID-19 started to rise across the nation [15]. Similar to other countries, the Iraqi government imposed various levels of preventive measures and restrictions on movement during different time-terms of COVID-19 pandemic to contain the virus. These measures were varied (from reinforce to relax) according to trends in disease surveillance data and this strategy may be a good option to mitigate the negative impact of restrictions on the economy [16]. Iraqi authorities imposed full lockdown during serious time-terms of COVID-19 (March to June) whereas in other time-terms, partial lockdown was enforced where, students and employees work half the usual work days before the pandemic, the continuous cycle of full lockdown and relaxation in movement restriction recommended by Iraqi authorities is outline in Figure 1. Although Iraqi authorities imposed full curfew before religious holidays starting, the number of confirmed cases increased during (24 May-10June). That result from visits during Eid al-Fitr, as many gatherings are held between relatives, and friends and less awareness of ill effects of coronavirus among Iraqi travelers [5]. During August, September and October, most of restrictions were lifted, including re-open the airports, allow high schools and universities to resume, and lifting the recommendation for working from home (home-office) [5]. The premature lifting of restriction has led to rapid increase in the rate of infection of COVID-19 [17]. The majority of daily activities have resumed at their previous pace in October 2020 [18]. No research study was adopted to date to investigate on Iraq’s travel patterns and preferred modes of transport during COVID-19 pandemic. Furthermore, the serious measures adopted by Iraqi governments to contain the virus were strictly enforced for several months (from March to June) followed by a relaxation in these measures till the end of 2020. Therefore, it was necessary to conduct a study that investigate the changes in travel behavior and mode choice during different time-term of COVID-19. Al-Qadisiyah governorate, one of the provinces of the Middle Euphrates, was chosen as a case study in this research to reflect the effect of COVID-19 on travel patterns in Iraq. In this study the focus are on reinforcement and relaxation in imposed restrictions, so the first phase begin after detecting the first infection case in Iraq from 24 February, 2020 to June, 2020 where the serious measures adopted by Iraqi governments. While the second phase begins from July, 2020 to January, 2021 where there is a relaxation in Iraqi imposed measures. The findings of this study will help in predicting travel demand and the development of transportation policies.
Figure 1. Timeline of mobility restriction imposed by Iraqi authorities from (Feb 2020-Jan 2021) [5]
Current research shed light on the following:
Travel habits and daily life style have been clearly changed due to COVID-19 outbreak in worldwide. Unprecedented strategies have been taken by a number of countries to limit social interaction and reduce the spread of the virus, including the closure of schools, stores, restaurants, and government institutions, the ban on public gatherings, and the imposed of working from home [19]. In Cosovo, restrictions on mobility have led to a sharp reduction in commercial activity, while on the other, the complete closure of numerous industries has left many workers without jobs [20]. In the northern city of Santander, a researchers study the effect of lockdown or quarantine policies on urban transportation. According to the data gathered, there has been a decline in mobility and traffic accidents, which have decreased by 76% and 67%, respectively, while there has been a 93% decrease in public transport users [21]. Other study in Chicago stated that although grocery shopping online has increased significantly, a sizable segment of population still prefers in-person shopping to fulfill their grocery needs [22]. The study conducted in Pakistan by Lee et al. [8] to investigate the change in trips (by purpose) accordingly to the change in COVID-19 pandemic periods (serious and after serious periods). The findings indicated that there is a sudden decrease in all trip purposes in the most critical COVID-19 periods, but there is an increase in trips made for errands because people are worried about a shortage of food or other essentials [8]. Several studies showed a significant shifting of traveler’s mode choice from public transport to private transport such as, cars, bicycles, and walking [2, 8, 11, 23]. The already-existing gender differences will raise the COVID-19 pandemic's impact, where the World Bank Group's policy paper hypothesizes that COVID-19 may have a greater impact on women's mobility because women travel more frequently on foot and use public transport than males [24].
Ali and Ali [25] stated that Priorities for mode choses are significantly influenced by the service- and health-focused concerns of travelers. The study results revealed that travels who focused on health concern chose bicycle and rickshaw before COVID-19, while they chose a private automobile and a bicycle during pandemic. Furthermore, they revealed that travels who focused on service concern preferred walking, private car and taxi in pre-pandemic whereas they preferred motorcycle and private car during pandemic [25]. The pandemic has an impact on all modes of transport ranging from public transport, private car to taxi, trains and airplanes. In the mid-April 2020, global transport on the road operation was equivalent to 50% below 2019, and commercial airline operation was almost 75% below 2019. In London, a drop in using public transport mode was observed due to governmental lockdowns and concerns of the virus spreading by using these modes [26]. Beck and Hensher [27] showed that the percentage of persons making commuting trips (work to home) decreased from 71% to 39%, while the number of people working five days a week from home increased from 7% to 30%. In Germany, most of the working population continue make work trip (regularly) during the lockdown; one in four of them work from home (remote working) [2]. People's inclination to use public transportation depends on their opinions of its safety, including social distance and sanitization procedures as explained by Aaditya and Rahul [28]. During the serious period of COVID-19, the ride-sharing services of numerous shared mobility providers have been discontinued such as in USA, Hamburg, Delhi, Newzealands, etc. [29].
Bucsky [30] stated that different levels of reduction in transport modes usage were noticed where cycling and bike sharing show lowest reduction (23% and 2%, respectively), while a greatest reduction were in public transport (80%). According to the effect of online activities on changing life styles during COVID-19 pandemic,several studies showed that the imposed measures (online working and studying from home) have caused a halt to routine daily activities [2, 22, 31].
The fear of COVID-19 infection has led to reduction in person shopping and increase the purchasing from online platform [2, 32, 33]. Jameel et al. [18] reveled that there is an increase in the frequency of food and groceries shopping from mid of March till to May, although a significant decline was noticed in general shopping trips. Furthermore they illustrate that online shopping during October 2020 is still higher than pre-pandemic as people have familiar to use electronic facilities in their daily lives. The study's findings of Adibfar et al. [33] indicate that e-shopping and in-store shopping after pandemic would be continue to follow their regular patterns as they had before the pandemic and they would be balanced. Zhang et al. [11] stated that many experts predict in future that teleworking and online shopping will become popular in people’s lives.
3.1 Data collection
3.1.1 Definition of study area
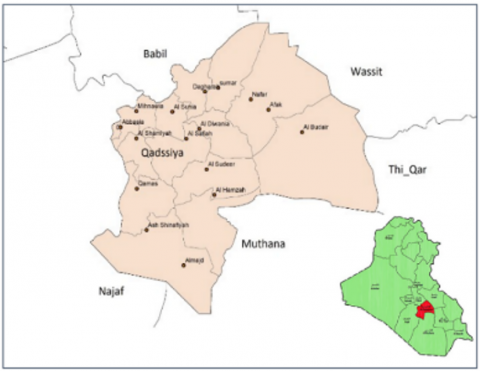
Figure 2. A map of the study area [34]
Al-Qadisiyah Governorate is situated at 31° 51′ 0′′ N latitude and 45° 3′ 0′′ E longitude in the plains of south central Iraq. Its capital was AL-Diwaniyah, and it bordered the governorates of Muthanna, Najaf, Babil, Wassit, and Thi-Qar. With an area of 8153 km2, the governorate is traversed by the Euphrates River and one of its major tributaries, the Shamiya River. The ruined city of Nippur, which functioned as the religious hub of the Sumerian civilization in the fourth millennium BC, is the most famous of the governorate's historical landmarks [34], See Figure 2 above.
3.1.2 Survey population and sample size
At time of data collection, the population of Al-Qadisiyah Governorate obtained from Directorate of AL-Diwaniyah Statistics was 716, 3622. In this study 1000 responses from various sectors and districts of Al-Qadisiyah Governorate were received which is greater than the minimum recommended sample size. The minimum recommended sample size according to equation below [35] was 384, where confidence level and margin of error were 95% and 5% respectively.
$n=\frac{N \times P(1-P)}{(N-1) \times\left(\frac{d}{Z}\right)^2+P(1-P)}$ (1)
The reliability of the collected responses were asses with the Cronbach alpha coefficient [36], the value of the obtained Cronbach alpha is 0.76 [37].
3.1.3 Survey content
The survey information’s are divided to three parts: Firstly, socio‐demographic characteristics included gender, age, household income per month (in ID), car ownership, household members, educational achievement, and job status. Secondly, the primary purpose of travel before and during COVID‐19 pandemic ((1st phase -COVID-19) and (2nd phase - COVID-19)), furthermore, the traveled distance, number of trips and the chosen transport mode for these trips. Thirdly, factors affecting mode choice for primary travel before and during the COVID‐19 pandemic including two phases ((1st phase -COVID-19) and (2nd phase - COVID-19)). 9 factors were used to compare the traveler transport mode preferences which included travel cost, travel time, safety security, infection concern, social distance, comfort, cleanliness, passenger face masking and door to door service. 5 point Likert scale was used for this issue. Lastly, the comparison of an effect of online activates (food delivery, shopping, meetings, and chats) on travel demand during (1st phase -COVID-19) and (2nd phase - COVID-19), where control measures are differ in their severity levels according to infection rate. The comparison was performed by using 5 point Likert scale.
Two surveys methods were conducted in this study to collect data, qualitative interviews and questionnaire method. Interviews were happened with random groups of participants in colleges, schools and with randomly selected households within specific sectors and districts of Al-Qadisiyah Governorate during January, 2021. Due to difficulties in collection data through imposed partial curfew due to corona pandemic, therefore online questionnaire had been used to complete the data collection and distributed through social media channels during February 02, 2021 and March 15, 2021. Google Forms was used to design the questionnaire.
3.2 Analysis methods
Descriptive and inferential statistical were adopted to analysis the collected data as described below.
3.2.1 McNemar test and McNemar–Bowker test
McNemar test is nonparametric test adopted to paired nominal data with two categories summarized in 2 × 2 contingency tables. It used to assess whether a statistically significant change in proportions has occurred in a dichotomous characteristic at two time points in the same population [38]. Unlike chi-square test, McNemar test employed to evaluate pre- and post-test design using two dependent samples [39]. McNemar–Bowker Test used in case where the paired data having more than two categories in each nominal variable which can be described as k × k contingency tables [23]. This test used in the study to investigate if there is a significant differences in primary purpose of trips and mode choice of these trips between:
3.2.2 McNemar test as Post-Hoc test
Post-Hoc test can be used after detecting a statically significant differences. Post-Hoc test can be adopted to determine which of nominal variable categories contribute in that difference. For the analysis purpose the nominal variable categories (shopping, working, studying, and others trips) composes the categories of primary purposes of trips while non-motorized, private car, public transport, and paratransit composes the categories of transport modes. There is a need to adjust significance level because a multiple comparisons tests were adopted. The Bonferroni method was adopted to eliminate false positives and reduce type I errors. α/n represent the equation adopted for adjustment [40], where n (6) is the number of comparisons carried out and α (0.05) is the level of significance, Resulting a computed Bonferroni Coefficient = 0.0083. This coefficient represents the recommended level of significance used for comparisons instead of 0.05.
3.2.3 The Wilcoxon signed-rank test
This test can be considered as a nonparametric, an alternative to the two matches samples t-test, used to determine if there is a significant differences between two related samples of ordinal data. It very appropriate to apply when the sample dependent variable are evaluated under two different conditions such as (before and during COVID-19) [41]. In this study, the test adopted to determine if there is a statistically significant differences both pre-pandemic and during pandemic (including two phases) in: traveled distance of primary trip; trip frequency (trip/week) for the primary trips; and factors effecting mode choice. Furthermore, it was adopted to compare the effect of online activities on reducing number of trips (per week) during first and second phase of COVID-19.
3.2.4 Mann–Whitney U and Kruskal-Wallis H tests
Mann–Whitney U is nonparametric test, alternative to independent t-test, used to evaluate the differences between two separated groups of an independent observations on an ordinal or (continuous) dependent variable [42]. It can be considered as an identical to Wilcoxon signed-rank test. Nevertheless, the major difference is between them is that Wilcoxon test adopted on dependent samples instead of independent samples. Kruskal-Wallis test, an extension of the Mann–Whitney U test, was used to compare two or more of group of independent variable [43]. It is nonparametric test equivalent to a parametric one way ANOVA. In this research the Mann–Whitney U and Kruskal-Wallis tests were performed to investigate the effect of socio-demographic factors on distance traveled for the primary trips, frequency of primary trips and mode choice before and during COVID-19 (including two phases). Sex and car ownership factors were adopted in Mann–Whitney U test, while job status was adopted with Kruskal-Wallis tests, this is due to that job status are categorized to more than two groups such as (student, student doing a part-time job, government employee, private employee, retired and others). For the analysis purpose, student and student doing a part-time job were combined into category as (student), furthermore the retired and other were merged into category (as others).
3.2.5 Spearman correlation test
The Spearman correlation used to measure the strength and direction of association between two ordinal variables [44]. It used in this study to test if there was a relationship between sociodemographic characteristics (age, income, household size, education level) and distance travel for primary trips and frequency of these trip (number of trip /week) before and during COVID-19 (including two phases).
4.1 Social and demographical information of the participants
The total number of interviews and questionnaire online were 1000 which is used in the survey. The demographic characteristics of the respondents of the questionnaire survey are summarized in Table 1.
Table 1. Summary of the respondents' demographic characteristics
|
Item |
Category |
Frequency |
Percent |
|
Gender |
Male |
668 |
67 |
|
|
Female |
332 |
33 |
|
Age |
10-20 |
171 |
17 |
|
|
21-30 |
398 |
40 |
|
|
31-40 |
228 |
23 |
|
|
41-50 |
158 |
16 |
|
|
51-60 |
34 |
3 |
|
|
60+ |
11 |
1 |
|
Educational level |
Others |
24 |
2.0 |
|
|
Primary school |
30 |
3.0 |
|
|
Middle school |
130 |
13.0 |
|
|
High school |
327 |
33.0 |
|
|
Diploma |
12 |
1.0 |
|
|
Bachelors /BSc |
323 |
32.0 |
|
|
Masters/MSc |
106 |
11.0 |
|
|
Doctorate/PhD |
48 |
5.0 |
|
Employment |
others |
111 |
11.0 |
|
|
Student |
301 |
30.0 |
|
|
Student and doing part time job |
85 |
9.0 |
|
|
Private employee |
152 |
15.0 |
|
|
Retired |
12 |
1.0 |
|
|
Government employee |
339 |
34.0 |
|
Monthly household income (ID) |
Below 600,000 |
224 |
22.0 |
|
|
600,000-1,000,000 |
537 |
54.0 |
|
|
Above 1,000,000 |
239 |
24.0 |
|
Household memders |
1-2 |
16 |
2 |
|
|
3-4 |
130 |
13 |
|
|
5 and more |
854 |
85 |
|
Car ownership |
Yes |
788 |
79 |
|
|
No |
212 |
21 |
4.2 Impact of COVID-19 pandemic on primary trips
There are noticeable changes in percent of primary purpose of trips before COVID-19 and 1st phase-COVID-19 as shown in Figure 3, where work and study trips were significantly decline during 1st phase. This is due to imposed teleworking for employees and e-learning for students, this is consistent with the previous studies by Paul et al. [45], and Abdullah et al. [23]. There is a notable increase in respondents who traveled for other purposes (doctor clinic visit, religion place visit, travel for a walk, social, sports, and other activities) during 1st phase - COVID-19 as compare to pre-pandemic and 2nd phase COVID-19.
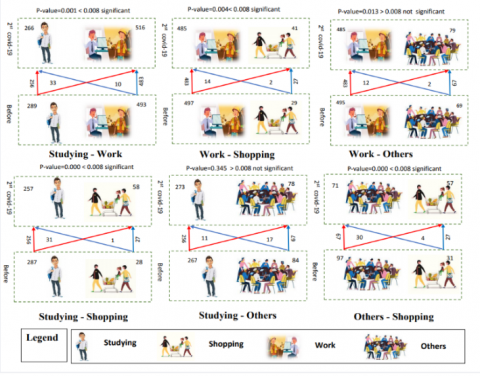
Furthermore, shopping trips became the primary purpose of traveling for about 27% of Al-Qadisiyah Governorate residents during 1st phase -COVID-19 compared to pre-pandemic and 2nd phase - COVID-19. This may be result from the residents concern about food shortage so they travel frequently for buying groceries and food. The adopted post-hoc McNemar tests revealed a significant shift in primary trip purpose when comparing pre-COVID-19 and 1st phase-COVID-19: first (most significantly shift), from work to shopping, study to other, and work to other; second, from study to shopping and from study to work, While, the inverse shifting was occurred when compared 1st and 2nd phase of COVID-19. In addition, there is a significant shift from other to shopping or vice versa between 1st and 2nd phase of COVID-19. Figure 4 outlined the cross-tabulation table and outcome of McNemar test. There was non-significant shift in work trip to other trip or study trip to other trip or vice versa between pre-pandemic and 2nd phase of COVID-19, where most of students and government employees return to their usual primary purpose of trip (studying or work). This is an accordance with study by Jameel et al. [18] who conclude that the majority of daily activities have resumed at their previous pace in October 2020. However, there is a significant shift in study trip to shopping trip, other trip to shopping trip, study trip to work trip and work trip to shopping trip when compared pre-pandemic and 2nd phase of COVID-19.
Figure 3. Primary purpose of traveling before and during COVID-19 pandemic (including two phases)
(a)
(b)
(c)
Figure 4. Layouts for the McNemar Test results and cross tabulation for the primary purpose of travel (a) before and during 1st phase of COVID-19 (b) before and during 2nd phase of COVID-19 (c) during 1st and 2nd phase of COVID-19
The outcome of McNemar-Bowker test revealed that there were significant differences in the primary purposes of trips between the following:
4.3 Impact of COVID-19 pandemic on distance traveled for primary trips
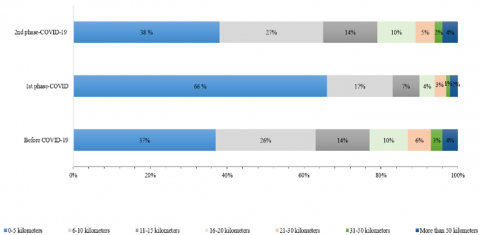
As illustrative in Figure 5, most of Al-Qadisiyah Governorate residents’ percent were travel a distance from 0 to 5 Km during 1st phase- COVID-19, which is decline to about half in pre-pandemic and 2nd phase-COVID-19. Furthermore, the respondent’s percent who traveled distance from (6-10 km) was decreased during 1st phase- COVID-19 as compared to before pandemic and 2nd phase-COVID-19. This means that residents tend to shorten their traveling distance due to imposed movement restriction strategy in 1st and return to travel their usual distance in 2nd phase COVID-19, where there is some relaxation in movement restriction. The Wilcoxon signed ranks test revealed that there was significant difference in distance traveled of primary trips between pre-pandemic and 1st phase of COVID-19 (Z = -15.073, p < 0.001) and the two phases of pandemic (Z = - 15.141, p < 0.001). However, there is not a significant difference (at 0.001 significance level) in distance traveled of the trip between pre pandemic and 2nd phase of pandemic (Z = -2.399, p = 0.016).
There is a substantial increase in respondents percent who traveled a distance from 0 to 5 Km for shopping and other purpose trips during the most serious phase (1st phase COVID-19) as compare to pre-pandemic and 2nd phase of COVID-19, This is consistent with previous study conducted by Abdullah et al. [23]. Despite the perceived COVID-19 threat, people still have a shorting trips to run errands, visit relatives, go for a walk, exercising. While in 1st phase of pandemic the trips with a distance traveled from (6 -10 Km) and (11-16 Km) had a low and lowest frequencies, respectively as compared to pre-pandemic as also revealed by Abdullah et al. [23] and Adeke et al. [46]. Similar findings regarding the distance traveled were found in both the pre-pandemic period and 2nd phase of COVID-19, with the majority of students and workers returning to their usual primary trip in 2nd phase of COVID-19 and traveling a constant distance to their usual working or studying locations.
Based on the Mann-Whitney U test outcome, males traveler made a higher-duration trips than female in the pre-pandemic and pandemic phases, see Table 2. The same findings are obtained by Politis et al. [13] and Abdullah et al. [23]. This due to that driving a car are more prevalent among males than female in the study area thus males make a longer trips. People having a car making longer tips for the primary purpose as compared to those who did not have a car both pre-pandemic and second phase of COVID-19. However, no significant effect of car ownership on distance traveled during first phase of COVID-19, where most of respondents traveled by a walk to run errands due to imposed full and partial lockdown.
Figure 5. Distance travel of primary purpose trips before and during COVID-19 pandemic (including two phases)
Based on Kruskal-Wallis test findings (Table 3) there was a significant effect of employment type on distance traveled during pre and post pandemic, where there is a less significantly difference in first phase (as Kruskal-Wallis H = 25.484) to pre-pandemic and second phase of COVID-19.This is due that most of students and government employees shifted their primary purpose of trip from study, work to shopping and other purposes as compared to other employment categories thus they traveled for a short distances to run errands due to the severity of lockdown strategy in first phase of COVID-19 as compared to pre-pandemic and second phase of COVID-19.
Based on spearman correlation results shown in Table 4, there is a positive correlation between socio demographic characteristics such as (age, income level, and education level) and distance traveled for primary purpose in pre pandemic and pandemic phases. However there is no correlation between household member and distance traveled in all circumstances.
Table 2. Mann–Whitney U Test before and during COVID-19 (including two phases)
|
|
|
Before COVID-19 |
During 1st phase- COVID-19 |
During 2nd phase-COVID-19 |
||||||
|
Item |
Group |
Mean Rank |
U |
P |
Mean Rank |
U |
P |
Mean Rank |
U |
P |
|
Effect on distance traveled for the primary trip purpose |
||||||||||
|
Gender |
Male |
528.625 |
92100 |
0.00* |
523.929 |
95237 |
0.00* |
526.75 |
93349 |
0.00* |
|
|
Female |
443.91 |
|
453.358 |
|
|
447.67 |
|
|
|
|
Car ownership |
Yes |
513.0 |
73674 |
0.006** |
502.06 |
82295 |
0.694 |
512.2 |
74306 |
0.012*** |
|
|
No |
454.01 |
|
|
494.68 |
|
|
457.0 |
|
|
|
Effect on number of trips for the primary trip purpose |
||||||||||
|
Gender |
Male |
536.89 |
86579 |
0.00* |
599.11 |
45010 |
0.00* |
557.90 |
72542 |
0.00* |
|
|
Female |
427.28 |
|
|
302.072 |
|
|
385 |
|
|
|
Car ownership |
Yes |
491.704 |
76597 |
0.039*** |
506.01 |
79186 |
0.238 |
500.467 |
83502 |
0.994 |
|
|
No |
533.19 |
|
|
480.018 |
|
|
500.62 |
|
|
|
Effect on mode choice for the primary trip purpose |
||||||||||
|
Gender |
Male |
533.62 |
88763 |
0.00* |
544.34 |
81603 |
0.00* |
520.37 |
97615 |
0.002** |
|
|
Female |
433.86 |
|
|
412.29 |
|
|
460.52 |
|
|
|
Car Ownership |
Yes |
541.54 |
51185 |
0.00* |
524.27 |
64794 |
0.00* |
541.6 |
51142 |
0.00* |
|
|
No |
347.94 |
|
|
412.13 |
|
|
347.74 |
|
|
Table 3. Kruskal-Wallis before and during COVID-19 (including two phases)
|
|
|
Before COVID-19 |
During 1st phase- COVID-19 |
During 2nd phase-COVID-19 |
||||||
|
|
|
Mean Rank |
Kruskal-Wallis H |
P |
Mean Rank |
Kruskal-Wallis H |
P |
Mean Rank |
Kruskal-Wallis H |
P |
|
Effect on distance traveled for the primary trip purpose |
||||||||||
|
Employment |
Student |
461.64 |
44.317 |
0.00* |
469.80 |
25.484 |
0.00* |
472.79 |
41.430 |
0.00* |
|
private employee |
505.33 |
505.85 |
505.97 |
|||||||
|
others |
411.99 |
452.80 |
395.87 |
|||||||
|
Government employee |
574.85 |
550.42 |
567.79 |
|||||||
|
Effect on number of trips for the primary trip purpose |
||||||||||
|
Employment |
Student |
543.84 |
116.981 |
0.00* |
459.54 |
82.610 |
0.00* |
480.27 |
99.451 |
0.00* |
|
private employee |
606.12 |
647.60 |
645.49 |
|||||||
|
others |
293.74 |
360.74 |
314.37 |
|||||||
|
Government employee |
479.56 |
532.18 |
526.54 |
|||||||
|
Effect on mode choice for the primary trip purpose |
||||||||||
|
Employment |
Student |
380.21 |
186.55 |
0.00* |
393.74 |
106.1 |
0.00* |
375.66 |
198.75 |
0.00* |
|
private employee |
520.54 |
582.82 |
515.77 |
|||||||
|
others |
420.00 |
473.88 |
425.47 |
|||||||
|
Government employee |
657.58 |
594.57 |
662.88 |
|||||||
* Significant at the 0.001 level
** Significant at the 0.01 level
*** Significant at the 0.05 level
Table 4. Spearman correlations
|
|
Before COVID-19 |
During 1st phase- COVID-19 |
During 2nd phase-COVID-19 |
|||
|
Item |
rs |
P |
rs |
P |
rs |
P |
|
Correlation with distance traveled for the primary trip purpose |
||||||
|
Age |
0.222** |
0.00 |
0.127** |
0.000 |
0.195** |
0.000 |
|
Education |
0.277** |
0.00 |
0.191** |
0.000 |
0.257** |
0.000 |
|
Household members |
0.008 |
0.810 |
0.002 |
0.959 |
0.017 |
0.581 |
|
Monthly household income |
0.154** |
0.000 |
0.120** |
0.000 |
0.153** |
0.000 |
|
Correlation with the number of trips for the primary trip purpose |
||||||
|
Age |
0.15 ** |
0.00 |
0.12 ** |
0.000 |
0.141** |
0.000 |
|
Education |
-0.117** |
0.00 |
-0.018 |
0.560 |
-0.012 |
0.697 |
|
Household members |
0.06 |
0.058 |
0.15 ** |
0.000 |
0.041 |
0.200 |
|
Monthly household income |
0.08** |
0.009 |
0.024 |
0.447 |
0.001 |
0.978 |
** Correlation is significant at the 0.01 level
4.4 Impact of COVID-19 pandemic on number of primary trips
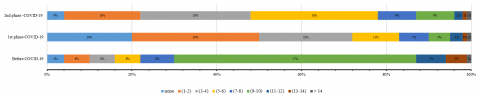
As expected, there is a remarkable decline in number of trips (per week) during the first phase of COVID-19 as compared to pre-pandemic and second phase of COVID-19, see Figure 6. There is a notable decrease in proportion of traveler who make (9-10) trip per week in first phase as compared in pre-pandemic and second phase of COVID-19. This is because government departments imposed to work with minimum staffing which not exceed 25% of the workforce in first phase of COVID-19. Thus, government employees reduced their commuting trips from 5 commuting trips per week in pre-pandemic to (1 or 2) and (3 or 4) in first phase and second phase of COVID-19 respectively. In general, the frequency of primary trips (per week) was decreased during the pandemic as compared to pre-pandemic as revealed by Politis et al. [13], Zubair et al. [10], and Pullano et al. [47].
The Wilcoxon signed ranks test revealed that there was significant difference in number of weekly trips of primary trips as follow:
i) pre-pandemic and first phase of COVID-19, as Z and p-value were -23.840 and 0.00, respectively;
ii) two phases of pandemic, as Z and p-value were -14.110 and 0.00, respectively; and
iii) pre-pandemic and second phase of COVID-19, as Z and p-value were -22.075 and 0.00, respectively.
There is a significant difference between number of trips covered by males and females in pre-pandemic and post pandemic as examined by Mann Whitney U test, the results are summarized previously in Table 2. This is due to driving a car are more prevalent among male than female in the study area thus males make more trips than females in all circumstances.
Figure 6. Trip frequency (per week) before and during COVID-19 pandemic (including two phases)
People having a car make more trip for the primary purpose as compared to those who did not have a car in pre-pandemic. However, car ownership did not have a significant impact on the number of trips for the primary trips during pandemic. Based on Kruskal-Wallis test findings shown previously in Table 3, there was a significant effect of employment type on number of trips (per week) during pre and post pandemic, where there is a less significantly difference in first phase (as Kruskal-Wallis H = 82.610) as compared to pre-pandemic and second phase of COVID-19.
According to Spearman correlation test results shown in Table 4, there was a positive relation between age and the number of primary trips before and during pandemic. Furthermore, for trip frequency (per week), this test revealed a positive correlation with household income and inverse correlation with education level in pre-pandemic, However, no correlation was found between them in first and second phase of COVID-19. In addition, a significant correlation between household size and trip frequency was only revealed in 1st phase COVID.
4.5 Impact of COVID-19 on mode choice for primary trips purposes
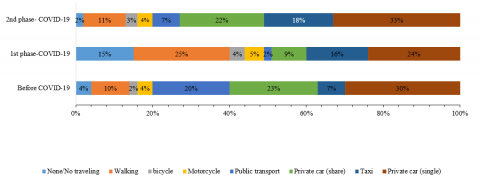
As illustrated in Figure 7., Prior to the COVID-19 outbreak, about half of respondents commute by using private vehicle and car-sharing, where the percent of private car users were stay constant in pre-pandemic and during pandemic. However, both of car-sharing and public transport users were decline during first phase of COVID-19 as compared to pre-pandemic and second phase of COVID-19. Those findings were consistent with other previous studies of Kolarova et al. [2], Zubair et al. [10], Sung and Monschauer [26], and Padmakumar and Patil [48]. There was a significant increase in walking mode usage during first phase of COVID-19 as compared to pre-pandemic and second phase COVID-19.The McNemar‐Bowker test showed that there were significant differences in mode choice for the primary trip purpose as follow:
i) before COVID-19 and during 1st phase- COVID-19 (χ2 = 413.41, p < 0.001);
ii) before COVID-19 and during 2nd phase -COVID-19 (χ2 = 169.22., p < 0.001); and
iii) during 1st phase- COVID-19 and 2nd phase -COVID-19(χ2 = 349.20, p < 0.001).
Figure 7. Mode choice for primary trip before and during COVID-19 pandemic (including two phases)
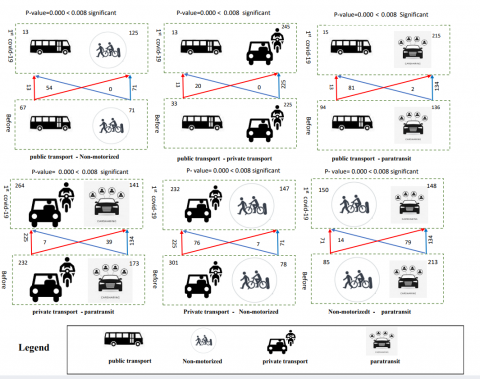
The adopted post-hoc McNemar tests revealed a significant shift in mode choice when comparing pre-COVID-19 and first phase-COVID-19: first (most significantly shift) from public transport to paratransit, public transport to non-motorized, and private transport to non-motorized; second, from paratransit to non-motorized and paratransit to private transport. The previous studies showed a notable declination in public transport usage and significant shifting from public and paratransit modes to active transport modes [8, 10] (Figure 8). Outlined the cross-tabulation table and outcome of McNemar test.
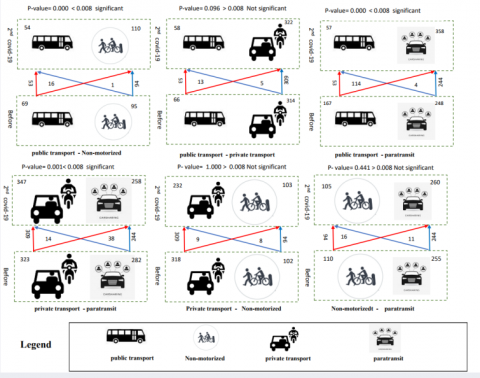
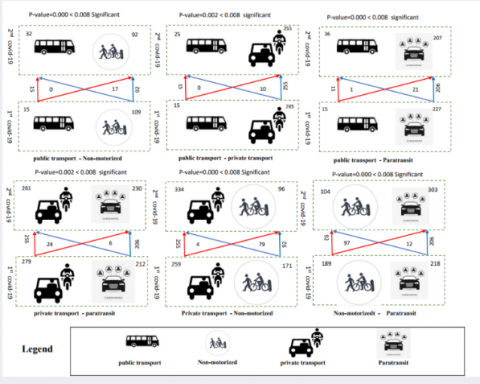
There is a significant shift from non-motorized modes during first phase of COVID-19 to paratransit, private transport, and public transport in second phase of COVID-19. Furthermore, private transport users were significantly decline and shifted to use public and paratransit during second phase of COVID-19 as compared to first phase of COVID-19. When comparing the modal shifting between pre-pandemic and second phase of COVID-19, there is non-significant shifting between private transport and non-motorized modes, paratransit and non-motorized modes, and private transport and public transport. While there is a notable shift from public transport to paratransit and non-motorized modes and from paratransit to private transport as illustrated in Figure 8.
The Mann-Whitney U and Kruskal-Wallis tests results in Table 2 and Table 3 showed a significant difference in mode choice preferences among the sex, car ownership, and employment status groups in pre-pandemic and during the pandemic (including two phases).
(a)
(b)
(c)
Figure 8. Results of McNemar Test and cross tabulation layouts for mode choice. (a) Before and during first phase of COVID-19 (b) before and during second phase of COVID-19 (c) during first and second phase of COVID-19
4.5.1 Factors affecting mode choice before and during COVID-19
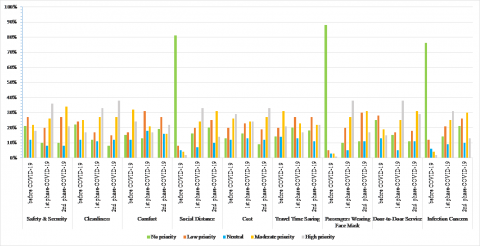
In normal circumstances, the most sensitive attributes that influence people's choice of transport modes include, travel time, cost, availability of the mode, trip destination, attractiveness in terms of security and comfort, and car ownership status [49]. Other attributes that are crucial when choosing modes during a pandemic include social distance, cleanliness, safety and security, passengers' face masks, and infection concerns. These elements might be referred to as pandemic-related elements. Traveler priorities in choosing transport modes in pre-pandemic and during pandemic (including two phases) are summarized in Figure 9. About 54% of respondents placed high and moderate priority on each of travel time, cost, and comfort factors in pre-pandemic. Furthermore, 42% of respondents placed high and moderate priority on safety and cleanliness factors in pre-pandemic. As expected, no priority are placed by traveler for social distance, infection –related, factor and passenger's wearing facemask factors when selecting transport mode before pandemic. On contrary, they placed greater and greatest priority on such factors during second phase and first phase of COVID-19 respectively.
Figure 9. Factors affecting Mode Choice Before and During COVID-19 (including two phases)
Based on Wilcoxon signed‐rank test results, a significant difference was observed in factors affecting mode choice before COVID-19 and 1st phase- COVID-19 as shown in Table 5. The same results were obtained when comparing between pre-pandemic and second phase of COVID-19 except for travel cost factor which show the same priority (as p (value) > 0.001). The respondents in study area gave the same priority for travel time, comfort and door to door service factors when selecting mode choice in first and second phase of COVID-19, while they gave a different priorities for other mode choice related –factors.
4.6 Effect of online activity on reducing number of trips (per week) during COVID-19
The respondents answered about the impact of online activities on reducing traveling during first and second phase of COVID-19. 5-point Likert scale was used to study the effect of such activities on reducing trip frequency which categorized from 1= strongly disagree to 5 strongly agree, Figure 10 presented the answer of respondents during the two phases of COVID-19.
The findings show that most of business, social communication, education and meetings were happened via internet platform (zoom, google meet, chats) during first phase -COVID-19 compared to second phase, this is due to imposed teleworking or sometime part time work for employees and distance education for students by authorities. However, this situation didn’t continue during second phase of COVID-19, where most of governmental and educational institutional were reopened. There is less demand from the study area's residents for online shopping and food delivery during second phase as compared to first phase of COVID-19. From Table 6, which summarizes the results of the Wilcoxon signed‐rank test conducted to compare the responses about effect of online activities during COVID-19 (including two phases) on reducing travel demand. The statistical tests results showed there was a significant difference in responses between first and second phase of COVID-19. During 1st phase - COVID-19, the electronic education, remote working have a large effect on reducing traveling where schools, universities, and governmental institutional are closed thus, studying and meetings were conducted via internet platform (Zoom/Google Meet). Moreover, online shopping and online food delivery activities during first phase of COVID-19 were higher than second phase. These online activates was reduced during 2nd phase -COVID-19, due to relaxation in movement restriction and reopening shopping centers, schools and universities.
Figure 10. Effect of online activities on reducing trip frequency during COVID-19 pandemic
Table 5. Wilcoxon signed – rank tests for comparison of factors influencing transport mode choice before and during COVID-19 (including two phases)
|
|
Before COVID-19 &1stphase -COVID-19 |
Before COVID-19 &2nd phase -COVID-19 |
1stphase -COVID-19 &2nd phase -COVID-19 |
|||||||||
|
Item |
Mean Ranks |
Z |
Asymp. Sig. (2-tailed) |
Mean Ranks |
Z |
Asymp. Sig. (2-tailed) |
Mean Ranks |
Z |
Asymp. Sig. (2-tailed) |
|||
|
|
Negative |
Positive |
|
|
Negative |
Positive |
|
|
Negative |
Positive |
|
|
|
Safety & security |
319.05 |
333.75 |
-12.957 |
< 0.001* |
246.97 |
284.92 |
-8.353 |
< 0.001* |
259.71 |
266.84 |
-7.015 |
< 0.001* |
|
Comfort |
368.70 |
341.32 |
-7.731 |
< 0.001* |
369.75 |
286.46 |
-7.832 |
< 0.001* |
345.80 |
303.98 |
-1.026 |
0.305 |
|
Cleanliness |
304.57 |
328.27 |
-14.078 |
< 0.001* |
200.39 |
293.59 |
-17.282 |
< 0.001* |
287.01 |
360.39 |
-3.374 |
< 0.001* |
|
Social distance |
224.35 |
401.88 |
-23.770 |
< 0.001* |
307.39 |
377.11 |
-22.501 |
< 0.001* |
254.12 |
243.15 |
-10.670 |
< 0.001* |
|
Cost |
369.47 |
375.47 |
-3.578 |
< 0.001* |
350.27 |
343.63 |
-2.929 |
0.003 |
346.83 |
342.41 |
-6.324 |
< 0.001* |
|
Travel time saving |
330.04 |
328.47 |
- 7.223 |
< 0.001* |
334.74 |
303.83 |
-4.265 |
< 0.001* |
320.92 |
301.77 |
-2.426 |
0.015 |
|
Passengers with face masks |
165.00 |
439.88 |
-25.448 |
< 0.001* |
287.26 |
433.07 |
-24.816 |
< 0.001* |
308.88 |
307.51 |
-9.855 |
< 0.001* |
|
Door-to-door service |
229.36 |
355.30 |
-13.838 |
< 0.001* |
265.97 |
374.42 |
-13.599 |
< 0.001* |
256.09 |
281.59 |
-1.186 |
0.236 |
|
Infection Concern |
220.15 |
417.44 |
-23.655 |
< 0.001* |
255.02 |
385.56 |
-21.646 |
< 0.001* |
285.87 |
256.44 |
-11.99 |
< 0.001* |
|
|
Negative Ranks: 1st phase--COVID-19 < Before COVID-19 |
Negative Ranks: 2nd phase -COVID-19 < Before COVID-19 |
Negative Ranks: 2nd phase -COVID-19 < 1st phase -COVID-19 |
|||||||||
* Significant at the 0.001 level
Table 6. Wilcoxon signed‐rank test
|
Item |
Mean Ranks |
Z |
Asymp. Sig. (2-tailed) |
|
|
|
Positive |
Negative** |
|
|
|
online food delivery |
261.59 |
264.39 |
-7.546 |
< 0.001* |
|
online shopping (other than grocery and food delivery) |
189.58 |
284.69 |
-17.375 |
< 0.001* |
|
online meeting (through Zoom/Google Meet/Webex/Skype etc.) |
230.76 |
279.84 |
-16.434 |
< 0.001* |
|
live audio/video chats |
338.97 |
375.13 |
-11.022 |
< 0.001* |
* Significant at the 0.001 level
**Negative Ranks: 2nd phase -COVID-19 < 1st phase -COVID-19
The restrictions on movement imposed by authorities to contain the virus during pandemics make a great difference in the travel behavior and mode choice of individuals. This study investigated the changes in travel pattern in Al-Qadisiyah Governorate, Iraq, before pandemic and during pandemic where two time-terms have been included to study the impact of variation in imposed measures. This study was focused on the characteristics of primary purposes trips because these trips are made out of necessity. Government employees, School and university students comprises most of the surveys’ respondents (72%) therefore, the focus was on the change in travel pattern for work and study trips. The outcome of this study have been briefly presented in the next section. It was revealed that primary trips shifted significantly from work to shopping, study and work to others during 1st phase COVID-19 due to distance education, remote working, and social distance imposed by authorities to contain the virus. Regardless the levels of mobility restrictions, there is notable increase in “others” trips during 1st phase- COVID-19 compared to pre-pandemic and 2nd phase- COVID-19. This may result from that most of respondents were travel for other purposes such as, exercising, visit relatives and friends, visiting clinics, and walking during 1st phase -COVID-19. Moreover, shopping trips was increased considerably during first phase-COVID-19 compared to pre-pandemic where people need to visit groceries and other shops for basic needs (grocery, drugs, etc.). This situation didn't continue during the 2nd phase of COVID-19 as there is some relaxation in preventive measures and reopening the educational and governmental institutes so most of the student and employees were traveling mainly for studying and working respectively. In 2nd phase COVID-19, students study 2-3 days in a week and government employee works half or three quarters the usual work days before pandemic.
A noticeable decrease was found in traveled distance for shopping trips during 1st phase- COVID-19 compared to pre-pandemic and 2nd phase - COVID-19, where people make short trips for buying basic needs. More than 75% of respondents travel for work and study during 2nd phase- COVID-19 with constant distance to their destination; therefore, no significant difference in traveled distance was found during 2nd phase- COVID-19 compared to pre-pandemic. Among sex groups, there is a significant difference in traveled distance and the number of trips undertaken for primary trip purposes between female and males in normal conditions and pandemic periods. In normal circumstances, male travel more and make longer trips compared to female where female are less likely to commute or drive than male in study area, this findings is accordance with study by Lee et al. [50]. During pandemic, female are more concerned about travel due to disease transmission infection [24]. Moreover, a significant difference was observed in choosing transport mode among sex groups in pre-pandemic and pandemic. That may result from the fact that female are more likely to use public transport, taxi, and shared transport (car-sharing) than male.
Car ownership didn’t have a significant effect on travel distance during 1st phase- COVID-19 compared to pre-pandemic due to partial and full lockdown imposed by Iraqi authorities. However people may travel by walk for short distance for shopping trips and others trips purposes. In contrast, people who owned car make a longer distance trips than who don’t have a car during 2nd phase -COVID-19, due to some relaxation on restrictions mobility. Car ownership didn’t have an impact on the number of trips undertaken for primary trip purposes during pandemic compared to pre-COVID-19 period. During COVID-19 time-terms, the times of travel are reduced remarked especially in 1st phase -COVID-19. A significant difference was revealed between car owners and non-owners in choosing transport mode in pre-pandemic and pandemic periods (including two phases), this is due to that non-owner are commute by use public transport mode, and active transport modes (motor-cycle, bicycle, walking) while the car owners have used to travel by using their own car. The containment efforts will be more efficiency if taking into account how the pandemic affects specific groups, hence reducing any potential negative effects [24]. In this research an effect of employment status groups on travel distance, mode choice, and the number of trips has been investigated. It revealed that there is a less significance difference in travel distance, frequency of trips and mode transport selection between four types of jobs during1st phase -COVID-19 compared to pre-pandemic and 2nd phase COVID-19. This attributed to that students, Governmental and private sector employees perform their duties from home during the first phase of COVID-19 due to distance education and teleworking imposed by authorities in some time period terms. In the second phase they travel constant distance to their destination, but with less number of repetitions than usual during normal conditions. Moreover, students have used to choose shared mobility, taxi and walking while employees are more likely to use their own car.
Based on spearman correlation results, higher-age people travel more frequently and farther-distance than lower-age people before and during pandemic. This is because the majority of older people (30-60 years old) are employed (in the private sector or public institutions) and travel for work more frequently (per week) and over longer distances. While the majority of younger people (10-30 years) are study (in schools or universities) and travel for short distance with less frequently especially during second phase of COVID-19 (2-3 days per week). Households with higher income make trips for long distance than lower income households before and during pandemic (including two phases), this may be as result of most of high –income people were car owner and traveled for long distance. Similarly, they make more trips than lower income people in pre-pandemic period, while there is no relation between income level and number of trips (per week) during the first and second phase of COVID-19 due to online working and distance education. No relation was observed between household members and number of trips in all conditions. In addition, before and during COVID-19 pandemic, higher educated people traveled farther than uneducated people. However, those with higher levels of education made fewer primary trips each week in pre-pandemic period.
No relation was observed between number of trips and the education level of people during pandemic. Nearly half of respondents were travel by using their private car and car-sharing before COVID-19 pandemic, where most of students and employees in the study area were travel by using the shared transport modes and private car, respectively. However, a decline in car-sharing and public transport user was remarked during first phase –COVID-19 as compared to pre-pandemic and second phase to avoid virus transmitting where most respondents were use taxi, private car and walking modes in their traveling. The higher use of non-motorized and private transport modes by respondents was observed during first phase of COVID-19 as compared to pre-pandemic and second phase where most of people travel by walk or by use bicycle, and motorcycle due to the imposed full lockdown in this period. So the serious and (reinforcement) measures imposed by authorities during first phase has led somewhat to prohibit gatherings and reinforced the social distance. There is an increase in shared mobility during second phase of COVID-19 as compared to first phase this is may be due to the relaxation in the imposed measures and resume the studying trips where most of students have use to travel by using paratransit or public transport.
A significant change in travelers’ mode choices was noticed during pandemic compared to pre-pandemic. In Al-Qadisiyah Governorate, respondents emphasis their attention on infection-related items such as commuters wearing face mask, social distance and cleanliness during first phase of COVID-19 pandemic when choose a transport mode. Furthermore, travelers give more priority for cost factor when choose transport mode in normal circumstances and pandemic period (second phase-COVID-19). Travel time saving, comfort, and door to door service factors had the same priority among respondents during first and second phase of COVID-19. While pandemic –related factors had a significant difference in priorities among respondents in first and second phase of COVID-19. This may result from that people were somewhat less committed to safety measures related to COVID-19 (wearing a mask and social distancing) during the second phase of COVID-19 compared to first phase. The study findings concerning the effect of online activities on travel demand show that the online activities have a large effect on reducing traveling during first phase of COVID-19, this is due to distance education and closure of shopping centers, schools, universities, and governmental institutional and reduce the working days in a week for governmental employee. However, this effect reduced during 2nd phase -COVID-19, due to relaxation in movement restriction and reopening shopping centers, schools and universities so the majority of daily activities have resumed at their previous pace.
|
d |
margin of error |
|
Km |
Kilometers |
|
N |
population size |
|
n |
sample size |
|
P |
fraction of responses that you are interested in |
|
Z |
Standard score corresponding to the level of significance |
[1] Jiang, S.B., Du, L.Y., Shi, Z.L. (2020). An emerging coronavirus causing pneumonia outbreak in Wuhan, China: Calling for developing therapeutic and prophylactic strategies. Emerging Microbes & Infections, 9(1): 275-277. http://dx.doi.org/10.1080/22221751.2020.1723441
[2] Kolarova, V., Eisenmann, C., Nobis, C., Winkler, C., Lenz, B. (2021). Analysing the impact of the COVID-19 outbreak on everyday travel behaviour in Germany and potential implications for future travel patterns. European Transport Research Review, 13(1): 1-11. http://dx.doi.org/10.1186/s12544-021-00486-2
[3] Gostic, K., Gomez, A.C., Mummah, R.O., Kucharski, A.J., Lloyd-Smith, J.O. (2020). Estimated effectiveness of symptom and risk screening to prevent the spread of COVID-19. eLife, 9: e55570. http://dx.doi.org/10.7554/eLife.55570
[4] Jones, J.H., Salathé, M. (2009). Early assessment of anxiety and behavioral response to novel swine-origin influenza A (H1N1). PLoS One, 4(12): e8032. http://dx.doi.org/10.1371/journal.pone.0008032
[5] Lami, F., Al-Obaidi, K.M., Al-Taiar, A., Al-Sonboli, N., Al-Mudhafar, R., Al-Hasnawi, S. (2021). Iraq experience in handling the COVID-19 pandemic: implications of public health challenges and lessons learned for future epidemic preparedness planning. Journal of Public Health, 43(Supplement_3): iii19-iii28. http://dx.doi.org/10.1093/pubmed/fdab369
[6] Hotle, S., Murray-Tuite, P., Singh, K. (2020). Influenza risk perception and travel-related health protection behavior in the US: Insights for the aftermath of the COVID-19 outbreak. Transportation Research Interdisciplinary Perspectives, 5: 100127. http://dx.doi.org/10.1016/j.trip.2020.100127
[7] Parady, G., Taniguchi, A., Takami, K. (2020). Travel behavior changes during the COVID-19 pandemic in Japan: Analyzing the effects of risk perception and social influence on going-out self-restriction. Transportation Research Interdisciplinary Perspectives, 7: 100181. http://dx.doi.org/10.1016/j.trip.2020.100181
[8] Lee, J., Baig, F., Pervez, A. (2021). Impacts of COVID-19 on individuals’ mobility behavior in Pakistan based on self-reported responses. Journal of Transport & Health, 22: 101228. http://dx.doi.org/10.1016/j.jth.2021.101228
[9] Andriyiv, N., Voloshchuk, K., Petrukha, S., Orlovska, O.V., Kurylо, O. (2022). Impact of the Main Threats from COVID-19 on the Labor Market in the Context of Ensuring Economic Security. International Journal of Social Science and Economics, 12(1): 89-101. http://dx.doi.org/10.18280/ijsse.120109
[10] Zubair, H., Karoonsoontawong, A., Kanitpong, K. (2022). Effects of COVID-19 on travel behavior and mode choice: A Case Study for the Bangkok Metropolitan Area. Sustainability, 14(15): 9326. http://dx.doi.org/10.3390/su14159326
[11] Zhang, J., Hayashi, Y., Frank, L.D. (2021). COVID-19 and transport: Findings from a world-wide expert survey. Transport Policy, 103: 68-85. http://dx.doi.org/10.1016/j.tranpol.2021.01.011
[12] Gajendran, N. (2020). Impact of novel Coronavirus (COVID-19) pandemic on travel pattern: A case study of India. Indian Journal of Science and Technology, 13(24): 2491-2501. https://doi.org/10.17485/IJST/v13i24.958
[13] Politis, I., Georgiadis, G., Papadopoulos, E., Fyrogenis, I., Nikolaidou, A., Kopsacheilis, A., Sdoukopoulos, A., Verani, E. (2021). COVID-19 lockdown measures and travel behavior: The case of Thessaloniki, Greece. Transportation Research Interdisciplinary Perspectives, 10: 100345. http://dx.doi.org/10.1016/j.trip.2021.100345
[14] De Haas, M., Faber, R., Hamersma, M. (2020). How COVID-19 and the Dutch ‘intelligent lockdown’ change activities, work and travel behaviour: Evidence from longitudinal data in the Netherlands. Transportation Research Interdisciplinary Perspectives, 6: 100150. https://doi.org/10.1016/j.trip.2020.100150
[15] Sarhan, A.R., Flaih, M.H., Hussein, T.A., Hussein, K.R. (2020). Novel coronavirus (COVID-19) Outbreak in Iraq: The First Wave and Future Scenario. https://pesquisa.bvsalud.org/portal/resource/pt/ppmedrxiv-20138370.
[16] Ferguson, N.M., Laydon, D, Nedjati, G, et al. (2020). Impact of non-pharmaceutical interventions (NPIs) to reduce COVID-19 mortality and healthcare demand. Medical Research Council (MRC), 1-20. https://doi.org/10.25561/77482
[17] Courtemanche, C., Garuccio, J., Le, A., Pinkston, J., Yelowitz, A. (2020). Strong social distancing measures in the united states reduced the COVID-19 growth rate: Study evaluates the impact of social distancing measures on the growth rate of confirmed COVID-19 cases across the United States. Health Affairs, 39(7): 1237-1246. http://dx.doi.org/10.1377/hlthaff.2020.00608
[18] Jameel, A.K., Luaibi, W.K., Alghalibi, I. (2021). The impact of the COVID19 pandemic on shopping trips behavior in urban areas. In F-EIR Conference on Environment Concerns and its Remediation, pp. 289-302. Springer.
[19] Wilder-Smith, I., Freedman, D.O. (2020). Isolation, quarantine, social distancing and community containment: Pivotal role for old-style public health measures in the novel coronavirus (2019-nCoV) outbreak. Journal of Travel Medicine, 27(2): taaa020. http://dx.doi.org/10.1093/jtm/taaa020
[20] Kuqi, I., Millaku, B., Dreshaj, A., Elezaj, E., Karjagdiu, L. (2021). Challenges in the tourism industry during COVID-19 pandemic in Kosovo. International Journal of Sustainable Development and Planning, 16(4): 765-770. http://dx.doi.org/10.18280/ijsdp.160417
[21] Aloi, A., Alonso, B., Benavente, J., Cordera, R., Echániz, E., González, F., Ladisa, C., Lezama-Romanelli, R., López-Parra, Á., Mazzei, V., Perrucci, L., Prieto-Quintana, D., Rodríguez, A., Sañudo, R. (2020). Effects of the COVID-19 lockdown on urban mobility: Empirical evidence from the city of Santander (Spain). Sustainability, 12(9): 3870. http://dx.doi.org/10.3390/su12093870
[22] Shamshiripour, A., Rahimi, E., Shabanpour, R., Mohammadian, A.K. (2020). How is COVID-19 reshaping activity-travel behavior? Evidence from a comprehensive survey in Chicago. Transportation Research Interdisciplinary Perspectives, 7: 100216. http://dx.doi.org/10.1016/j.trip.2020.100216
[23] Abdullah, M., Dias, C., Muley, D., Shahin, M. (2020). Exploring the impacts of COVID-19 on travel behavior and mode preferences. Transportation Research Interdisciplinary Perspectives, 8: 100255. https://doi.org/10.1016/j.trip.2020.100255
[24] De Paz, P., Muller, M., Munoz Boudet, A.M., Gaddis, I. (2020). Gender dimensions of the COVID-19 pandemic. http://dx.doi.org/10.1596/33622
[25] Ali, M.A.J., Ali, M.A.N. (2020). Impacts of health-and service-oriented priorities on commuters' mode choice behaviors before and during COVID-19 pandemic in a developing country. In 13th International (Online) Conference on Transportation Planning and Implementation Methodologies for Developing Countries (TPMDC), Mumbai, India.
[26] Sung, J., Monschauer, Y. (2020). Changes in transport behaviour during the COVID-19 crisis. https://www.iea.org/articles/changes-in-transport-behaviour-during-the-covid-19-crisis.
[27] Beck, M.J., Hensher, D.A. (2020). Insights into the impact of COVID-19 on household travel and activities in Australia – The early days under restrictions. Transport Policy, 96: 76-93. http://dx.doi.org/10.1016/j.tranpol.2020.07.001
[28] Aaditya, Rahul, T. (2021). Psychological impacts of COVID-19 pandemic on the mode choice behaviour: A hybrid choice modelling approach. Transport Policy, 108: 47-58. http://dx.doi.org/10.1016/j.tranpol.2021.05.003
[29] Peruzzo, A.W.J., Ibold, S., Medimorec, N. (2020). COVID-19 and Sustainable Mobility - Early Observations and Documentation. https://transformative-mobility.org/wp-content/uploads/2023/03/2020_05_TUMI_COVID-19-and-Sustainable-Mobility-sMtB7P.pdf.
[30] Bucsky, P. (2020). Modal share changes due to COVID-19: The case of Budapest. Transportation Research Interdisciplinary Perspectives, 8: 100141. http://dx.doi.org/10.1016/j.trip.2020.100141
[31] Alatawi, H., Nezamuddin, N., Darandary, A. (2020). The impact of COVID-19 on transport and gasoline demand. King Abdullah Petroleum Studies and Research Center (“KAPSARC”). https://www.kapsarc.org/file-download.php?i=58509.
[32] Shen, H., Namdarpour, F., Lin, J. (2022). Investigation of online grocery shopping and delivery preference before, during, and after COVID-19. Transportation Research Interdisciplinary Perspectives, 14: 100580. http://dx.doi.org/10.1016/j.trip.2022.100580
[33] Adibfar, A., Gulhare, S., Srinivasan, S., Costin, A. (2022). Analysis and modeling of changes in online shopping behavior due to COVID-19 pandemic: A Florida case study. Transport Policy, 126: 162-176. http://dx.doi.org/10.1016/j.tranpol.2022.07.003
[34] OCHA. (2015). Qadissiya Governorate Profile, https://www.ncciraq.org/images/infobygov/NCCI_Qadissiya_Governorate_Profile.pdf.
[35] Thompson, S.K. (2012). Sampling. John Wiley & Sons, Inc.
[36] Cronbach, L.J. (1951). Coefficient alpha and the internal structure of tests. Psychometrika, 16(3): 297-334. https://doi.org/10.1007/BF02310555
[37] Janssens, W., Wijnen, K., De Pelsmacker, P., Van Kenhove, P. (2008). Marketing Research with SPSS. Pearson Education.
[38] McNemar, Q. (1947). Note on the sampling error of the difference between correlated proportions or percentages. Psychometrika, 12(2): 153-157. http://dx.doi.org/10.1007/BF02295996
[39] Ciechalski, J.C., Pinkney, J.W., Weaver, F.S. (2002). A Method for Assessing Change in Attitude: The McNemar Test.
[40] Armstrong, R.A. (2014). When to use the Bonferroni correction. Ophthalmic and Physiological Optics, 34(5): 502-508. http://dx.doi.org/10.1111/opo.12131
[41] Shier, R. (2004). Statistics: 2.2 the wilcoxon signed rank sum test. Mathematics Learning Support Centre. http://www. statstutor. ac. uk/resources/uploaded/wilcoxonsignedranktest. pdf.
[42] Fay, M.P., Proschan, M.A. (2010). Wilcoxon-mann-whitney or t-test? On assumptions for hypothesis tests and multiple interpretations of decision rules. Statistics Surveys, 4: 1-39. http://dx.doi.org/10.1214/09-SS051
[43] Cleophas, T.J., Zwinderman, A.H. (2016). Non-parametric tests for Three or more samples (friedman and kruskal-Wallis). In Clinicaldata analysis on a pocket calculator, pp. 193-197. Springer.
[44] Sedgwick, P. (2014). Spearman’s rank correlation coefficient. BMJ, 349: g7327. http://dx.doi.org/10.1136/bmj.g7327
[45] Paul, T., Chakraborty, R., Ratri, S.A., Debnath, M. (2022). Impact of COVID-19 on mode choice behavior: A case study for Dhaka, Bangladesh. Transportation Research Interdisciplinary Perspectives, 15: 100665. http://dx.doi.org/10.1016/j.trip.2022.100665
[46] Adeke, P., Zava, A., Etika, A. (2021). The impact of COVID-19 pandemic on travel behaviour of commuters in Makurdi metropolis. Cogent Engineering, 8(1): 1960249. http://dx.doi.org/10.1080/23311916.2021.1960249
[47] Pullano, G., Valdano, E., Scarpa, N., Rubrichi, S., Colizza, V. (2020). Evaluating the effect of demographic factors, socioeconomic factors, and risk aversion on mobility during the COVID-19 epidemic in France under lockdown: A population-based study. The Lancet Digital Health, 2(12): e638-e649. http://dx.doi.org/10.1016/S2589-7500(20)30243-0
[48] Padmakumar, A., Patil, G.R. (2022). COVID-19 effects on urban driving, walking, and transit usage trends: Evidence from Indian metropolitan cities. Cities, 126: 103697. http://dx.doi.org/10.1016/j.cities.2022.103697
[49] Mogaji, E. (2020). Impact of COVID-19 on transportation in Lagos, Nigeria. Transportation Research Interdisciplinary Perspectives, 6: 100154. http://dx.doi.org/10.1016/j.trip.2020.100154
[50] Lee, J., Baig, F., Talpur, M.A.H., Shaikh, S. (2021). Public intentions to purchase electric vehicles in Pakistan. Sustainability, 13(10): 5523. http://dx.doi.org/10.3390/su13105523