Mohammad Khalid Usmani*![]() | Suresh P. Deshmukh
| Suresh P. Deshmukh![]()
©2024 The authors. This article is published by IIETA and is licensed under the CC BY 4.0 license (http://creativecommons.org/licenses/by/4.0/).
OPEN ACCESS
This paper describes the control of temperature rise in photovoltaic panels by using wickless heat pipe cooling technique. These heat pipes take the help of gravity for circulation of their working fluid without using a wick structure. For current thermal management study, two solar panels of same dimensions and two identical gravity assisted wickless heat pipes are designed and fabricated. One of the panels is cooled by using these two heat pipes. Other panel, without heat pipes is used for performance comparison purpose and has been designated as the reference module. In order to have the same operating conditions, these panels have been installed together. Experimental parameters such as voltage, current from both panels, module temperatures along with solar irradiance and ambient temperature are recorded with the help of a data logger. For this study, minute wise data of various parameters have been recorded for the test period of 9 AM to 5 PM, since solar radiation intensity is high during this time period. Actual data tabulation for the analysis has been done at 15 minute intervals. The comparative analysis for each panel has been carried out for various dates and has been presented in this paper. A significant drop in temperature of around10%, corresponding to a temperature reduction of5.96℃, has been estimated in the operating temperature of photovoltaic module equipped with wickless heat pipes. Further, due to the thermal management, in this study, the optimum enhancement in photoelectric conversion efficiency is found to be 7.69%, with 15.4% of panel with cooling and 14.3% of panel without cooling. Similarly optimum improvement of 4.03% in power output has been recorded with 27.09 W from panel with cooling and 26.04 W from the panel with no cooling. The outcomes of this experimental study are highly encouraging in the field of photovoltaics.
solar irradiance, solar panel, thermal management, wickless heat pipe, conversion efficiency, power output
In recent years, it has become increasingly clear that our reliance on fossil fuel resources is not sustainable in the long term. It's becoming more apparent that the fossil fuel era is slowly but surely coming to an end [1]. Recently the worldwide use of non-conventional energy has significantly increased due to environmental and economic reasons. Solar photovoltaic is one of the popular forms of sustainable energy, where solar energy is directly converted into electricity. Research and applications pertaining to photovoltaic plants are constantly growing since they are environmentally friendly, fuel-free, and sustainable [2].
Due to increasing demand of energy globally coupled with fossil fuel depletion, renewable energy sources have received significant attention in recent times. Their regenerative and clean nature has made them a promising substitute for fossil fuels [3]. Fossil fuels are a finite resource and also not eco-friendly. That's why alternative energy sources are becoming increasingly popular. Renewable resources, such as solar energy, are capable of continual energy generation [4].
Solar photovoltaic technology is a popular method of converting solar radiation into electricity. However, it has been established that performance of solar panels declines with temperature increase. Research has shown that only a small part of total solar energy, i.e. around 15% falling on a photovoltaic module is converted in electricity, and almost 85% is transformed into heat energy, which eventually increase its temperature. Further, the photoelectric conversion efficiency of a solar module reduces around 0.5% due to rise in its working temperature by 1°C. This issue can be controlled by rejecting heat from PV panel as one of the solutions [5]. PV cells have been a proven and reliable way of directly converting solar energy into electricity. In 2020, the world witnessed a 22% increase in the generation of electricity in PV sector. After wind and hydro it is the third non-conventional energy resource, generating the electricity. Rapid growth of the PV sector in recent years is attributed to the increasing demand of less operational costs, and green energy as well [6]. A solar cell is the fundamental component of a PV system, with a power output of around 4 Watt. In order to achieve more output power, many solar cells can be connected in series to create a solar module. A single solar module in general has 48, 60, 72, or even more solar cells connected in series. To obtain even more output power, these solar modules are connected in series and parallel to form arrays which is more specifically called as a solar panel [7].
Photovoltaic panels have several advantages such as; conversion of solar radiations directly into electricity, high durability and reliability and low upkeep. However, they also have some drawbacks. For instance, their performance is affected by environmental elements such as cloud cover and dust, as well as daily changes in solar radiation. Additionally, the efficiency of conversion reduces with cell temperature rise. As the photons in the sun radiations hit the solar cells, either they are absorbed or transmitted or reflected. In fact, around 80% of total irradiance that photovoltaic panels receive is converted to heat energy and not into electricity. Effect of temperature on PV module operation has been widely researched, and there is a well-established relationship in conversion efficiency and solar cell temperature [8]. To manage the issue of decreased conversion efficiency due to high temperatures, various cooling solutions have been developed for solar panels. The lifespan of the PV module can also be extended along with improving its photoelectric efficiency by implementing appropriate cooling solutions in order to decrease its temperature. Studies have classified cooling techniques into two categories: passive and active cooling methods. In passive cooling methods typically ambient air is employed to cool down the solar panels, it is more reliable and affordable too. Active cooling methods utilize an external agency to dissipate heat from panel, e.g., fans. While these methods are effective, they require extra power and mounting space [9].
1.1 Cooling of PV modules
Maleki et al. [10] conducted research on cooling approaches for photovoltaic (PV) panels and categorized them as active cooling and passive cooling methods. The authors have considered heat phase change materials (PCM) and heat pipes (HP)cooling techniques for solar modules as passive cooling methods. In addition to PCMs and HPs other passive cooling techniques are also employed to cool PV panels. These include; evaporative, nanofluid, heat sink and thermoelectric cooling techniques, among others [11]. In a study of passive cooling methods, it was found that heat produced by panel was extracted by PCM (phase change material) partially [12]. During a study again on passive method of PV cooling, air flow is directed through the fins at the bottom of solar module, which is created by buoyancy [13]. Results of these studies show an increase in photoelectric conversion efficiency and output power. Tonui et al. [14] conducted a study on extracting heat from photovoltaic panels using both active and passive methods. In their study, air has been used as the medium for cooling to cool PV module. Natural and forced flow of air for cooling photovoltaic system has been investigated in their study. The preheated air generated by this system can be utilized for the applications like industrial and agricultural. They have also incorporated fins in their PVT system on duct rear surface. This arrangement, resulted in remarkable improvement in overall performance of this PVT system.
During a study conducted by Tripanagnostopoulos et al. [15], various hybrid PV systems were compared. The cooling medium used was both water and air. The study included systems such as PVT (photovoltaic thermal), PVT equipped with booster diffuse reflector, PVT equipped with booster diffuse reflector and glazing both. These all systems were compared from a reference photovoltaic panel; without cooling. In all these cases the performance improved as compared to reference panel. A study was conducted by Chow et al. [16]. They compared glazed PVT collectors with unglazed ones. Their findings revealed that glazed collectors demonstrate superior thermal efficiencies while unglazed PVT collectors have good electrical efficiencies. In their study, Yang et al. [17] have examined a PVT module that integrates PV cells and a substrate along with water tubes with the help of special materials in order to enhance the electrical and thermal performances. Mutombo [18] employed a thermosyphon channel of rectangular cross section in his simulation study. He used working fluid as water. The results of this simulation study showed significant improvement in the performance of this PVT system. In this study 38.7% efficiency was achieved in comparison to 14.6% efficiency of a simple PV module without cooling. It is a significant achievement in the PVT field.
1.2 Wickless heat pipes
The importance of energy conservation is growing as fuel prices rise. Thus, it has been shown that the closed two-phase thermosyphons and the normal heat pipes are the two especially useful tools in the heat transfer sector. R.S. Gaugler proposed the fundamental concept of the heat pipe in 1943. G. Grover reimagined the heat pipe concept in 1946 at Los Alamos National Laboratories. Since this period applications of heat pipes have grown in popularity. A thermosyphon circulates liquid in a vertical closed loop circuit without the use of a traditional pump. It is a passive heat exchange technique based on natural convection. By eliminating the expense and complexity of a traditional liquid pump, it is meant to make the pumping of liquid simpler and cost effective. The two-phase closed thermosyphons, which are essentially wickless heat pipes with gravity assistance, have the added benefit of transferring significant amounts of heat through small temperature differences. Their high efficiency, reliability, and low cost make them an efficient device in the field of heat transfer [19].
In conventional heat pipes, a wick layer is used inside the heat pipe container. Evaporator zone of the heat pipes absorbs heat, causing working fluid of the heat pipe to vaporize. The vapor so formed flows to the cold condenser portion of heat pipe due to pressure difference between these two ends; i.e. evaporator and condenser sections. In the condenser zone, vapor releases its heat of condensation and transforms into liquid phase. Now this liquid returns to the evaporator section through the capillary action of the wick. This evaporation-condensation cycle continues till the pressure differential between evaporator and condenser zones exists [6].
Heat pipes that utilize gravity for the circulation of their working fluid and are based on evaporation and condensation principle are called as thermosyphon heat pipes or wickless heat pipes or gravity assisted heat pipes. According to a research paper published by William et al. [20], heat pipes have been found to be a feasible cooling technique for photovoltaic panels. This device effectively absorbs heat from concentrating solar panels and dissipate it passively through natural heat convection process. In a standard heat pipe, evaporator and condenser zones are separated by an adiabatic zone. Figure 1 shows a typical wickless heat pipe. Evaporator section absorbs heat from a source causing working liquid inside heat pipe to vaporize. This vapor then moves to condenser zone. The vapor releases its heat in condenser zone and transforms into liquid phase. This liquid returns to evaporator zone with the effect of gravity, where again the liquid vaporizes and thus this two-phase circulation continues in the heat pipe [21]. Researchers often utilize heat pipe to increase performances of photovoltaic panels and collector systems. These passive heat transfer devices are known for their exceptional thermal conductivity. A heat pipe is capable of transferring huge quantity of heats through two phase phenomena. Heat pipes are used for cooling various devices, like photovoltaic modules, electronic and refrigeration systems. Two-phase closed thermosyphon heat pipes are most widely used among its many types [22]. Heat pipe’s performance is affected with several factors, including the type of working fluid, its material and orientation etc. The heat input to evaporator and the working temperature are the two prime factors for selecting the heat pipe material and its working liquid. Fill ratio is another crucial element that affects the heat pipe performance [23].
Figure 1. Typical wickless heat pipe [24]
Akbarzadeh and Wadowski [25] used gravity assisted heat pipes in their study to cool solar cells. They achieved a 20-fold increase in solar radiation intensity at solar cells through concentrators and successfully maintained the cell temperature below 46℃. This achievement is noteworthy and has promising implications for the field. In a study conducted by Anderson et al. [26] heat pipes were utilized to cool of photovoltaic panels and were successful to achieve 40°C as operating temperature of the panel, while the surrounding temperature was 34℃. The evaporator zone of the heat pipe was attached at backside of solar panels. The condenser zone of heat pipe is not in touch with the panel and extends beyond it. This approach yielded promising results and has potential for further development. Kalogirou and Tripanagnostopoulos [27] conducted experimental studies and reported their results. In this study they utilized an array of micro heat pipes for cooling purpose. On the condenser sides of the heat pipes, they tested both air-cooling and water-cooling techniques for cooling the working fluid. Their findings have promising indications for the development of efficient cooling methods for heat pipes.
Eshghi et al. [22] conducted an experimental study to see the impact of cooling a photovoltaic module with the help of a circular wickless heat pipe. During their experiment, the used single heat pipe with distilled water as working liquid. They used three fill ratios, i.e., 25%, 45%, and 65% for their experiment. Results of this study reveal that 45% is the optimum fill ratio as at this FR the best performance was achieved. It corresponds to 11.29 W power generation against 10.94 W from a panel with no cooling. Hence it can be concluded that an increase of around 3.2% has been obtained due to heat pipe cooling with optimum FR in this study.
An experimental study was performed by Kaneesamkandi et al. [28] to investigate the effect of cooling on solar modules using a single heat pipe thermosyphon. In this study authors have used acetone as working liquid in the heat pipe. They have used different volumes of acetone i.e. 25, 50, 75, and 100 cc in the heat pipe. These volume fractions are equivalent to FR of 3.39%, 6.79%, 10.18%, and 13.58% respectively. They also compared these results, with the results of a panel with no cooling. The outcome of this study reveals that a fill ratio of 6.79% corresponding to 50 cc volume of acetone in heat pipe is the optimum FR, as the panel performance is best at this value. At this fill ratio the average temperature of the solar panel is found to be 55℃ which is least in all cases.
Habeeb et al. [29] conducted an experimental study in order to investigate the impact of wickless heat pipes cooling on photovoltaic panels. The panels were inclined at an angle of 45° and were facing south direction. In the study they used a water box heat exchanger. Condenser portion of all heat pipes were immersed in this water box. This heat pipe- photovoltaic-thermal (HP/PVT) study resulted in performance enhancement of the solar panels. It was observed that both output power and efficiency of the panel increased by implementing this cooling technique. Additionally, due to heat dissipation from condenser sections of the heat pipes in the water box heat exchanger, hot water was also available in the study. In this investigation, three photovoltaic panels have been used. Two panels are cooled with the help of gravity assisted thermosyphon heat pipes, whereas remaining panel with no cooling is used as a reference panel for comparison purpose. Results of this experimental study show that two cooled modules have almost same efficiency of 16.8%, though there is significant difference in their operating temperatures, with 64.06℃ average temperature of panel with copper back plate while it is 76.7℃ with aluminum back plate. Further the average temperature recorded for the module with no cooling is 85.36℃ with efficiency around 15.1% under the same operating conditions.
Kolhe et al. [30] conducted an experimental investigation by using gravity assisted wickless heat pipes in solar collectors to analyze its performance. The study aimed to determine how factors such as tilt angle, concentration of nanoparticle and flow rate of coolant, influenced the efficiency of solar collectors. The authors utilized CuO (copper oxide) nano particles with water to make nano fluids. They have taken three weight concentrations of CuO particles in water, i.e., 0.3%, 0.6% and 0.9%, to be used in heat pipes for their experimental study in order to evaluate their effects on collector performance. The authors used two rates of coolant flow i.e., 4 kg/hr and 8 kg/hr and five tilt angles, i.e., 20°, 31.5°, 40°, 50°, and 60° respectively. The results of this study show that optimum flow rate is 8 kg/hr, at which collector exhibits highest working performance. Also 50° tilt angle is the optimum angle at which the collector performance is the best. The findings of this study also reveal that collectors’ performance improves with increasing concentration of nanoparticles in the water (base fluid). The solar collector performance is maximum when nanoparticle (CuO) concentration is 0.9%, while the performance is least when concentration is zero, i.e., only water is used.
An experimental study was conducted by Basri et al. [31]. They used a 10 W photovoltaic module of monocrystalline type to investigate the effect of cooling on its working performance. In this study they utilized two heat sinks and two heat pipes to increase the heat transfer rate from the module. The flat heat pipes worked as a bridge between the two aluminum heat sinks. This study resulted in 4.1% reduction in panel temperature with 55.4℃ and 57.8℃ respectively with and without cooling. Further an increase of 3.5% in voltage and hence in power output (snice the authors have taken voltage as a power measurement index) has been obtained in this study, with 10.47 V from cooled module and 10.12 V from the module with no cooling.
Shirsagar et al. [32] conducted an experimental study to investigate the performance of a solar collector, by cooling it with the help of gravity assisted thermosyphon heat pipes. The authors used water and a hybrid nanofluid in the heat pipes to test the effects of its cooling on flat plate solar collectors in this experimental study. Boron Nitride (BN, 47%) and Copper Oxide (CuO, 63%) are mixed with 0.5 liters of pure water to form the hybrid nanofluid in this study. Results of this study show that output water temperature from the solar collector equipped with hybrid nanofluid heat pipes has higher temperature as compared to pure water heat pipes. Authors have investigated the effect of tilt angle also on the performance of flat plate solar collectors in this study and found that optimum tilt angle is 31.5° followed by 20° and then 50°. The findings of this study also establish the hybrid nanofluid superior in comparison to pure water, as collector optimum efficiency is 66.0% when hybrid nano fluid is used in heat pipes while it is 57.3% in case of pure water in heat pipes. An experimental investigation was performed by Sinan et al. [33] in order to evaluate the performance improvement of solar collectors by cooling it with the help of gravity assisted wickless heat pipes utilizing two types of nanofluids in them. The researchers have designed and fabricated collectors for their experiment. They created nanofluids by dissolving 2% of TiO2 (titanium dioxide) and Al2O3 (aluminum oxide) particles in water. Authors used 8 heat pipes in this study, each of height 100 cm. This study concludes that instantaneous power and efficiencies are 135.6 W and 48% when distilled water is used in heat pipes, 167.9 W and 58% when Al2O3-water nanofluid is used in heat pipes and 184.0 W and 64% when TiO2-water nanofluid is used. This study's findings confirmed that the best nanofluid is titanium dioxide (TiO2)-water.
Tang et al. [34] performed a study to on cooling of PV modules. In the study authors have used a novel array of micro heat pipes for cooling the modules. The researchers have employed water and air on the condenser side of the heat pipes to see the cooling effect on the photovoltaic modules’ performance. Findings of this study showed that compared to a module without cooling, temperature drop of 4.7℃ occurs in case of cooled module when air has been used as condenser cooling medium. In this case power and efficiency increase respectively by 8.4% and 2.6%. Further, compared to above case temperature drops by 8℃ when water is used as the cooling medium on condenser side. In this case power and efficiency improve respectively by 13.9% and 3%.
Ozbas and Datkayeva [35] conducted a study on passive cooling of solar panels using gravity assisted heat pipes. The authors used three low power panels, each of 10 W. One of the photovoltaic panels was equipped with three wickless pipes containing distilled water as the working fluid in them for cooling purpose. Other panel was cooled with the help of another three heat pipes filled with ethanol as their working fluid. The performance of both of these cooled modules was compared with the third module with no cooling, known as reference module. With average output power values as 8.32 W, 8.27 W and 8.25 W from the modules equipped with water, ethanol and no heat pipes respectively, authors concluded that water is better than ethanol to use in wickless heat pipes for cooling photovoltaic panels.
A study on simulation of solar modules cooled with wickless heat pipes was carried out by Zakariya Kaneesamkandi [36]. Author focused on testing solar panel performance in this study by varying temperatures at which phase change of working liquid occurs in the heat pipes. He used 40℃ and 50℃ as two-phase change temperatures in his study. Author used rectangular tubes working as thermosyphons on the rear side of solar module in order to have proper contact owing to their flat surfaces. The outcome of this study reveals that module maximum temperature drops by 13.8% due to a reduction of 20% in the phase change temperature of the working fluid in the heat pipes.
Two photovoltaic panels of same size (0.660 m×0.440 m) and same power (40 Watt) are fabricated from MxPower Solar Pvt. Ltd. Pune, India, for the current experimental study. In each of them eight solar cells of polycrystalline silicon type have been embedded. Each panel has a power rating of 40 Watt. Two thermosyphon heat pipes are attached at rear side of one of photovoltaic modules. Keeping in view economical aspects of the two copper heat pipes and their special mounting arrangement on the panel and also due to lengthy condenser sections facilitating natural convection, small size modules with low power output have been used for this experimental project. Table 1 shows specifications of these photovoltaic panels.
Table 1. Photovoltaic panel specifications (STC) [37]
|
Parameter |
Specification |
|
Area of PV Module (Am) |
0.66 m×0.44 m |
|
Maximum Rated Power |
40 Watt |
|
Solar Cell Material |
Polycrystalline |
|
Solar Cells per Module |
8 |
|
Area Occupied by Cells (Ac) |
0.635 m×0.318 m |
|
Number of Modules |
2 |
|
Open Circuit Voltage (Voc) |
5.048 V |
|
Short Circuit Current (Isc) |
8.806 A |
|
Voltage at Max Power (Vmp) |
3.287 V |
|
Current at Max Power (Imp) |
7.964 A |
|
Aluminum Back Plate Thickness (ts) |
2 mm |
|
Tilt Angle of Modules (Ɵ) |
19° |
3.1 Heat pipe design
As already mentioned, two wickless heat pipes are designed and fabricated for this experimental work to cool one of the photovoltaic modules. These specially designed heat pipes are manufactured from Siddharth Solar Technergies, Pune India. Container material of these heat pipes is copper. The wickless heat pipe is filled with pure water as the working liquid with 60% fill ratio. Table 2 depicts wickless heat pipe specifications.
Table 2. Wickless heat pipe specifications [37]
|
Parameter |
Specification |
|
Length of Evaporator (Le) |
632 mm |
|
Diameter of Evaporator (De) |
16 mm |
|
Length of Condenser (Lc) |
500 mm |
|
Diameter of Condenser (Dc) |
25.4 mm |
|
Material of Container |
Copper |
|
Working Fluid Used |
Distilled Water |
|
Fill Ratio (FR) |
60 % |
|
Number of Thermosyphons |
02 |
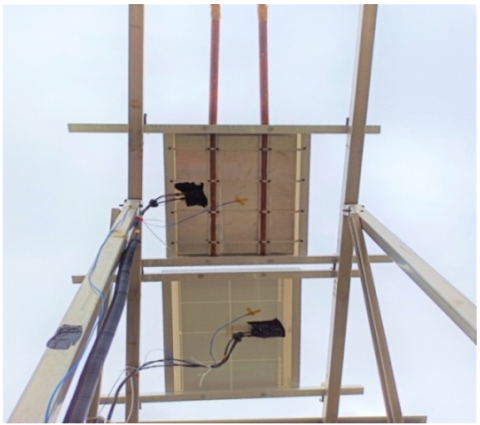
A few modifications have been made in order to enhance the heat transmission rate across the photovoltaic panel and heat pipes’ evaporator zones. For this purpose, two saddles made of stainless-steel material are fixed on the back surface of cooled panel by using four clamping plates. There are semicircular groves cut on these saddles, so that evaporator tubes of the heat pipes tightly fit in those groves. Due to this arrangement heat transfer increases between the two, due to increased surface contact area. Additionally, a 2 mm thick plate of aluminum material (high thermal conductivity) is also pasted at the rear side of solar panel to spread the heat faster. Moreover, in between evaporator surfaces and saddle groove surfaces thermal grease has been applied. This novel arrangement is done to minimize thermal resistance between the two and hence to enhance the heat transfer between the two in order to increase the panel cooling. The same novel technique concept has been employed in between aluminum plate and the photovoltaic panel rear surface. Finally, these arrangements lead to high heat transfer rate between the solar panel and the wickless heat pipes. Further, in order to increase heat transfer rate from condensers of wickless heat pipes to the environment due to the natural convection process, length and diameter of condenser sections of the heat pipes have been taken large, so as to increase the heat transfer area for natural convection. By doing so, the heat transfer rate from condensers of the heat pipes to the atmospheric air improves significantly.
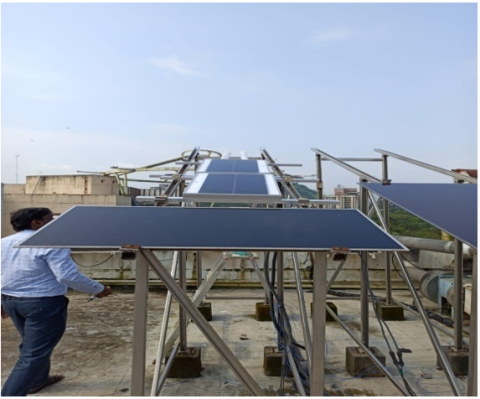
Figure 2. Experimental setup (front view)
3.2 Experimental set up
Figure 2 shows the front view while Figure 3 shows the rear view of the experimental setup. Both solar panels are mounted close to each other on the module rail structure of PVMMS, IIT Bombay. Location of the PVMMS has a longitude of 72.85° E and latitude of 19.01° N. PV modules, along with their rails, have been angled at 19 degrees with respect to the horizontal plane. Additionally, both modules have been installed facing south, so as to capture more radiations from sun. Panel temperatures are recorded using T type thermocouples.
Figure 4 shows the PVMMS (Photovoltaic Module Monitoring Station at NCPRE (National Centre for Photovoltaic Research and Education) IIT Bombay. In the background current experimental setup can be seen. The data of cooled and reference modules has been recorded through data logger of NCPRE, IIT Bombay and stored in a computing device.
Figure 3. Experimental setup (rear view)
Figure 4. PVMMS (Photovoltaic Module Monitoring Station) NCPRE, IIT Bombay
It is widely accepted that efficiency and power output of a photovoltaic module are greatly influenced by its temperature. As panel heats up, its operating temperature rises, which can negatively impact its efficiency. Experts estimate a 0.4% to 0.5% drop in efficiency due to only 1°C rise in panel operating temperature [38]. It has also been stablished that power output from a solar panel decreases when its working temperature increases above STC (standard test condition). More specifically, the output of the panel drops 0.3% to 0.4% corresponding to each 1°C rise in panel temperature over STC [39]. A solar panel module may deteriorate due to elevated operating temperatures in addition to decreased output and efficiency. The module eventually has a lower lifespan as a result of this degradation. Consequently, in order to increase the panel's lifespan, it is crucial to reduce its operating temperature [40]. A conclusion that can be drawn based on the information provided from various studies is that solar photovoltaic panels' performance and lifespan can be enhanced by lowering their working temperature. One can achieve it either by increasing heat dissipation rate from the panel or by reducing the heat accumulation in the PV module. [41].
In the current experimental study, to improve the heat transmission from the photovoltaic module, two basic strategies are employed namely reduction of thermal contact resistance on the evaporator side by using thermal grease (Specifications: Thermal Conductivity $1.8 \mathrm{~W} / \mathrm{mK}$; Thermal Contact Resistance $0.24 \times 10^{-3} \mathrm{~m}^2 \mathrm{~K} / \mathrm{W}$; Operating Temperature Range -68 to $165^{\circ} \mathrm{C}$ ) between panel rear surface and evaporator section of wickless heat pipe. Secondly on the condenser section side of the heat pipes, the heat transfer surface area is increased to enhance the heat transfer rate. For this purpose, diameter and length of condenser zone are kept sufficiently large. It is done as the heat transmission between condenser and the surroundings takes place due to natural convection process, $\mathrm{Q}=\mathrm{h} \mathrm{A} \mathrm{(} \mathrm{Ts}-\mathrm{Ta})$ [42]. Hence, we can feasibly increase the area $A$ for increasing the heat transfer rate Q.
Dates for analysis have been considered as follows:1(Jan. 20), 2(Jan. 31), 3(Feb. 11), 4(Feb. 21), 5(Mar. 4) and 6(Mar. 14), 2023. On all these dates the actual test duration is considered as 9 AM} to 5 PM, as the solar irradiation is significant throughout this time period. Moreover, tabulation of data for each module is done at 15 minutes intervals on various dates.
Eq. (1) has been used to calculate instantaneous photoelectric conversion efficiency for both modules.
$\begin{aligned} & \eta=\frac{\text { Rate of Electrical Energy out (W) }}{\text { Rate of Solar Energy in (W) }} \\ & =\frac{\text { Photovoltaic Power Output }(\mathrm{W})}{\text { Solar Irradiance } \times \text { Area covered by solar cells }(\mathrm{W})}-\mathrm{P} \\ & \end{aligned}$ (1)
where, P stands for power output from the solar panel, calculated using Eq. (2) [41]. Is, stands for incident solar irradiation at the panel surface and Ac is the panel rectangular area, which is occupied with PV cells and at which the solar radiationsfall.
$\mathrm{P}=\mathrm{V} \times \mathrm{I}$ (2)
where, V is voltage and I is current from the PV module.
Rectangular area occupied by PV cells, can be calculated using following expression.
$\mathrm{Ac}=$ Length $\times$ Width $=0.635 \mathrm{~m} \times 0.318 \mathrm{~m}=0.20193 \mathrm{~m}^2$ (3)
Now Eq. (4) is used to calculate the electrical energy generated for each minute during the period of 9 AM to 5 PM, from each panel.
$\Delta \mathrm{Epv}=$ Electrical Power Output $(\mathrm{W}) \times \frac{\Delta \mathrm{t}}{60}$ (4)
where, $\Delta \mathrm{Epv}$, stands for minute wiseelectrical energy generated from panel. $\Delta t$ stands for time resolution, and is taken as 1 minute, since the experiment readings are monitored on minute basis. Power output (in Watt) has been multiplied by $\frac{\Delta t}{60}$ to transform Watt into Watt-hour (Wh) which is the electrical energy unit.
To accurately calculate the total electrical energy generated from each module, these all, minute wise energies generated from each module are added together for actual test duration, i.e., 9 AM} to 5 PM. For this purpose, Eq. (5) has been used.
$\mathrm{Epv}=\sum_{9 \mathrm{am}}^{5 \mathrm{pm}} \Delta \mathrm{Epv}$ (5)
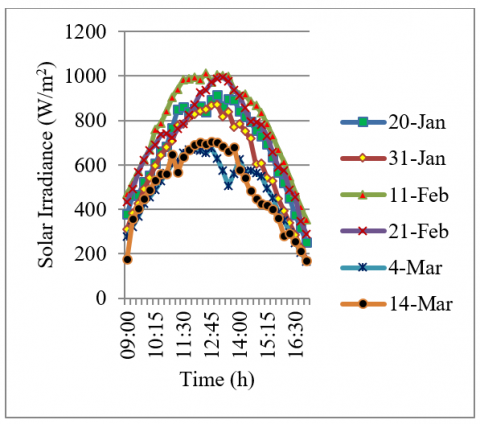
In Figure 5, changes of solar irradiation with respect to time, on all six dates have been displayed. In all the cases the solar irradiance first rises, attains a maximum value and after that it decreases with time, as revealed by the parabolic nature of all the curves as well. From this figure it is evident that solar irradiance is maximum on Feb. 11, while it is minimum on Mar. 4. Keeping this point in view, specific analysis has been carried out for these two dates.
Figure 5. Date wise solar irradiance
The experimental data for the reference module for Feb. 11 is shown in Table 3. Table 4 shows the data for the reference module for the date of Mar. 4. Both tables show data during 11 AM to 2 PM. The actual data tabulation is done for the test duration of 9 AM to 5 PM for all the mentioned six dates and the comparative analysis of both the solar panels is done on the basis of the same.
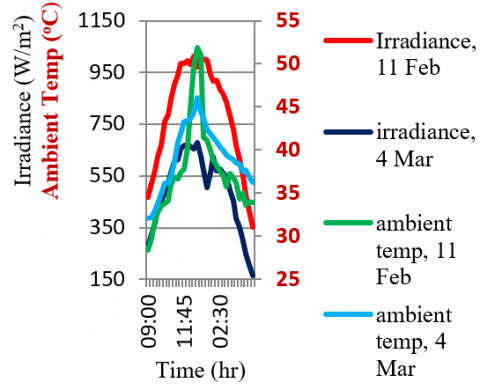
Ambient (environmental) temperatures (right axis, ℃) and irradiance (left axis, W/m2) versus time plots are, for the dates of Feb. 11 and Mar. 4 have been shown in Figure 6. On Feb. 11 solar irradiance values are observed as 1012 W/m2, which is the highest among all dates. On Mar. 4 irradiance values are least and equal to 677 W/m2. In spite of higher irradiance values on Feb. 11, it is noticed that ambient temperatures in general remain lower as compared to Mar. 4. This tendency could be attributed to the high wind velocity, due to which the surrounding temperature is low, except during 12:30 to 1:00 PM when the high solar irradiation predominates and the effects of wind are diminished.
Table 3. Experimental data, reference module, date: 11-02-2023 (11 AM – 2 PM)
|
Time (h) |
Irradiance (w/m2) |
Voltage (Volt) |
Current (Amp) |
Power (W) |
Module Temp (℃) |
Ambient Temp (℃) |
|
11: 00 |
902 |
3.87 |
7.08 |
27.4 |
49.7 |
36.8 |
|
11: 15 |
942 |
3.85 |
7.35 |
28.3 |
49.3 |
36.7 |
|
11: 30 |
984 |
3.85 |
7.74 |
29.8 |
48.9 |
37.3 |
|
11: 45 |
985 |
3.79 |
7.65 |
29.0 |
53.5 |
37.8 |
|
12: 00 |
994 |
3.80 |
7.73 |
29.4 |
52.8 |
40.3 |
|
12: 15 |
983 |
3.80 |
7.41 |
28.1 |
55.2 |
44.8 |
|
12: 30 |
1012 |
3.79 |
7.57 |
28.7 |
56.7 |
49.7 |
|
12: 45 |
972 |
3.61 |
7.42 |
26.8 |
59.1 |
51.8 |
|
1 : 00 |
1003 |
3.62 |
7.50 |
27.1 |
61.5 |
51.0 |
|
1: 15 |
1001 |
3.68 |
7.63 |
28.1 |
56.8 |
41.4 |
|
1 : 30 |
998 |
3.70 |
7.54 |
27.9 |
60.0 |
41.1 |
|
1: 45 |
939 |
3.78 |
7.26 |
27.5 |
55.2 |
39.9 |
|
2 : 00 |
916 |
3.82 |
7.14 |
27.3 |
50.7 |
38.8 |
Table 4. Experimental data, reference module, date: 04-03-2023 (11 AM – 2 PM)
|
Time (h) |
Irradiance (w/m2) |
Voltage (Volt) |
Current (Amp) |
Power (W) |
Module Temp (℃) |
Ambient Temp (℃) |
|
11: 00 |
607 |
3.91 |
5.29 |
20.7 |
51.0 |
38.6 |
|
11: 15 |
613 |
3.77 |
5.43 |
20.5 |
54.8 |
40.9 |
|
11: 30 |
656 |
3.88 |
5.72 |
22.2 |
53.2 |
41.8 |
|
11: 45 |
667 |
3.84 |
5.82 |
22.3 |
55.8 |
43.3 |
|
12: 00 |
668 |
3.80 |
5.86 |
22.3 |
55.7 |
43.4 |
|
12: 15 |
664 |
3.86 |
5.77 |
22.3 |
55.9 |
43.5 |
|
12: 30 |
654 |
3.86 |
5.65 |
21.8 |
56.3 |
44.3 |
|
12: 45 |
677 |
3.79 |
5.88 |
22.3 |
56.9 |
46.0 |
|
1: 00 |
628 |
3.85 |
5.54 |
21.3 |
54.6 |
44.4 |
|
1: 15 |
574 |
3.89 |
5.03 |
19.6 |
52.9 |
43.6 |
|
1: 30 |
506 |
3.89 |
4.50 |
17.5 |
50.0 |
42.3 |
|
1: 45 |
561 |
3.93 |
5.00 |
19.6 |
50.1 |
41.8 |
|
2: 00 |
624 |
3.87 |
5.63 |
21.7 |
51.2 |
41.5 |
Figure 6. Ambient temperature and Irradiance
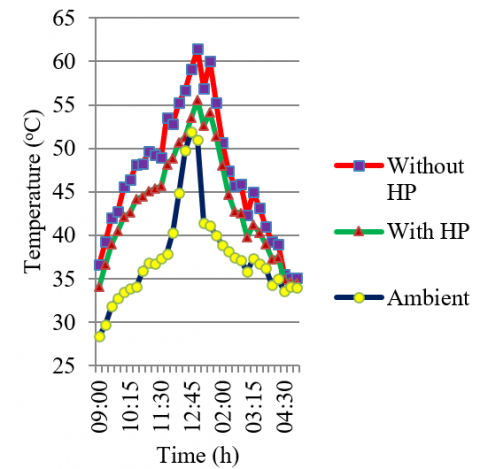
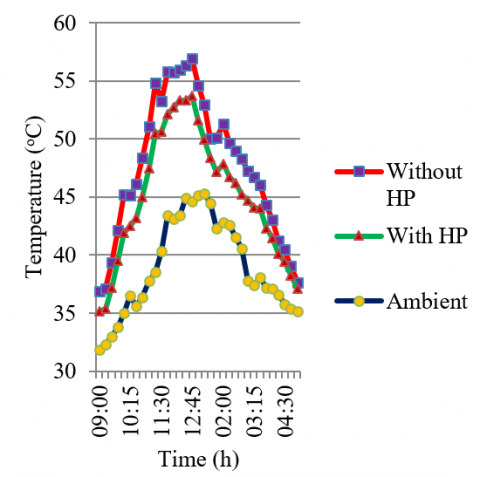
Figure 7(a) and 7(b) show the temperature variations versus time for both panels (with and w/o hp) respectively for the dates of Feb. 11 and Mar. 4. It is clearly visible that in each case, temperature rises first, attains a peak and drops thereafter. value and then again decreases. Ambient(environmental) temperatures versus time are also demonstrated in this figure. After examining this plot and data analysis, on Feb. 11, an optimum temperature reduction of 5.96℃ has been evaluated as a result of cooling solar panel by gravity assisted wickless heat pipes. It corresponds to 9.92% reduction in the panel operating temperature with 54.11℃ of panel with cooling and 60.07℃ of panel without cooling. Further an optimum temperature reduction of 8.03% is determined on Mar. 4, corresponding to 4.41℃ drop in panel working temperature, due to cooling by wickless heat pipes. These results are highly appreciable in the PV technology.
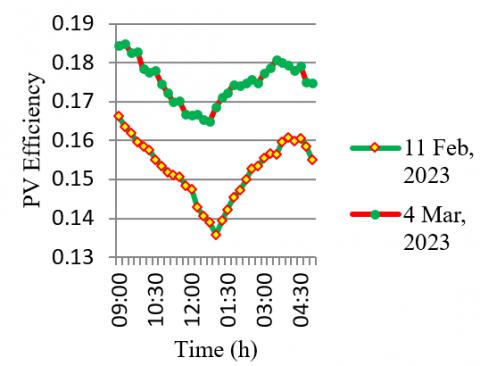
Eq. (1) is used to determine the PV efficiencies The variations of conversion efficiency with time are plotted in Figure 8, for the dates of Feb. 11 and Mar. 4 for the panel equipped with hp. On Mar 4 the efficiencies are high than on Feb. 11 as evident from Figure 8, although on Feb. 11 irradiance values are quite high. Also, it is noticed that during the mid-day the panel efficiencies are least, when the solar radiation intensity is maximum. Hence a conclusion can be drawn that, at high values of solar irradiation the panel efficiencies are low. This characteristic indicates that efficiency of the photovoltaic panels drops down due to increase in temperature of the panel, which is caused due to high solar irradiation. This is supported by several studies on this topic. The maximum efficiencies are calculated as 18.47% and 16.62% respectively on Mar. 4 and Feb. 11.
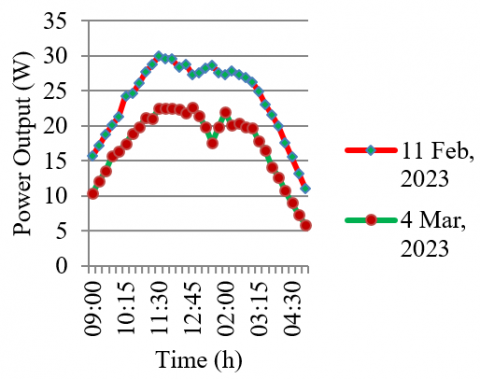
Figure 9 shows the variation of power generated from panel with time for cooled module for both dates. An average 28.69 Watt power output from module with cooling and an average 27.99 Watt from the reference module (with no cooling), on Feb. 11 has been recorded. Likewise average power output of 21.04 Watt from the module with cooling and an average 20.53 Watt power output from the module with no cooling has been evaluated on Mar. 4. However maximum generated power outputs from heat pipe equipped panel on Feb. 11 and Mar. 4 are determined as 29.95 W and 22.58 W respectively as can be observed from Figure 9.
(a)
Figure 7. (a) Temperature of Panel, Feb. 11; (b) Temperature of Panel, Mar. 4
Figure 8. Conversion efficiency for panel with hp
Figure 9 shows the variation of power generated from panel with time for cooled module for both dates. An average 28.69 Watt power output from module with cooling and an average 27.99 Watt from the reference module (with no cooling), on Feb. 11 has been recorded. Likewise average power output of 21.04 Watt from the module with cooling and an average 20.53 Watt power output from the module with no cooling has been evaluated on Mar. 4. However maximum generated power outputs from heat pipe equipped panel on Feb. 11 and Mar. 4 are determined as 29.95 W and 22.58 W respectively as can be observed from Figure 9.
Figure 9. Power output for panel with hp
(a)
(b)
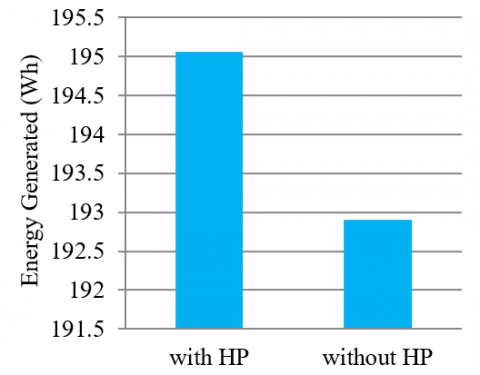
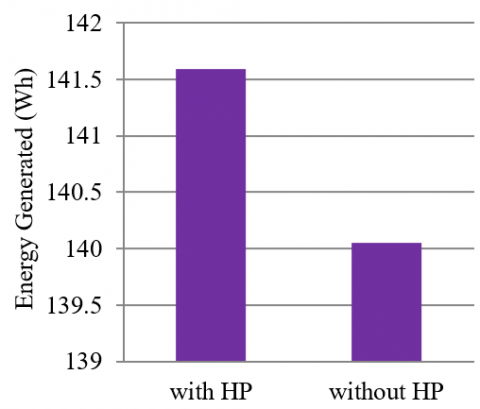
Figure 10. (a) Energy generated (Wh), Feb 11; (b) Energy generated (Wh), Mar 4
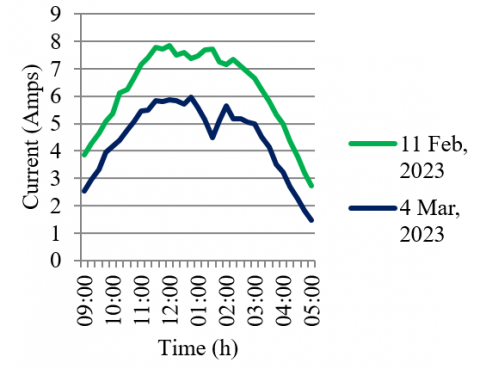
Variation of current with time is shown in Figure 11(a) for the panel with heat pipe cooling on Feb. 11 and Mar. 4. As Figures 9 and 11(a) exactly have the same nature, a conclusion can be drawn that power and current generated from the solar panel are linearly related. In addition, Figure 6, also has the same nature as that of Figures 11(a) and 9. Hence from these figures, it can be interpreted that solar irradiance impacts current linearly which again affects the power output from the solar panel linearly. Further voltage versus time plot is shown in Figure 11(b), which demonstrates that solar irradiance has a negative impact on the voltage. It can easily be observed from this figure that on both dates, the voltage from solar panel is less when solar irradiation is high, i.e., around mid-day.
(a)
(b)
Figure 11. (a) Current Vs time, cooled module; (b) Voltage variation for panel with hp
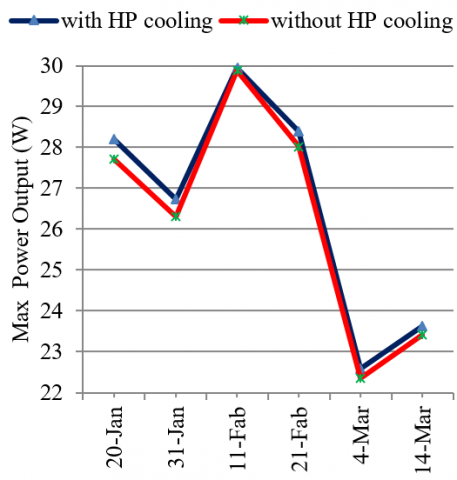
Figure 12(a) shows the maximum conversion efficiencies for both panels on different dates. It can easily be seen that on various dates, conversion efficiencies of cooled module are always more than reference panel with no cooling. The highest value of maximum conversion efficiency, for the cooled module is noticed on Mar. 14, which is 18.96%. Maximum power outputs versus date plot is shown in Figure 12(b). From this figure one can observe that reference panel has always less power output as compared to panel with no cooling. The power output from cooled panel is maximum on Feb. 11, which is around 29.95 Watt.
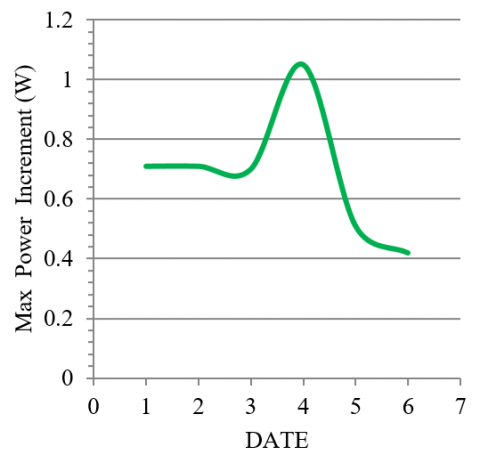
From Figure 12(a) and 12(b) it is well established that convers on efficiency and the power from the heat pipe equipped module are always more than corresponding values from the module with no cooling. However, the difference between the two values keeps varying with respect to time for efficiency and power on various dates. Figure 13(a) and 13(b) respectively demonstrate the maximum change in conversion efficiency and power output on various dates. From Figure 13(a) it is clearly visible that maximum difference in conversion efficiency occurs on date 2 (i.e., Jan. 31) which has been found as 1.1%, with 15.4% of cooled module and 14.3% of normal module. This increase in conversion efficiency because of wickless heat pipe application has been estimated to be 7.69%, which of course is quite encouraging. Similarly, the power output’s maximum difference is achieved on date 4 (i.e., Feb. 21) which is estimated to be 1.05 W, with 27.09 Watt from the module with cooling and 26.04 Watt from the module with no cooling. This corresponds to an enhancement of 4.03% in power output, which again is very promising.
(a)
(b)
Figure 12. (a) Maximum conversion efficiency; (b). Maximum power output
(a)
(b)
Figure 13. (a) Maximum efficiency increment Vs date; (b). Maximum power increment Vs date
To increase the performance, reliability and the life span of obsolete equipments as well as to create new, affordable, high-quality technological samples, heat pipes are frequently utilized. Solar photovoltaic collectors, concentrating photovoltaic, solar thermal collectors and concentrating solar plants are among solar energy systems and equipments that employ heat pipes extensively nowadays. In the current experimental thermal management study based on heat pipe cooling of photovoltaic panels, the data analysis for various dates has been performed and the performance results are presented. The optimum temperature reduction in the photovoltaic panel equipped with wickless heat pipes has been achieved as 5.96℃ which corresponds to around 10% reduction in module operating temperature. Also, it is noticed that for the cooled module, the maximum photoelectric conversion efficiency is around 19% and maximum photovoltaic power output is around 30 W. Generated electrical energy from the cooled module during the period of 9 AM to 5 PM has been estimated to be195.06 Wh on Feb. 11 and 141.59 Wh on Mar. 4. Further from the overall analysis of this study, it is observed that a maximum enhancement in conversion efficiency of 7.69% and a maximum power output improvement of 4.03% from the solar photovoltaic panel has been accomplished due to the application of wickless heat pipe on the photovoltaic panel. The experimental results of this thermal management study are highly promising and align well with the conclusions drawn by several researchers, which indicates that photovoltaic panel cooling with heat pipe is a realistic, viable and an effective cooling approach. Increasing heat pipe numbers, varying heat pipe’s geometries, using nano fluids with different fill ratios and concentrations, implementing efficient condenser cooling methods and improved methods of heat transmission across photovoltaic panels and the evaporator sections of the wickless heat pipes are the other areas, one can further investigate to check the performance of photovoltaic panels.
The Authors would like to express their sincere gratitude and thank to the National Centre for Photovoltaic Research and Education (NCPRE), IIT Bombay India, for conducting this experimental research work under its Photovoltaic Users and Mentorship Program.
|
A |
area, m2 |
|
D |
diameter, m |
|
E |
total electrical energy generated, Wh |
|
∆E |
electrical energy generated per minute, Wh |
|
I |
current from module, Amps |
|
Is |
solar Irradiance, W/m2 |
|
L |
length, m |
|
P |
power output from module, W |
|
T |
temperature, ℃ |
|
T |
time, h |
|
V |
voltage from module, Volts |
|
Greek symbols |
|
|
$\Theta$ |
inclination angle, deg |
|
$\eta$ |
conversion efficiency, % |
|
Subscripts |
|
|
a |
ambient |
|
c |
condenser |
|
e |
evaporator |
|
m |
module |
|
mp |
maximum power |
|
sc |
short circuit |
|
oc |
open circuit |
|
Abbreviations |
|
|
FR |
filling ratio |
|
HP |
heat pipe |
|
PV |
photovoltaic |
|
PVT |
photovoltaic-thermal |
|
PVMMS |
photovoltaic module monitoring station |
|
STC |
standard test condition |
|
Sample Energy Analysisthrough Excel Sheet (Only Last Cells) |
|||||||
|
Power(W) |
Energy (Wh) |
Power (W) |
Energy (Wh) |
Power (W) |
Energy (Wh) |
Power (W) |
Energy (Wh) |
|
13.90702 |
0.231784 |
14.12893 |
0.235482 |
7.668309 |
0.127805 |
7.827706 |
0.130462 |
|
13.62505 |
0.227084 |
13.91128 |
0.231855 |
7.586779 |
0.126446 |
7.709621 |
0.128494 |
|
13.51566 |
0.225261 |
13.6603 |
0.227672 |
7.51609 |
0.125268 |
7.612271 |
0.126871 |
|
13.24585 |
0.220764 |
13.51734 |
0.225289 |
7.428216 |
0.123804 |
7.570268 |
0.126171 |
|
13.09826 |
0.218304 |
13.29856 |
0.221643 |
7.226661 |
0.120444 |
7.401323 |
0.123355 |
|
12.93979 |
0.215663 |
13.19905 |
0.219984 |
7.128971 |
0.118816 |
7.323685 |
0.122061 |
|
12.67404 |
0.211234 |
12.99335 |
0.216556 |
7.04217 |
0.11737 |
7.193934 |
0.119899 |
|
12.63407 |
0.210568 |
12.87406 |
0.214568 |
6.885019 |
0.11475 |
7.066124 |
0.117769 |
|
12.50516 |
0.208419 |
12.66708 |
0.211118 |
6.845477 |
0.114091 |
6.929207 |
0.115487 |
|
12.21874 |
0.203646 |
12.50405 |
0.208401 |
6.664383 |
0.111073 |
6.862911 |
0.114382 |
|
12.20956 |
0.203493 |
12.49826 |
0.208304 |
6.543455 |
0.109058 |
6.695407 |
0.11159 |
|
12.09227 |
0.201538 |
12.32214 |
0.205369 |
6.492151 |
0.108203 |
6.602332 |
0.110039 |
|
12.02032 |
0.200339 |
12.30664 |
0.205111 |
6.391931 |
0.106532 |
6.507172 |
0.108453 |
|
11.83082 |
0.19718 |
12.02266 |
0.200378 |
6.296034 |
0.104934 |
6.43428 |
0.107238 |
|
11.68429 |
0.194738 |
11.88808 |
0.198135 |
6.244358 |
0.104073 |
6.423688 |
0.107061 |
|
11.4887 |
0.191478 |
11.77527 |
0.196255 |
6.219932 |
0.103666 |
6.370626 |
0.106177 |
|
11.398 |
0.189967 |
11.65848 |
0.194308 |
6.12092 |
0.102015 |
6.276262 |
0.104604 |
|
11.37216 |
0.189536 |
11.63624 |
0.193937 |
6.030343 |
0.100506 |
6.133629 |
0.102227 |
|
10.96436 |
0.182739 |
11.36603 |
0.189434 |
5.881907 |
0.098032 |
6.025487 |
0.100425 |
|
10.98711 |
0.183119 |
11.27384 |
0.187897 |
5.76067 |
0.096011 |
5.960486 |
0.099341 |
|
10.85139 |
0.180857 |
11.08461 |
0.184744 |
5.69463 |
0.094911 |
5.844229 |
0.097404 |
|
192.904 |
195.068 |
140.0507 |
141.5975 |
||||
|
(Feb 11, w/o HP) |
(Feb 11, with HP) |
(March 4, w/o HP) |
(March 4, with HP) |
||||
Table 1. Date wise parameters_1
|
DATE |
Max Power With HP (W) |
Avg Power With HP (W) |
Max Power W/O HP (W) |
Avg Power W/O HP (W) |
Max Effcy With HP (%) |
Max Effcy W/O HP (%) |
Max EffcyDiffrnce (%) |
Max Power Difrnce (%) |
|
20/01/23 |
28.2 |
21.58 |
27.71 |
21.39 |
17.66,900 |
17.55,900 |
0.43,215 |
0.71,215 |
|
31/01/23 |
26.74 |
19.50 |
26.3 |
19.23 |
16.83,915 |
16.78,915 |
1.10,500 |
0.71,200 |
|
11/02/23 |
29.95 |
24.02 |
29.89 |
23.79 |
16.62,900 |
16.40,900 |
0.34,130 |
0.70,130 |
|
21/02/23 |
28.39 |
21.38 |
28.02 |
21.14 |
15.67,900 |
15.42,900 |
0.55,145 |
1.05,145 |
|
04/03/23 |
22.58 |
17.43 |
22.35 |
17.24 |
18.47,915 |
18.24,915 |
0.47,445 |
0.51,1115 |
|
14/03/23 |
23.62 |
17.38 |
23.41 |
17.18 |
18.96,900 |
18.85,900 |
0.44,445 |
0.42,1145 |
Table 2. Date wise parameters_2
|
DATE |
Max Solar Irradiance (W/m2) |
Avg Solar Irradiance (W/m2) |
Cooled Module Avg Temp (oC) |
Reference Module Avg Temp (oC) |
Ambient Average Temp (oC) |
|
20/01/23 |
915.77 |
679.80 |
41.27 |
44.36 |
31.16 |
|
31/01/23 |
872.3 |
613.97 |
38.67 |
41.76 |
35.85 |
|
11/02/23 |
1012.85 |
787.35 |
43.72 |
47.07 |
37.51 |
|
21/02/23 |
995.83 |
724.71 |
43.46 |
46.33 |
37.89 |
|
04/03/23 |
677.52 |
496.75 |
45.09 |
47.63 |
39.25 |
|
14/03/23 |
706.94 |
498.22 |
44.61 |
46.92 |
38.96 |
Table 3. Date wise parameters_3
|
Date |
Average Irradiation (W/m2) |
Average Efficiency with HP (%) |
Average Efficiency W/O HP (%) |
Total Energy Generated with HP(Wh) |
Total Energy Generated W/O HP (Wh) |
|
20/01/23 |
679.80 |
15.84 |
15.78 |
175.27 |
173.26 |
|
31/01/23 |
613.97 |
15.83 |
15.60 |
158.27 |
156.58 |
|
11/02/23 |
787.35 |
15.26 |
15.11 |
195.06 |
192.90 |
|
21/02/23 |
724.71 |
14.68 |
14.50 |
172.79 |
170.88 |
|
04/03/23 |
496.75 |
17.49 |
17.28 |
141.59 |
140.05 |
|
14/03/23 |
498.22 |
17.46 |
17.24 |
142.62 |
141.12 |
[1] Sukhatme, S.P., Nayak, J.K. (2013). Solar energy: Principles of thermal collection and storag. 3rd Edition, Publisher; McGraw Hill Education, New York, USA.
[2] Shaaban, A., Mosa, M., El Samahy, A., Abed, K. (2023). Enhancing the performance of photovoltaic panels by cooling: A review. International Review of Automatic Control, 16(1): 26-43. https://doi.org/10.15866/ireaco.v16i1.23181
[3] Amelia, A.R., Irwan, Y.M., Irwanto, M., Leow, W.Z., Gomesh, N., Safwati, I., Anuar, M.A.M. (2016). Cooling on photovoltaic panel using forced air convection induced by dc fan. International Journal of Electrical and Computer Engineering, 6(2): 526-534. https://doi.org/10.11591/ijece.v6i2.9118
[4] Harahap, H.A., Dewi, T., Rusdianasari. (2019). Automatic cooling system for efficiency and output enhancement of a PV system application in Palembang, Indonesia. IOP Conf. Series: Journal of Physics: Conf. Series, 1167: 012027. https://doi.org/10.1088/1742-6596/1167/1/012027
[5] Heidari, N., Rahimi, M., Azimi, N. (2019). Cooling enhancement of a photovoltaic panel through ferrofluid stimulation using a magnetic-wind turbine. Iranian Journal of Chemical Engineering (IJChE), 16(4): 35-52. https://dorl.net/dor/20.1001.1.17355397.2019.16.4.4.4
[6] Sabry, M., Lashin, A. (2023). Performance of a heat-pipe cooled concentrated photovoltaic/thermoelectric hybrid system. Energies, 16(3): 1438. https://doi.org/10.3390/en16031438
[7] Vidyanandan, K.V. (2017). An overview of factors affecting the performance of solar PV systems. Energy Scan, 27(28): 216.
[8] Hudișteanu, S.V., Cherecheș, N.C., Popovici, C.G., Verdeș, M., Ciocan, V., Balan, M.C., Turcanu, F.E., Scurtu, I.C. (2021). Effect of cooling on power generated by photovoltaic panels. In IOP Conference Series: Materials Science and Engineering, 1141(1): 012008. https://doi.org/10.1088/1757-899X/1141/1/012008
[9] Praveenkumar, S., Gulakhmadov, A., Agyekum, E.B., Alwan, N., Velkin, V.I., Sharipov, P., Safaraliev, M. Chen, X. (2022). Experimental study on performance enhancement of a photovoltaic module incorporated with CPU heat pipe-A 5E analysis. Sensors, 22(17): 6367. https://doi.org/10.3390/s22176367
[10] Maleki, A., Haghighi, A., Assad, M.E.H., Mahariq, I., Nazari, M.A. (2020). A review on the approaches employed for cooling PV cells. Solar Energy, 209: 170-185. https://doi.org/10.1016/j.solener.2020.08.083
[11] Dwivedi, P., Sudhakar, K., Soni, A., Solomin, E., Kirpichnikova, I. (2020). Advanced cooling techniques of PV modules: A state of art. Case studies in thermal engineering, 21: 100674. https://doi.org/10.1016/j.csite.2020.100674
[12] Ciulla, G., Brano, V.L., Cellura, M., Franzitta, V., Milone, D. (2012). A finite difference model of a PV-PCM system. Energy Procedia, 30: 198-206. https://doi.org/10.1016/j.egypro.2012.11.024
[13] Tonui, J.K., Tripanagnostopoulos, Y. (2008). Performance improvement of PV/T solar collectors with natural air flow operation. Solar energy, 82(1): 1-12.. https://doi.org/10.1016/j.solener.2007.06.004
[14] Tonui, J.K., Tripanagnostopoulos, Y. (2007). Improved PV/T solar collectors with heat extraction by forced or natural air circulation. Renewable energy, 32(4): 623-637. https://doi.org/10.1016/j.renene.2006.03.006
[15] Tripanagnostopoulos Y, Nousia T.H, Souliotis M, Yianoulis P. (2002). Hybrid photovoltaic/thermal solar systems. Sol Energy, 72: 217–234. https://doi.org/10.1016/S0038-092X(01)00096-2
[16] Chow, T.T., Pei, G., Fong, K.F., Lin, Z., Chan, A.L.S., Ji, J. (2009). Energy and exergy analysis of photovoltaic–thermal collector with and without glass cover. Applied Energy, 86(3): 310-316. https://doi.org/10.1016/j.apenergy.2008.04.016
[17] Yang, D.J., Yuan, Z.F., Lee, P.H., Yin, H.M. (2012). Simulation and experimental validation of heat transfer in a novel hybrid solar panel. International Journal of Heat and Mass Transfer, 55(4): 1076-1082. https://doi.org/10.1016/j.ijheatmasstransfer.2011.10.003
[18] Mutombo, N., Inambao, F., Bright, G. (2016). Performance analysis of thermosyphon hybrid photovoltaic thermal collector. Journal of Energy in Southern Africa, 27(1): 28-38. https://doi.org/10.17159/24133051/2016/v27i1a1564
[19] Ade Hussien, A.K.A. (2013). Modeling of transient response of the wickless heat pipes. Ph. D. Thesis. Department of Mechanical Power Engineering, Al-Azhar University, Cairo, Egypt.
[20] Anderson, W., Tamanna, S., Sarraf, D., Dussinger, P., Hoffman, R. (2008). Heat pipe cooling of concentrating photovoltaic (CPV) systems. In 6th International Energy Conversion Engineering Conference (IECEC), 5672. https://doi.org/10.2514/6.2008-5672
[21] Akhtar, M.S., Bux, S. (2017). Comparative exploration of thermal performance of methanol & ethanol fluid wickless copper heat pipes. International Journal of Innovative Research in Science, Engineering and Technology, 6(7): 13209-13216.
[22] Eshghi, H., Kahani, M., Zamen, M. (2022). Cooling of photovoltaic panel equipped with single circular heat pipe: an experimental study. Renewable Energy Research and Applications, 3(2): 229-235. https://doi.org/10.22044/rera.2022.11523.1097
[23] Al-Joboory, H.N.S. (2020). Experimental investigation of gravity-assisted wickless heat pipes (thermosyphons) at low heat inputs for solar application. Archives of Thermodynamics, 41(2): 257-276. 10.24425/ather.2020.133632
[24] Faghri, A. (1995). Heat pipe science and technology. 1st ed., Taylor & Francis Publishers, Washington, D.C., USA.
[25] Akbarzadeh, A., Wadowski, T. (1996). Heat pipe-based cooling systems for photovoltaic cells under concentrated solar radiation. Applied thermal engineering, 16(1): 81-87. https://doi.org/10.1016/1359-4311(95)00012-3
[26] Anderson, W.G., Dussinger, P.M., Sarraf, D.B., Tamanna, S. (2008). Heat pipe cooling of concentrating photovoltaic cells. In 2008 33rd IEEE Photovoltaic Specialists Conference, 1-6. https://doi.org/10.1109/PVSC.2008.4922577
[27] Kalogirou, S.A., Tripanagnostopoulos, Y. (2005). Performance of a hybrid PV/T thermosyphon system. In Regional World Renewable Energy Congress, 1162-1167.
[28] Kaneesamkandi, Z., Almalki, M. J., Sayeed, A., Haidar, Z. A. (2023). Passive cooling of PV modules using heat pipe thermosiphon with acetone: Experimental and theoretical study. Applied Sciences, 13(3): 1457. https://doi.org/10.3390/app13031457
[29] Habeeb, L.J., Mutasher, D.G., Abd Ali, F.A.M. (2018). Solar Panel Cooling and Water Heating with an Economical Model Using Thermosyphon. Jordan Journal of Mechanical & Industrial Engineering, 12(3): 189-196.
[30] Kolhe, R., Bhangale, J.H., Kumbharde, K. (2015). Evaluation of the thermal performance of thermosyphon heat pipe solar collector with copper oxide as nanofluid. International Journal of Scientific and Research Publications, 5(10): 1-6.
[31] Basri, M.H.M., Kamaruzaman, Z., Idrus, F., Hussin, N., Saad, I. (2022). Heat pipe as a passive cooling device for PV Panel Performance Enhancement. Journal of Advanced Research in Applied Sciences and Engineering Technology, 28(2): 190-198. https://doi.org/10.37934/araset.28.2.190198
[32] Kshirsagar, K.B., Tamboli, A.A., Gaikwad, S.S., (2015). Thermal performance of wickless heat pipe flat plate solar collector with CuO-bn/water hybrid nanofluid. International Engineering Research Journal, 155-160,
[33] Ünvar, S., Menlik, T., Sözen, A., Ali, H.M. (2021). Improvement of heat pipe solar collector thermal efficiency using Al2O3/Water and TiO2/Water nanofluids. International Journal of Photoenergy, 2021: 1-13. https://doi.org/10.1155/2021/5546508
[34] Tang, X., Quan, Z., Zhao, Y. (2010). Experimental investigation of solar panel cooling by a novel micro heat pipe array. Energy Power Eng, 2(3): 171-174. https://doi.org/10.4236/epe.2010.23025
[35] Özbaş, E., Datkayeva, G. (2020). Experimental Investigation of the Effect of Gravity Assisted Heat Pipe on Photovoltaic Panel as Passive Cooling. Technology, 6(2): 23-32. https://doi.org/10.26579/jocrest.58
[36] Kaneesamkandi, Z. (2016). Steady state thermal analysis of thermosyphon heat pipe photovoltaic panel cooling mechanism. International Journal for Modern Trends in Science and Technology, 2(1): 7-10.
[37] Usmani, M.K., Deshmukh, S.P. (2023). Experimental study on performance improvement of photovoltaic panels using thermosyphon heat pipes. International Journal on Energy Conversion, 11(6): 213-224. https://doi.org/10.15866/irecon.v11i6.24165
[38] Sudhakar, P., Santosh, R., Asthalakshmi, B., Kumaresan, G., Velraj, R.J.R.E. (2021). Performance augmentation of solar photovoltaic panel through PCM integrated natural water circulation cooling technique. Renewable Energy, 172: 1433-1448. https://doi.org/10.1016/j.renene.2020.11.138
[39] Mosalam, H.A. (2018). Experimental investigation of temperature effect on PV monocrystalline module. Int. J. Renew. Energy Res, 8(1): 365-373.
[40] Kurtz, S., Whitfield, K., TamizhMani, G., Koehl, M., Miller, D., Joyce, J., Bosco, N., Kempe, M., Zgonena, T. (2011). Evaluation of high‐temperature exposure of photovoltaic modules. Progress in photovoltaics: Research and applications, 19(8): 954-965. https://doi.org/10.1002/pip.1103
[41] Silverman, T.J., Deceglie, M.G., Subedi, I., Podraza, N. J., Slauch, I.M., Ferry, V.E., Repins, I. (2018). Reducing operating temperature in photovoltaic modules. IEEE Journal of Photovoltaics, 8(2): 532-540. https://doi.org/10.1109/JPHOTOV.2017.2779842
[42] Sachdeva, R.C. (2006). Fundamentals of Engineering Heat and Mass Transfer (SI Units). New Age International Publishers.