Wahyu H. Piarah![]() | Muhammad R. Yamani | Zulkifli Djafar | Indar C. Gunadin
| Muhammad R. Yamani | Zulkifli Djafar | Indar C. Gunadin![]() | Zaenab Muslimin
| Zaenab Muslimin![]() | Bidayatul Arminah
| Bidayatul Arminah![]() | Iwan Setyawan
| Iwan Setyawan![]() | Zuryati Djafar*
| Zuryati Djafar*![]()
© 2024 The authors. This article is published by IIETA and is licensed under the CC BY 4.0 license (http://creativecommons.org/licenses/by/4.0/).
OPEN ACCESS
Data centers, serving as vital support infrastructure for telecommunications and data storage systems, allocate nearly half of their total electricity consumption - approximately 50% - to cooling systems for temperature and humidity regulation. Enhancing the efficiency of these systems is crucial for energy conservation and reducing operational costs in data centers. In this regard, the integration of flexible heat pipes presents a promising solution for alleviating the data center's heat load. Heat pipes, as passive cooling system technologies, function by absorbing heat on one side while simultaneously releasing it on the other. Strategically positioned in the air ducts subsequent to the data server, these pipes aim to lower the air temperature, thereby reducing the burden on the cooling system. This study focuses on evaluating the effectiveness of heat pipes in transferring heat from the air within hot air ducts, considering variables such as the density distance between the pipes and their operating tilt angle. Distances between the heat pipes vary from 3 mm to 6 mm, with tilt angles set at 0°, 15°, and 30°. The results reveal that lower density distances lead to higher heat ab sorption; specifically, for a slope of 0°, densities of 6 mm, 5 mm, 4 mm, and 3 mm correspond to heat absorptions of 2.749 kW, 2.545 kW, 2.448 kW, and 2.358 kW, respectively. Additionally, smaller tilt angles result in greater heat absorption, with a 3 mm density at slopes of 30°, 15°, and 0° yielding 2.017 kW, 2.125 kW, and 2.749 kW, respectively. Optimal heat transfer occurs at a density of 3mm and a slope of 0°, where the heat pipe can transfer 2.749 kW of heat out of the cooling system and reduce the temperature of the air flowing through it by 13℃.
data center, cooling system efficiency, flexible heat pipes, passive cooling technology, heat transfer, air ducts, temperature regulation
The increasingly rapid growth of the digital economy will be followed by an increase in the number of internet users. Therefore, the construction of various supporting facilities, including data centers, will play quite an important role. One thing driving the increase in demand for data centers is the Internet of Things (IoT). This is because digital services cannot be separated from everyday life.
As the economy and society shift towards digital information management, data centers are now ubiquitous. Universities, large companies, and government institutions also utilize and operate data centers for information and communication management functions. This shift will result in an increase in a country's electricity consumption for data center use. According to US data center electrical energy usage reports, data centers were estimated to consume approximately 61 billion kilowatt-hours (kWh) of electricity in 2006 (accounting for 1.5% of total US electricity consumption), with total electricity costs reaching approximately $4.5 billion (2006 dollars) [1]. According to statistics published by the infotech group [2], the most substantial use of electrical power in a data center is attributed to the cooling system, which constitutes 50% of the total electrical power used in the data center. A cooling system is essential for data centers to maintain optimal server temperature, prevent overheating, and ensure optimal functionality.
In a data center system, IT devices emit large amounts of heat, making temperature and humidity control crucial for the data center to continue working optimally. Based on data from the 2018 data center, electricity consumption almost reached 1% of the world’s electricity needs [1]. The amount of electricity consumed is estimated to increase by 15-20% per year in the future [2]. Among the total energy consumption in a data center, cooling and ventilation systems account for around 40% to 50% of electricity usage [3]. This is due to several reasons, including the constant operation of chillers in air conditioning systems throughout the year, the substantial electricity usage by pumps and fans for air circulation, and the ineffectiveness of air flow due to the mixing of cold and hot air, thereby increasing the cooling load [4]. Therefore, improving the efficiency of the cooling system is important to save energy and costs in data center operations [5].
There are several effective ways to reduce energy consumption in data center cooling, including optimizing indoor air distribution, enhancing heat transfer for server racks, improving chiller thermal performance, and so on. Naturally, these diverse methods must be adapted to various data center conditions, such as limited space, electricity usage by components like fans or pumps, machine maintenance costs, their impact on humidity, and so on [6, 7].
A heat pipe is a passive heat exchange device known for its relatively high heat transfer rate. It is deemed passive because it does not require input energy to facilitate heat transfer. The incorporation of heat pipes in the return air duct can lower the air temperature, thereby reducing the cooling load on the Computer Room Air Conditioner (CRAC) [8]. This temperature decrease is attributed to the heat-absorbing properties of the heat pipe.
According to research by Zhang et al. [5], the utilization of heat pipes, when compared with ordinary heat exchangers, can enhance cooling efficiency by up to 3-5 times, leading to a significant reduction in the Power Usage Effectiveness (PUE) value. Additionally, research conducted by Djafar et al. [6], exploring the impact of heat pipes on the application of thermoelectric modules, reveals that the use of heat pipes could amplify power output by approximately six times. This demonstrates the ability of heat pipes to transfer heat more rapidly and effectively. Gunawan et al. [9] highlighted that the hybrid system, combining solar heat with a heat pipe heat exchanger for drying coffee beans, accelerates the drying process by about 23% compared to relying solely on solar energy. Similarly, Hakim et al. [10] asserted that the incorporation of heat pipes significantly influences the precooling and reheating processes in HVAC systems, increasing the coefficient of performance (COP) by 39.9% compared to HVAC systems without heat pipes. Nuriyadi et al. [11] concluded that integrating heat pipes into modular AC systems for electric buses enhances the cooling capacity by around 15% while concurrently reducing the power consumption of the AC system by an average of approximately 28%.
In this research, we will observe the performance of heat pipes in the return air duct system, considering various variations in the distance between heat pipes and changes in the slope of the heat pipe position. The anticipated outcome is that the results obtained will offer a viable solution for the data center's return air duct, effectively contributing to the reduction of heat load on the cooling unit and concurrently decreasing power consumption.
2.1 Data center
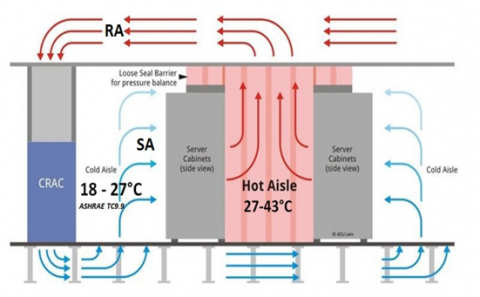
A data center is a facility that houses servers and other components requiring regular maintenance to operate optimally. The size of a data center is determined by factors such as the number of servers, their capacity, and user count. Small-scale data centers are typically found at universities or offices, while larger ones are operated by companies like Google and Amazon [12]. In general, the temperature recorded on the hot aisle of a data center ranges between 80℉ and 10℉ (26.7-43.3℃). The recommended cold-side temperature, according to ASHRAE, is 18-27℃ [8]. Maintaining temperatures within this range is crucial to prevent server issues such as overheating [13]. Figure 1 illustrates a schematic of airflow in a typical data center. The supply air (SA) comes from the computer room air conditioner (CRAC) used to cool the server. Due to the server's heat, the air temperature increases. Return air (RA) originating from the server is then circulated back to the CRAC.
Figure 1. Data center airflow [8]
2.2 Heat pipes
A heat pipe is a two-phase flow heat transfer device where the process occurs from liquid to vapor and vice versa. It circulates between the evaporator and condenser sides with high thermal conductivity, effectively transferring heat [14].
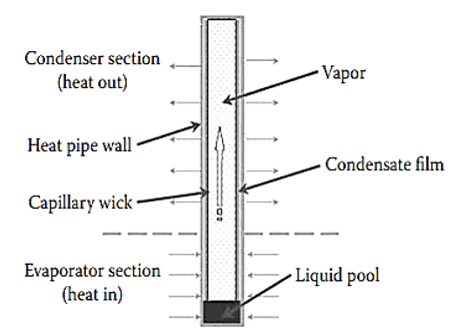
Heat pipes possess a high heat transfer capacity, allowing heat transfer devices equipped with heat pipes to be more compact than conventional devices while efficiently managing high heat fluxes. The working fluid within the heat pipe absorbs heat on the evaporator side, causing the fluid to evaporate. It then moves to the condenser side, where the steam condenses, releasing heat [14]. The heat transfer process is schematically illustrated in Figure 2.
Figure 2. Mechanism of heat transfer in a heat pipe [14]
A heat pipe functions within a two-phase flow system as a heat-transferring evaporation-condensation device, utilizing the latent heat of evaporation to transport heat over relatively long distances with minimal temperature differences. The heat entering the evaporator is transferred to the working fluid through conduction, leading to the evaporation of the working fluid on the surface of the wick structure. Heat pipe wicks come in various structures, commonly mesh, grooved, or powder, often referred to as sintered [14]. The working fluid within the heat pipe can circulate due to capillary forces exerted by the wick structure, enabling the heat pipe to operate effectively in any orientation [15]. Evaporation results in an increase in steam pressure within the evaporator, propelling the steam towards the condenser. Subsequently, as a consequence of the heat released in the condenser, the steam undergoes condensation on the surface of the capillary structure, releasing latent heat [16, 17].
The pressure within the heat pipe plays a crucial role in determining the working temperature, particularly the evaporation temperature [18]. In specific situations, the temperature applied to the heat pipe may not be sufficient to transition the working fluid from liquid to gas, rendering the heat pipe nonfunctional. This can occur when the temperature applied to the heat pipe is below the boiling point of the working fluid. However, with a lower internal pressure in the heat pipe, the working fluid can undergo a phase change even at the same temperature. Consequently, the greater the vacuum (or the lower the pressure) within a heat pipe, the higher its heat transfer capacity [19].
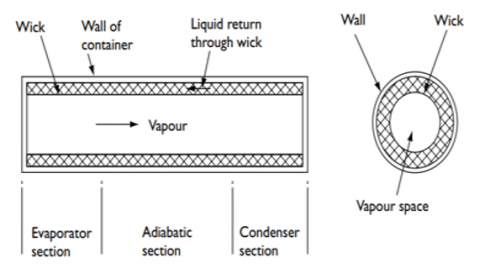
The heat pipe section comprises three sides: the evaporator, adiabatic, and condenser Figure 3 [20]. The adiabatic side needs insulation to prevent heat transfer between the environment and the working fluid in both directions. Common materials used for constructing heat pipe walls include copper, aluminum, and stainless steel [21].
Figure 3. Heat pipe construction [21]
One of the main factors in selecting a working fluid is its stability and compatibility with other materials in the heat pipe system. The initial consideration when identifying a suitable working fluid is the temperature range it operates within. Within a certain temperature range, various types of working fluids are suitable, each with different characteristics that must be studied to determine the most suitable working fluid [22].
The working fluid is the liquid or gas employed for heat transfer. Various working fluids indeed have distinct working temperatures, as illustrated in Table 1 [22].
Table 1. Types of working fluids [22]
|
Working Fluid |
Triple Point (K) |
Critical Point (K) |
Useful Range (K) |
|
Oxygen |
54.3 |
154.8 |
55-154 |
|
Nitrogen |
63.1 |
126.2 |
65-125 |
|
Ethane |
89.9 |
305.5 |
100-305 |
|
Butane |
134.8 |
425.5 |
260-350 |
|
Methanol |
175.2 |
513.2 |
273-503 |
|
Toluene |
178.1 |
593.9 |
275-473 |
|
Acetone |
180.0 |
508.2 |
250-475 |
|
Ammonia |
195.5 |
405.6 |
200-405 |
|
Mercury |
234.3 |
1763 |
280-1070 |
|
Water |
273.2 |
647.3 |
273-643 |
|
Potassium |
336.4 |
2250 |
400-1800 |
|
Sodium |
371.0 |
2500 |
400-1500 |
|
Lithium |
453.7 |
3800 |
500-2100 |
|
Silver |
1234 |
7500 |
1600-2400 |
Important requirements for a working fluid include compatibility with the wick container material, good thermal stability, wettability, high latent heat, high thermal conductivity, low liquid and vapor viscosity, and high surface tension [22, 23].
2.3 Heat absorbed of Air (Q̇air)
For air ducts with a stable flow system and having one inlet and one outlet, the mass flow rate of the incoming air must be the same as the mass flow rate of the outgoing air (ṁin=ṁout=ṁ). If the flowing fluid has a change in temperature, ΔT, and it is assumed that there is no change due to potential and kinetic energy, then the energy balance to determine the rate of heat transfer into or out of the system is shown by the following equation [24]:
$\dot{Q}_{a i r}$=$\dot{m}C_p \Delta T$ (1)
where: Q̇air is heat absorbed of air (Watt), $\dot{m}$ is air mass flow rate (kg/s), Cp is the specific heat of air (kJ/kg.℃) $\Delta T$ is the temperature difference between evaporator side and condensor side (℃).
2.4 Heat pipe performance (Q̇max)
The overall thermal resistance of the heat pipe must be low, so that heat transfer occurs relatively quickly. At low heat input, the thermal resistance of the heat pipe is high because the working fluid is relatively difficult to evaporate on the evaporator side [25]. Conversely, at high heat input, thermal resistance is minimum. The performance of the heat pipe in this study can be measured from the maximum heat transfer that occurs. Theoretically it can be calculated using the following equation [25]:
$\dot{Q}_{a i r}$=$\dot{m}_{\max }L$ (2)
where: $Q_{\max }$ is the maximum heat transfered by heat pipe (Watt), $m_{\text {max }}$ is maximum mass flow rate of refrigerant in the heat pipe $(\mathrm{kg} / \mathrm{s}), L$ is the latent heat of vaporization $(\mathrm{kJ} / \mathrm{kg})$.
The maximum mass flow rate, ṁmax, in the equation above refers to the mass flow of the vapor phase working fluid from the evaporator side to the condenser whose value is influenced by the dimensions of the heat pipe and the properties of the working fluid. Latent heat, L, refers to the properties of the working fluid at the average temperature of the heat pipe [18]. The mass flow rate of the working fluid is also influenced by the force of gravity. Therefore, the influence on flow is determined by the degree of inclination of the heat pipe. When the angle is positive, the force of gravity will provide an effective pressure head on the flow. On the other hand, a negative heat pipe angle can cause the heat pipe to reach the capillarity limit which can cause damage to the heat pipe [26].
The real data center can be seen in Figure 1 above. Cold air originating from the Computer Room Air Conditioner (CRAC) is channeled into the server cabinet as a cooling fluid. The hot air that comes out of the server cabinet is channeled through the return air duct and then cooled again in the CRAC. To reduce the CRAC workload, a heat pipe is placed before the CRAC as an initial coolant.
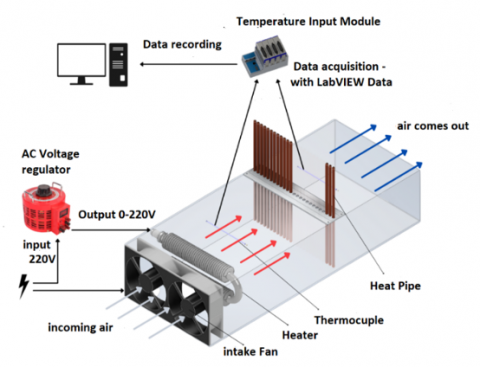
Meanwhile, the simulation testing scheme in this research is shown as in Figure 4. The data server is simulated using a heater (spiral shaped with dimensions Length: 240 mm; Voltage: 220 V AC; Power: 1000 W) whose input voltage can be changed to get the data server output heat which varies. The input voltages given are 25 V, 50 V, 75 V, 100 V, 125 V, 150 V, 175 V, and 200 V. The heat released by the heater will be absorbed by the heat pipe. One heat pipe has a certain ability to absorb heat. To increase the amount of heat absorbed, so need to addition the number of heat pipes. To see the ability of the heat pipe circuit to absorb heat, four variations of the distance between the heat pipes were carried out, namely 3 mm, 4 mm, 5 mm and 6 mm and with three variations of slope the position of the heat pipe, namely: 0°, 15° to the perpendicular of flow direction.
In this test, the inlet air temperature was not varied, around 27℃. The rotational speed of the inlet fan used was not varies and produces an air flow rate of 7 m/s (using an anemometer) through an air duct with dimensions of 600 mm×240 mm×120 mm which is made of carbon steel plate and insulated with Aluminum foil -polyethylene. The air flowing in the return air channel would pass through the heater and then into a series of heat pipes (Wick type: Sintered Powder; dimensions of Length: 250 mm, diameter: 6 mm; material: copper; working fluid: water).
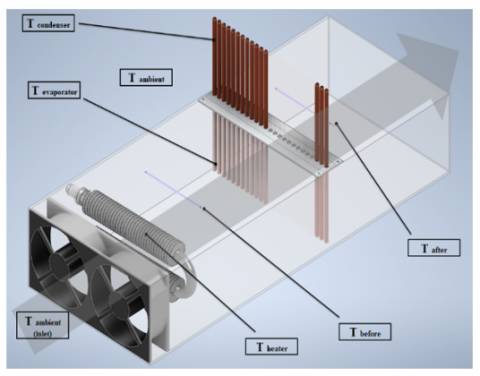
Figure 4. Schematic of testing
Figure 5. Schematic of testing
The data measured are the ambient air temperature (Ta), the air temperature before (Tin) and after passing through the heat pipe (Tout), the temperature of the evaporator side (Te) and the condenser side (Tc) of the heat pipe. The temperature measurement position can be seen in Figure 5. An example of a temperature observation table for each heat pipe slope is shown in Table 1. Temperature data collection was carried out three times (repeating with the same treatment).
Experiment set-up
Electrical components such as fans, voltage regulators and heating elements are connected to a power source. The regulator voltage setting is carried out to obtain variations in air temperature at a time as to simulating of the heat source in the data center. The regulator voltage variations are 25 V, 50 V, 75 V, 100 V, 125 V, 150 V, 175V, and 200 V. Retrieval of testing data was carried out with the help of the LabVIEW software program [27] from the National Instrument device.
In the test, temperature measurements were carried out three times for each condition for 4 hours (240 minutes). As an example, the average results of measurements every 10 minutes of the experiment are shown, for a distance between heat pipes of 3 mm with an inclination angle of 0° and with a heater input voltage of 25Volt (see Table 2). During the experiment there were 96 data sets such as the example.
Four variations of the distance between the heat pipe rods are displayed, namely 3 mm, 4 mm, 5 mm, 6 mm and three variations of the tilt angle of the heat pipe position, namely 0°, 15° and 30°. For each test, eight voltage variations were carried out, starting from 25 V to 200 V.
4.1 Difference in air temperature before and after passing through the heat pipe (ΔTAir)
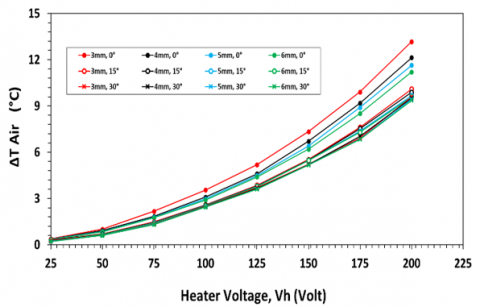
Figure 6 shows the magnitude of the decrease in air temperature after passing through the heat pipe for several heater voltage variations, with variance values ranging from 0.0002/0.0034. The higher the voltage applied, the greater the heating heat, which leads to an increase in air temperature. Air temperature increases to 30℃ to 70℃. It can be seen that the greater the heater voltage applied, the greater the drop in air temperature after passing through the heat pipe. This is because the higher the air temperature that passes through the heat pipe, the higher the evaporation heat that occurs in the heat pipe as a result of the greater the difference between the air temperature and the evaporator temperature. The drop in air temperature can reach 13℃.
Figure 6. Difference in air temperature before and after passing through the heat pipe with eight variations in heater voltage
Table 2. Example of Temperature data measurement results
|
Time (min) |
25 HP (3 mm), 0°, 25 Volt |
||||||
|
T Ambient |
T before HP |
T after HP |
ΔT Air |
T Evap. Avg |
T Cond. Avg |
ΔT HP |
|
|
0 |
27.5310 |
29.7780 |
29.3720 |
0.4060 |
28.9733 |
28.7245 |
0.2487 |
|
10 |
27.1280 |
29.6707 |
29.2892 |
0.3814 |
28.9657 |
28.7132 |
0.2526 |
|
20 |
27.1978 |
29.8510 |
29.4642 |
0.3869 |
29.1526 |
28.8899 |
0.2626 |
|
30 |
27.2469 |
29.8778 |
29.4727 |
0.4050 |
29.1188 |
28.8300 |
0.2888 |
|
40 |
27.3745 |
30.0568 |
29.6746 |
0.3822 |
29.3630 |
29.0749 |
0.2881 |
|
50 |
27.3487 |
30.0731 |
29.7016 |
0.3715 |
29.3951 |
29.0871 |
0.3081 |
|
60 |
27.5125 |
30.1494 |
29.7772 |
0.3722 |
29.4639 |
29.1190 |
0.3449 |
|
70 |
27.5164 |
30.2053 |
29.8355 |
0.3698 |
29.5174 |
29.1518 |
0.3656 |
|
80 |
27.5456 |
30.2498 |
29.8795 |
0.3702 |
29.5631 |
29.1872 |
0.3759 |
|
90 |
27.5944 |
30.2659 |
29.8966 |
0.3693 |
29.5792 |
29.2009 |
0.3784 |
|
100 |
27.5465 |
30.2504 |
29.8801 |
0.3703 |
29.5636 |
29.1874 |
0.3761 |
|
110 |
27.5578 |
30.2787 |
29.9202 |
0.3585 |
29.6273 |
29.2596 |
0.3677 |
|
120 |
27.5982 |
30.2603 |
29.8917 |
0.3687 |
29.5749 |
29.1915 |
0.3835 |
|
130 |
27.4814 |
30.2062 |
29.8377 |
0.3684 |
29.5208 |
29.1528 |
0.3680 |
|
140 |
27.5698 |
30.1891 |
29.8151 |
0.3740 |
29.4860 |
29.1188 |
0.3672 |
|
150 |
27.5017 |
30.1404 |
29.7565 |
0.3839 |
29.4234 |
29.0778 |
0.3456 |
|
160 |
27.4337 |
30.1355 |
29.7559 |
0.3796 |
29.4541 |
29.1634 |
0.2907 |
|
170 |
27.4144 |
30.0731 |
29.6777 |
0.3954 |
29.3579 |
29.0775 |
0.2804 |
|
180 |
26.8656 |
29.6276 |
29.2659 |
0.3618 |
28.9704 |
28.7173 |
0.2531 |
|
190 |
27.3089 |
29.8297 |
29.4193 |
0.4104 |
29.0580 |
28.7658 |
0.2922 |
|
200 |
27.3556 |
29.8339 |
29.4419 |
0.3920 |
29.1138 |
28.8757 |
0.2381 |
|
210 |
27.1286 |
29.6999 |
29.3082 |
0.3917 |
28.9742 |
28.7011 |
0.2732 |
|
220 |
26.9449 |
29.6845 |
29.3191 |
0.3654 |
29.0213 |
28.7657 |
0.2556 |
|
230 |
27.3997 |
30.0539 |
29.6561 |
0.3979 |
29.3341 |
29.0548 |
0.2792 |
|
240 |
27.5015 |
30.1753 |
29.7840 |
0.3913 |
29.4656 |
29.1674 |
0.2982 |
It can also be seen from Figure 6 that the closer the heat pipes are, the greater the difference in air temperature that occurs. This is clearly visible at a heat pipe tilt of 0°, while showing that the upright position (0° tilt) has the greatest impact on air temperature. The difference between a slope of 0° and 15° is still quite significant, but the difference between 15° and 30° doesn't seem significant anymore.
4.2 Temperature difference between the evaporator side and the condenser side of the heat pipe (ΔThp)
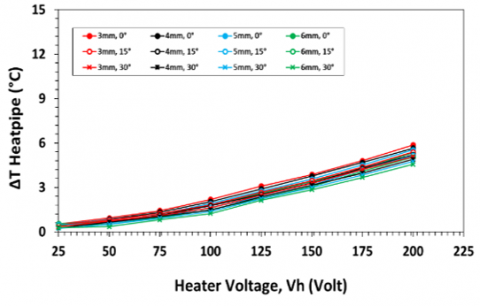
Figure 7 shows the temperature difference in the heat pipe (ΔThp), namely the temperature difference on the evaporator side (Tev) and the temperature on the condenser side (Tcd). with variance values ranging between 0.0025÷0.0322. The characteristics shown are identical to the characteristics in Figure 6, although the temperature difference is relatively small so it is relatively difficult to see the difference between one variation and another. Variations in the heat pipe circuit with a density of 3 mm and a slope of 0° produce the largest ΔThp compared to other series variations.
Figure 7. Difference in heat pipe temperature on the evaporator side and condensor side at several heater voltage variations
4.3 Heat absorbed from the air
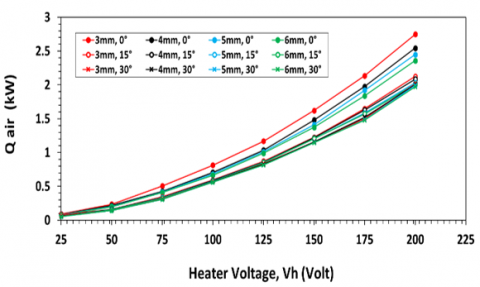
Figure 8 shows the air heat absorbed by the heat pipe, with variance values ranging between 0.0001÷0.0019. It appears that the performance of the heat pipe is strongly influenced by the density distance. This is because the density distance between heat pipes will directly increase the number of heat pipes used. The smaller the density distance between heat pipes, the more heat pipes that can be used. The greater the number of heat pipes, the greater the contact surface area between the air and the heat pipe device, so that more heat can be transferred. A series of heat pipes with a density of 3 mm is the best variation capable of transferring air heat at a rate of up to 2.749 kW.
Figure 8. Heat absorbed from air (Q̇air) at various heat load variations
From the Figure 8 above, it is also known that the variation of the heat pipe series with a slope of 0° is able to transfer heat from the air to a greater extent than the other variations. At a slope of 0°, the condensed working fluid can return to the evaporator side through the wick structure more easily due to the assistance of better gravitational force. Furthermore, for heat loads with a 25 V heater, there is no visible difference between one slope and another. However, in the heat load of the heater with the highest voltage, namely 200 V, the difference between each slope variation can be clearly seen, especially between a slope of 0° and 15°. Meanwhile, the difference between 15° and 30° no longer seems significant.
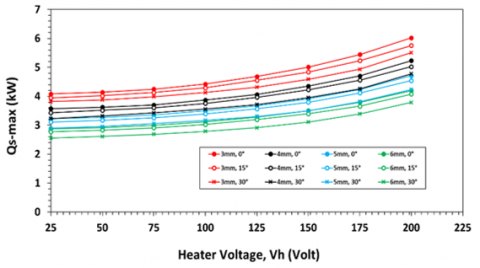
Figure 9. Maximum heat transfer per circuit (Q̇s-max) at various heat load variations
Theoretically, the maximum heat transfer transferred by a heat pipe can be calculated using Eq. (2) above. Figure 9 shows the total Q̇max value based on the number of heat pipes used in various variations (with variance values ranging between 0.17÷0.48). This is because variations in density between heat pipes will directly affect the number of heat pipes that can be used in the system. The channel under study has dimensions of 240 mm in width. Therefore, the closer the distance between the heat pipes, the more heat pipes that can be used in the 240 mm width. Conversely, the greater the distance between heat pipes, the fewer heat pipes that can be used. At densities of 3 mm, 4 mm, 5 mm, and 6 mm, they can contain 25, 22, 20, and 18 heat pipes respectively. So, of course the largest Q̇max is shown by the circuit that uses the most heat pipes, namely with a density variation of 3mm. For comparison, the increasing in heat absorption by space between heat pipe rods from f 4 mm (22 rods) to 3 mm (25 rods) is 2.545 kW to 2.749 kW (7.8% increase).
In terms of price, with the heat pipe procurement cost being US$4.24 per rod, the increase in procurement costs from a density of 4 mm (22 rods) is US\$93.28 to US\$106 for a density of 3 mm (25 rods) or an increase in costs of 13.63%.
In this variation, theoretically the heat pipe circuit has a maximum heat transfer capacity of up to 5.942 kW. Nevertheless, we know from the previous graph that in this variation, the heat from the air that can be absorbed is 2.749 kW. This value is of course a concern, especially in terms of efficiency, both in terms of performance and cost factors due to differences in the number of heat pipes used. For the case of a density distance of 3 mm with a slope of 0° at a voltage of 200 Volts, the ratio of heat absorbed by the air (Qud) to Qmax is 0.47. This value shows that the effectiveness of the heat pipe under these conditions is 47%.
Based on the results of research and data processing to determine the potential for using heat pipes as heat exchangers in data center simulations as has been done, it can be concluded:
The slope of the heat pipe affects the performance in heat absorption. The best position for the heat pipe is parallel to the direction of gravity or tilted at 0° to the vertical direction. For spacing between heat pipe rods of 3 mm, a slope of 0° can absorb air heat of 2,749 W and for a slope of 15° it is 2,125 W and at a slope of 30° it is 2,017 W. If this is not possible, can be using a heat pipe with a maximum slope of 15° condition. The distance between heat pipes also affects the heat absorption capacity. At 0° inclination for spacing between heat pipe rods of 3 mm; 4 mm; 5 mm and 6 mm absorb heat respectively 2,749 kW; 2,545 kW; 2,448 kW and 2,358 kW. Q̇max of the largest series of heat pipes at space between heat pipe rods 3 mm where the heat from the air absorbed is 5,942 kW while space between heat pipe rod of 4 mm; 5 mm and 6 mm respectively at 5,141 kW; 4,654 kW and 4,196 kW. It seems that at 3 mm the heat pipe works at 47% of its theoretical capability.
If reviewed at the heat released by the heater of 10kW, the amount of heat that can be transferred by the heater is 2,749 kW, which is a significant improvement for the data center cooling process.
In this study, the supply air temperature was not varied. In the future, the simulation system needs to be equipped with an air conditioner (AC) so that it can also be known how much the compressor work decreases due to the use of heat pipes.
The author would like to thank the Chancellor of Hasanuddin University who has funded this research through the Unhas Collaborative Fundamental Research scheme.
|
Cp |
the specific heat of air, kJ/kg |
|
L |
latent heat of vaporization, kJ/kg |
|
$\dot{m}$ |
Mass flow rate of air, kg/s |
|
$\dot{m}_{\max }$ |
Max. mass flow rate of refrigerant in the heat pipe, kg/s |
|
Q̇air |
Heat Absorbed from air, W |
|
Q̇max |
Max. Heat Transfer of heat pipe, W |
|
Q̇S-max |
Max. Heat Transfer per circuit of heat pipe, W |
|
ΔTair |
Temperature difference, ℃ |
|
ΔThp |
Temperature difference in the heatpipe, ℃ |
|
Ta |
Ambient temperature, ℃ |
|
Tin |
Air temperatur before heat pipe, ℃ |
|
Tout |
Air temperatur after heat pipe, ℃ |
|
Tout |
Air temperatur after heat pipe, ℃ |
|
Tevap |
Temperatur of the evaporator side, ℃ |
|
Tcond |
Temperatur of the condenser side, ℃ |
|
ΔThp |
Temperature difference in the heatpipe, ℃ |
|
Subscripts |
|
|
ASHRAE |
American Society of Heating, Refrigerating and Air-Conditioning Engineers |
|
COP |
Coefficient of Performance |
|
CRAC |
Computer Room Air Contidioner |
|
HVAC |
Heating, Ventilation and Air-Conditioning |
|
IoT |
Internet of Things |
|
PUE |
Power Usage Effectiveness |
|
RA |
Return Air |
|
SA |
Supply Air |
[1] Masanet, S., Smith, L. (2018). Global data center energy use: Distribution, composition, and near-term outlook. Northwestern University: Evanston, IL, USA.
[2] Ebrahimi, K., Jones, G.F., Fleischer, A.S. (2014). A review of data center cooling technology, operating conditions and the low-grade waste heat recovery opportunities. Renewable and Sustainable Energy Reviews, 31: 622-638. https://doi.org/10.1016/j.rser.2013.12.007
[3] Zhang, X., Lindberg, T., Xiong, N., Vyatkin, V., Mousavi, A. (2017). Cooling energy consumption investigation of data center IT room with vertical placed server. Energy Procedia, 105: 2047-2052. https://doi.org/10.1016/j.egypro.2017.03.581
[4] Dong, K., Li, P., Huang, Z., Su, L., Sun, Q. (2017). Research on free cooling of data centers by using indirect cooling of open cooling tower. Procedia Engineering, 205: 2831-2838. https://doi.org/10.1016/j.proeng.2017.09.902
[5] Zhang, Y., Wei, Z., Zhang, M. (2017). Free cooling technologies for data centers: Energy saving mechanism and applications. Energy Procedia, 143: 410-415. https://doi.org/10.1016/j.egypro.2017.12.703
[6] Djafar, Z., Putra, N., Koestoer, R.A. (2013). The utilization of heat pipe on cold surface of thermoelectric with low-temperature waste heat. Applied Mechanics and Materials, 302: 410-415. https://doi.org/10.4028/www.scientific.net/amm.302.410
[7] Capozzoli, A., Primiceri, G. (2015). Cooling systems in data centers; state of art and emerging technologies. Energy Procedia, 83: 484-493. https://doi.org/10.1016/j.egypro.2015.12.168
[8] Niemann, J., Brown, K., Avelar, V. (2011). Hot-aisle vs. cold-aisle containment for data centers, APC White Paper 135, rev02. Schneider Electric.
[9] Gunawan, Y., Margono, K.T., Rizky, R., Putra, N., Faqih, R.A., Hakim, I.A., Setiadanu, G.T., Suntoro, D., Kasbi, S., Nafis, S. (2021). Enhancing the performance of conventional coffee beans drying with low-temperature geothermal energy by applying HPHE: An experimental study. Open Agriculture, 6(1): 807-818. https://doi.org/10.1515/opag-2021-0053
[10] Hakim, I.I., Sukarno, R., Putra, N. (2021). Utilization of U-shaped finned heat pipe heat exchanger in energy-efficient HVAC systems. Thermal Science and Engineering Progress, 25: 100984. https://doi.org/10.1016/j.tsep.2021.100984
[11] Nuriyadi, M., Putra, N., Alhamid, M.I., Lubis, A. (2023). Performance Enhancement of Electric Bus Air Conditioning System by Heat Pipe Equipment (Experimental Study). https://doi.org/10.5109/6781074
[12] Michael, J., Aparna, S., Stefan, A. (2015). The greening of data centers with cloud technology. International Journal of Cloud Applications and Computing, 5(4): 1-23. https://doi.org/10.4018/IJCAC.2015100101
[13] Carroll, A. (n.d.). How the Heat Generated by data center can be Recycled. Lifeline Data Centers. Retrieved January 2022, from https://lifelinedatacenters.com.
[14] Meseguer, J., Pérez-Grande, I., Sanz-Andrés, A. (2012). Spacecraft thermal control. Woodhead Publishing Limited. https://doi.org/10.1016/B978-1-84569-996-3.50023-X
[15] Asjad, M.I., Zahid, M., Ali, B., Jarad, F. (2022). Unsteady MHD Williamson fluid flow with the effect of bioconvection over permeable stretching sheet. Mathematical Problems in Engineering, 2022: 1-10. https://doi.org/10.1155/2022/7980267
[16] Zohuri, B. (2011). Heat Pipe Design and Technology: A Practical Approach. Taylor & Francis Group, CRC Press.
[17] Hagens, H., Ganzevles, F.L.A., Van der Geld, C.W.M., Grooten, M.H.M. (2007). Air heat exchangers with long heat pipes: Experiments and predictions. Applied Thermal Engineering, 27(14-15): 2426-2434. https://doi.org/10.1016/j.applthermaleng.2007.03.004
[18] Cen, J., Li, F., Li, T., Huang, W., Chen, J., Jiang, F. (2021). Experimental study of the heat-transfer performance of an extra-long gravity-assisted heat pipe aiming at geothermal heat exploitation. Sustainability, 13(22): 12481. https://doi.org/10.3390/su132212481
[19] Lin, W.K., Chao, C.I., Tzou, Y.M., Hsu, G.H., Chou, S.M. (2011). Effect of the Vacuum Pressure and the Working Fluid Inventory to the Maximum Heat Loading (Qmax) of the Heat Pipe, Taiwan.
[20] Reay, D., McGlen, R., Kew, P. (2013). Heat pipes: Theory, Design and Applications. Butterworth-Heinemann.
[21] Lin, Z., Wang, S., Shirakashi, R., Winston, Z.L. (2013). Simulation of a miniature oscillating heat pipe in bottom heating mode using CFD with unsteady modelling. International Journal of Heat and Mass Transfer, 57(2): 642-656. https://doi.org/10.1016/j.ijheatmasstransfer.2012.09.007
[22] Lips, S., Lefevre, F. (2014). A general analytical model for the design of conventional heat pipes. International Journal of Heat and Mass Transfer, 72: 288-298. https://doi.org/10.1016/j.ijheatmasstransfer.2013.12.068
[23] Swanson, L.W. (1999). Heat and Mass Transfer. In F. Kreith (Ed.), Mechanical Engineering Handbook. CRC Press LLC.
[24] Cengel, Y.A. (2002). Heat Transfer: A Practical Approach (2nd ed.). McGraw-Hill.
[25] Senthilkumar, R., Vaidyanathan, S., Sivaraman, B. (2012). Effect of inclination angle in heat pipe performance using copper nanofluid. Procedia Engineering, 38: 3715-3721. https://doi.org/10.1016/j.proeng.2012.06.427
[26] Guo, Y., Su, Z., Li, Z., Wang, K., Liu, X. (2022). An improved model of the heat pipe based on the network method applied on a heat pipe cooled reactor. Frontiers in Energy Research, 10: 848799. https://doi.org/10.3389/fenrg.2022.848799
[27] Djafar, Z., Salsabila, A.Z., Piarah, W.H. (2021). Performance comparison between hot mirror and cold mirror as a beam splitter on photovoltaic-thermoelectric generator hybrid using LabVIEW simulator. International Journal of Heat and Technology, 39(5): 1609-1617. https://doi.org/10.18280/ijht.390524