Mai Bani Younes![]() | Yousef Altork*
| Yousef Altork*![]() | Nabeel Abu Shaban
| Nabeel Abu Shaban![]()
© 2024 The authors. This article is published by IIETA and is licensed under the CC BY 4.0 license (http://creativecommons.org/licenses/by/4.0/).
OPEN ACCESS
In areas with unreliable electricity, the absorption system serves as a crucial, eco-friendly refrigeration technology. This study addresses the system's performance gaps, evaluating the 100 W NH3-H2O absorption cooling system under various conditions. The focus is on its suitability for electricity-challenged areas, employing theoretical and experimental methods. Two configurations are tested based on input heat sources, using bifacial Photovoltaic (PV) or solar parabolic troughs integrated with the absorption chiller. The Engineering Equation Solver (EES) program determines thermodynamic properties, with the model split into sections—one with the solution heat exchanger (SHX) excluding the liquid-vapor heat exchanger (LVHX) and the other incorporating both. The findings indicate a direct correlation between higher evaporator and generator temperatures and an increase in the Coefficient of Performance (COP). The theoretical and experimental cooling COP values reach 0.62 and 0.63, respectively, at 7℃ evaporator temperature and 85℃ generator temperature. Similarly, at 95℃ generator temperature, the COP values are 0.629 and 0.637 for the same evaporator temperature. The theoretical maximum COP at 3℃ evaporator temperature is 0.512 at 90°C generator temperature, with experimental COP approaching 0.52 at generator temperatures of 96℃, 98℃, and 100℃. The integration of an LVHX into the chiller module demonstrates a notable improvement in cycle performance, enhancing efficiency by approximately 7-7.5%. In conclusion, this study offers crucial insights into optimizing the NH3-H2O absorption cooling system for off-grid scenarios, contributing to a broader understanding of absorption refrigeration technology in diverse environmental conditions.
absorption cooling, solar cooling, experimental absorption cooling, EES, ammonia-water absorption chiller, renewable energy, thermal comfort, numerical modeling
1.1 Background
All around the world, the demand for cooling solutions has grown recently. High-income countries like the United States, where approximately 90% of homes already have air conditioning, are not the ones driving the growth [1]. Middle-income countries are the biggest contributors to the rise, where households and companies are buying cooling equipment (mostly air conditioners) at startlingly high rates [2]. The best example is China, where sales of air conditioners have almost doubled over the last five years. More than eight times as many gadgets were sold globally in 2013—64 million—as in the US [2]. The potential for increased air-cooling demand is enormous. For instance, India has more than three times as many cooling degree days per person and four times the population of the US [3].
Refrigeration technology will be beneficial to more than 3 billion people living in tropical and subtropical areas. On the other hand, it will be difficult to meet the rising demand for electricity [4, 5]. This growth in air conditioning will produce billions of tons of carbon dioxide emissions because the majority of the world's electricity production still originates from non-renewable energy sources as in Figure 1 [6-8]. Figure 1 further demonstrates that by 2050, a sizable part of power generation will still come from non-renewable sources.
Figure 1. Current and expected global electricity generation through 2050 [6]
Fluorinated gases (F-gases) are created by compression chillers, which are frequently employed to meet cooling needs [7, 8]. The impact of these F-gases, which include hydro-chlorofluorocarbon (HCFC) and hydrofluorocarbon (HFC), on global warming is thousands of times greater than that of carbon dioxide. HFC emissions have increased during the past 20 years and now account for 2% of all GHG emissions [9, 10].
The production of energy and industrial applications both produce enormous amounts of heat, as is well known [11-13]. The majority of this heat loss is high energy. In order to reduce the consumption of high-carbon fuel, extensive research has been done on reuse, recycling, and waste heat integration. Utilizing such waste heat fluxes to produce cold utilizing Vapor Absorption Chillers (VACs) is one of the best uses for them. The VAC is currently among the most popular options for cold production since it not only offers the chance to utilize such waste heat flows but also a number of additional advantages like the connection to district heating and the integration of renewable energy sources, for example [14]. Traditional energy sources, such as combined heat and power (CHP) plants, have historically served as the primary heat source for VACs in large cold supply systems, such as District Cooling Systems (DCSs) [15]. However, in recent years, focus has switched to more effectively combining VACs with renewable energy sources, including solar PV and thermal, biomass fuels, geothermal heat pumps and wells, and wind energy [16]. These investments in renewable energy will result in considerable returns on a steady supply of profitable energy [17, 18].
1.2 Literature review
The absorption process can involve a phase change or chemical reaction, where the sorbate diffuses into the liquid or solid sorbent [19]. Common absorption materials include aqueous solutions of calcium chloride (CaCl2), lithium chloride (LiCl), lithium bromide (LiBr), sodium hydroxide (NaOH), potassium hydroxide (KOH), and ammonia [20]. Energy, referred to as driven energy, is required for the regeneration process in absorption systems. Previous studies have used industrial waste energy [21, 22], automotive exhaust [23], and solar energy [24, 25] to power absorption systems. Researchers have also studied combining vapor compression systems with cascading absorption systems to improve performance [26].
In a study by Kadam et al. [27], seven vapor compression refrigeration cycle configurations are compared to a double-effect vapour absorption refrigeration cycle that uses either the standard ammonia/water working fluid or the new acetaldehyde-N, N-dimethylformamide working fluid. With ammonia/water or acetaldehyde-N, N-dimethylformamide in the vapour absorption refrigeration, these three cycles are contrasted with the cascade and parallel vapor compression-absorption system topologies. In cascade designs, the vapor compression refrigeration unit's coefficient of performance is 252% higher than it is in stand-alone setups. Acetaldehyde-N, N-dimethylformamide, a new fluid, has a stand-alone vapor absorption refrigeration coefficient of performance that is 9.1% better than that of ammonia/water. In comparison to a stand-alone vapor compression refrigeration system, the cascade vapor compression-absorption refrigeration system using acetaldehyde-N, N-dimethylformamide has a 65% lower cost per ton of cooling and a 67.8% lower overall equivalent warming potential. In the cascade configuration, the acetaldehyde-N, N-dimethylformamide fluid's electrical energy utilization factor is 30.5% lower than that of ammonia/water.
The effectiveness of a solar/gas assisted absorption chiller that uses NH3/LiNO3 to cool malls is evaluated in relation to local environmental factors in the Colombian city of Barranquilla by Amaris et al. [28]. A 352 kW nominal capacity NH3/LiNO3 absorption chiller's performance is evaluated while the system is powered by solar energy and natural gas. The analysis also took into account the city's sun irradiation, the cooling needs of three particular malls, and the amount of roof space available for evacuated solar collectors. The operation of the absorption system to create cooled water at 12℃ is estimated using a thermodynamic model that is developed for the chiller's evaluation. The absorption chillers' cooling aim is based on the expected cooling impact delivered by traditional compression chillers. The findings indicated that the biggest barrier to installing solar/gas absorption systems in malls is the space available for solar collectors. Taking into account two solar/gas assisted chillers and a solar collector area of 2210 m2, the peak cooling effect aim was completely met in mall two. Due to space restrictions for solar collectors, mall one's two chillers were able to produce 83% of the peak cooling demand, whereas mall three's single chiller could only handle 35% of the peak cooling load. The chillers' maximum Coefficient of Performance (COP) and Seasonal Coefficient of Performance (SCOP) values were 0.64 and 0.41, respectively.
The research paper [29] introduced a new advanced absorption cycle for multiple product production in rural communities. The system utilized renewable energy source heat and is an ammonia-water absorption cycle with parallel evaporators for cooling and power generation. The cycle has two absorbers to increase the net power output by reducing pumping power or increasing pressure ratio. The rejected heat can be used for fresh water production, drying or hot water. The study analyzed the impact of medium pressure absorber temperature, generator temperature, condenser temperature and refrigerant flow on cooling and power sub cycle. It was found that the system has a maximum resource utilization efficiency of 22.46% and exergy efficiency of 12.26% at a typical operating condition with a generator temperature of 230℃.
1.3 Novelty and objectives
In this study, the theoretical and experimental performance of a 100 W NH3-H2O absorption cooling system is analyzed and compared over a range of operating conditions. The thermodynamic properties of the NH3-H2O absorption cooling system were determined using the Engineering Equation Solver (EES) tool. The mathematical model is separated into two sections: the first includes solution heat exchanger (SHX) but without liquid-vapor heat exchanger (LVHX), and the second includes both SHX and LVHX as part of the cycle. In addition, it is determined how much the temperatures of the evaporator and the generator, as well as the solution heat exchanger and the liquid vapor heat exchanger, have an effect on the overall performance of the system. Overall, the study's novelty lies in its multifaceted approach, encompassing theoretical modeling, experimental validation, and practical considerations, which collectively advance the knowledge and potential applications of the NH3-H2O absorption cooling system, particularly in off-grid or electricity-challenged scenarios.
2.1 Absorption system and principle of operation
The used absorption system in this research (XK-XSZL1) is manufactured by Shandong Xingke Intelligent Technology Co.Ltd as shown in Figure 2(a) and installed in Al-Zaytoonah University of Jordan. An absorption cooling system trainer (XK-XSZL1) is a training tool or apparatus used to teach and demonstrate the principles and functioning of an absorption cooling system. It is typically used in educational or research settings to help students and researchers understand how absorption cooling works and how it can be used in various applications. The system operates on AC220V ±10% 50Hz power with a device capacity of 100 W. Its dimensions are 670 mm 570 mm 520 mm, and it uses ammonia solution as the working medium. The working environment temperature is specified as 16-32℃. The system comprises essential components such as the generator, separator, condenser, evaporator, absorber, and liquid storage tank. The generator, for instance, adopts a casing structure with three tubes for heating ammonia solution. The training manual provides detailed insights into each component's structure and function, temperature measurement instructions, and working processes. The evaluation of this absorption system holds substantial practical significance for rural areas and refugee camps grappling with electricity challenges. This environmentally friendly and low-maintenance refrigeration technology offers a crucial solution for off-grid regions, providing sustainable cooling solutions for food preservation, medical storage, and improved living conditions. Its small-scale capacity aligns with the specific needs of local communities, reducing reliance on conventional power grids and fostering technology transfer. Ultimately, the system's deployment has the potential to significantly enhance the quality of life in these challenging environments by addressing critical energy and infrastructure limitations.
(a) (b)
Figure 2. (a) XK-XSZL1 absorption cooling system. (b) XK-XSZL1 system main components including: 1. Generator 2. Separator 3. Condenser 4. Evaporator 5. Absorber 6. Liquid storage tank
An absorption cooling system typically includes several key components, which work together to transfer heat from one location to another and produce a cooling effect. The main components of an absorption cooling system include as in Figure 2(b):
System A: Bifacial PV with absorption chiller
A coupled bifacial photovoltaic (PV) system with a single-stage ammonia-water absorption cooling system refers to a combined energy system that uses both solar energy and an absorption cooling system to provide cooling. The bifacial PV system refers to a type of solar panel that can capture light from both the front and back sides. This increases the overall energy efficiency of the system by capturing more light. The single-stage ammonia-water absorption cooling system is a type of refrigeration system that uses an ammonia-water mixture as the refrigerant. The system works by absorbing heat in the evaporator and releasing it in the condenser. The ammonia-water mixture is circulated through the system and is driven by the heat produced by the PV panels.
Figure 3. Coupled bifacial PV with XK-XSZL1 absorption cooling system (System A)
In the coupled system, the bifacial PV panels are used to generate electricity and also provide the heat energy needed to drive the absorption cooling system as shown in Figure 3. The energy from the PV panels is used to heat the ammonia-water mixture, which in turn provides cooling. This reduces the energy demand from conventional cooling systems and can lead to increased energy efficiency and lower operating costs. The combined system provides both cooling and electricity, making it a highly efficient and cost-effective solution for buildings and industrial applications.
System B: Solar parabolic trough with absorption chiller
The principle of operation of a coupled solar thermal parabolic trough with an absorption cooling system is based on the use of solar energy to drive the absorption cooling process. The system combines a solar parabolic trough, which collects and concentrates solar energy, and an absorption cooling system, which uses the solar energy to provide cooling as shown in Figure 4. The operation of the system can be divided into the following main stages:
Figure 4. Solar parabolic trough with XK-XSZL1 absorption cooling system (System B)
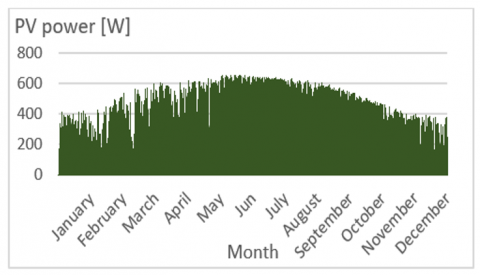
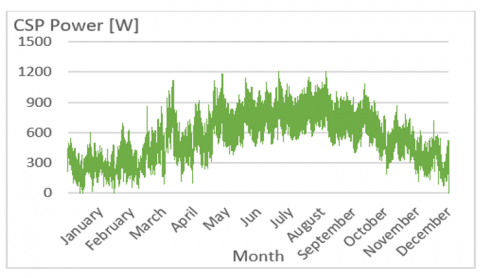
The monthly power output of bifacial PV and Solar parabolic trough is depicted in Figures 5 and 6, and it can be seen that both systems A and B are capable of providing an adequate quantity of thermal energy for the generator throughout the entire year, considering the environmental conditions of Jordan.
The experimental methods employed in evaluating the 100 W NH3-H2O absorption cooling system entail certain limitations and assumptions. Idealized conditions, such as neglecting irreversibility, heat losses, and non-ideal behaviors, may affect the accuracy of results compared to real-world scenarios. The assumption of steady-state conditions could limit the understanding of transient behaviors and dynamic operating conditions. Constant material properties, uniform temperature distributions within components, and limited operating conditions might deviate from practical scenarios. Additionally, the idealization of heat exchanger effectiveness, potential variations in material properties, and overlooking control system dynamics could further influence the interpretation and generalization of experimental findings.
Figure 5. Monthly bifacial PV power generation
Figure 6. Monthly solar parabolic trough power generation
2.2 Measuring devices
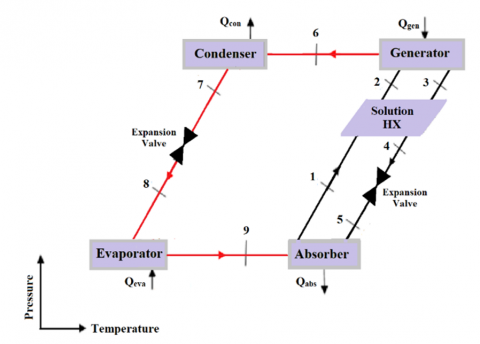
To determine the system's COP and cooling capacity experimentally, it is essential to measure two primary parameters: fluid temperature and flow rate. The fluid temperature readings help to calculate the enthalpy at points 1-9, as shown in Figure 7. Additionally, the flow rate is crucial in determining the mass flow rate by considering the solution's concentration and density. Nine k-type thermocouples, having a measuring accuracy of ±0.75%, are placed at points 1-9 to measure the fluid temperature. The type K is the most common type of thermocouple. It’s inexpensive, accurate, reliable, and has a wide temperature range. The type K is commonly found in nuclear applications because of its relative radiation hardness. The temperature range is between -270 to 1260°C. These thermocouples are connected to a data-logger, which ensures real-time measurements. On the other hand, an ultrasonic flow meter, TUF-2000H with these specifications: high accuracy of ±1%, wide measuring ranges several types transducer for selection, pipe size from DN32mm to DN6000mm, large capacity battery built-in rechargeable Ni-MH battery, provide over 12 hours of continuous operation, and non-intrusive measuring non-intrusive, clamp-on transducer, no pressure drop, no pipe disturbance, is employed to measure the fluid's flow rate. The uncertainty associated with both these devices is utilized to calculate the overall uncertainties in the COP and cooling capacity measurements.
Figure 7. Schematic diagram of the single effect NH3H2O absorption cooling system
Thermocouples are strategically placed at key locations, including the evaporator, generator, SHX, and LVHX, to monitor temperature variations during absorption and desorption processes. Additionally, thermocouples at inlet and outlet points provide crucial data for calculating system efficiency. Flow meters are strategically positioned in the refrigerant and solution circuits to measure NH3-H2O mixture and absorbent solution flow rates, ensuring a comprehensive understanding of mass flow balance and facilitating accurate system performance analysis. The rationale behind this placement strategy lies in obtaining precise data at critical points, and enabling effective monitoring of the refrigeration system.
In the experimental evaluation of the absorption system, data acquisition involved strategically placing K-type thermocouples at critical points, such as the evaporator and generator, and utilizing the ultrasonic flow meter TUF-2000H to measure flow rates. Experiments were conducted under diverse operating conditions, varying parameters like evaporator and generator temperatures. Post-processing procedures included data validation, correlation analysis to understand variable relationships, calculation of performance metrics like the COP, comparative analysis between theoretical predictions and experimental results, visualization through graphical representations, sensitivity analysis to evaluate parameter impact. The comprehensive information documented the entire process, experimental setup details, data acquisition methods, and key conclusions drawn from the post-processing analysis, providing valuable insights into the performance and potential enhancements of the absorption system.
2.3 Uncertainty analysis
Uncertainty analysis for experimental measurement data involves determining the level of confidence in the measurement results. The goal is to provide a quantifiable estimate of the uncertainty in the measurement and to communicate this information to others who may use or rely on the results. The systematic uncertainties in the experimental results are affected by the precision of the measuring sensors. The calibration report for the measurement devices was provided by the manufacturers and includes information on the measuring ranges and the uncertainty levels for each sensor.
Consider the generic scenario where an experimental result, r, is a function of j measured variables, Xi [30]:
$r=f\left(X_1, X_2, \ldots, X_j\right)$ (1)
where, Eq. (1) is the data reduction equation used for determining r from the measured values of the variables Xi. Then the uncertainty in the result is given by:
$\begin{aligned} U_r^2=\left(\frac{\partial r}{\partial X_1}\right)^2 U_{X_1}^2 & +\left(\frac{\partial r}{\partial X_2}\right)^2 U_{X_2}^2+\cdots+\left(\frac{\partial r}{\partial X_j}\right)^2 U_{X_j}^2\end{aligned}$ (2)
where, UXi are the uncertainties in the measured variables Xi.
A systematic error analysis based on these correlations showed that the overall uncertainty was ±5.61% for the COP and ±6.93% for the cooling capacity.
3.1 Absorption Chiller with SHX
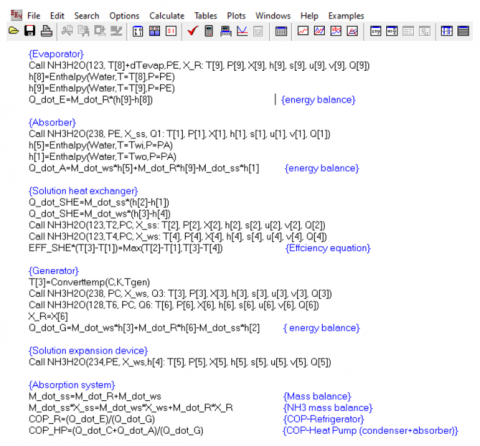
The detailed model is constructed based on the mass and energy balance to examine the functionality of the integrated system. The EES program was used to create the model as in figure A1 in the appendix. The NH3-H2O solution is one of the many functions available in this software's library of features.
A number of presumptions and simplifications are frequently used when creating a thermodynamic model for absorption chiller. Concentration calculations are made easier by the absorber and generator's assumption of chemical equilibrium. In order to simplify heat transfer equations, one-dimensional heat transmission is frequently considered within components. For fluids in components, perfect mixing is assumed, resulting in uniform distributions of concentration and temperature. The application of constant heat capacities for absorbent and refrigerant simplifies calculations related to energy balance. Heat exchanger effectiveness is taken for granted, and mechanical work input is disregarded. Ideal pump behaviour is frequently assumed, and no phase change is taken into account in the absorber and evaporator. These assumptions are made based on the goals of the analysis and the requirement to strike a balance between computational efficiency and model complexity.
Figure 7 shows a simplified diagram of a single-stage absorption cooling system. An absorber, condenser, generator, evaporator, expansion valves and SHX comprise the majority of the system.
As part of the simulation of the single-stage absorption cooling cycle, the following steady-state mass and energy balance equations are developed for each part:
In Eq. (3), $\dot{m}$ represents the mass flow rate, in and out represent the inlet and outlet values, respectively.
$\sum \dot{m}_{\text {in }}=\sum \dot{m}_{\text {out }}$ (3)
A general expression for the energy balance is given by Eq. (4):
$\dot{Q}+\sum \dot{m}_{\text {in }} * h_{\text {in }}=\dot{W}+\sum \dot{m}_{\text {out }} * h_{\text {out }}$ (4)
where:
$\dot{Q}$: is the overall amount of input heat
$\dot{W}$: is the overall amount of output work
$h_{in}$: is the inlet enthalpy
$h_{out}$: is the exit enthalpy
$\dot{Q}=\dot{Q}_{\text {in }}-\dot{Q}_{\text {out }}$ (5)
$\dot{W}=\dot{W}_{\text {in }}-\dot{W}_{\text {out }}$ (6)
At the absorber, the mass and energy balance are represented by the following equations:
$\dot{m}_{ss}=\dot{m}_{ws}+\dot{m}_r$ (7)
$\dot{m}_{ws}=\lambda \dot{m}_r$ (8)
$\dot{m}_{ss}=(1+\lambda) \dot{m}_r$ (9)
$\dot{m}_r+\left(1-X_{ws}\right) * \dot{m}_{ws}=\left(1-X_{ss}\right) \dot{m}_{ss}$ (10)
$\lambda=\frac{X_{ss}}{X_{ws}-X_{ss}}$ (11)
$\dot{Q}_{a b s}=\dot{m}_r \quad\left[\left(h_9-h_1\right)+\lambda\left(h_5-h_1\right)\right]$ (12)
where, SS: is the strong solution, WS: is the weak solution, r: is the refrigerant, $\lambda$: is the circulation ratio and X: is the solution concentration. The following equations illustrate the energy balance of the condenser, evaporator and generator:
$\dot{m}_6=\dot{m}_7=\dot{m}_r$ (13)
$\dot{Q}_{c o n}=\dot{m}_r *\left(h_6-h_7\right)$ (14)
$\dot{m}_9=\dot{m}_8=\dot{m}_r$ (15)
$\dot{Q}_{\text {eva }}=\dot{m}_r *\left(h_9-h_8\right)$ (16)
$\dot{m}_2=\dot{m}_6+\dot{m}_3$ (17)
$\dot{m}_{\mathrm{ss}} * X_{\mathrm{ss}}=\left(\dot{m}_{w s} * X_{w s}+\dot{m}_r * X_r\right)$ (18)
$\dot{Q}_{g e n}=\dot{m}_r \quad\left[\left(h_6-h_3\right)-\lambda\left(h_2-h_3\right)\right]$ (19)
The following equations can be applied to describe the energy balance and effectiveness of the solution and refrigerant expansion valves:
$\dot{m}_4=\dot{m}_5=\dot{m}_{ws}$ (20)
$h_4=h_5$ (21)
$\dot{m}_7=\dot{m}_8=\dot{m}_r$ (22)
$h_7=h_8$ (23)
The following equations can be applied to describe the mass balance, energy balance and effectiveness of the solution heat exchanger:
$\dot{m}_2=\dot{m}_1=\dot{m}_{ss}$ (24)
$\dot{m}_3=\dot{m}_4=\dot{m}_{ws}$ (25)
$\dot{Q}_{S H X}=\dot{m}_r \quad \lambda\left(h_3-h_4\right)$ (26)
$\varepsilon_{S H X}=\frac{T_3-T_4}{T_3-T_1}$ (27)
The cooling effect performance is measured by the COP, which is described as:
$C O P_c=\frac{Q_{e v a}}{Q_{g e n}}$ (28)
3.2 Absorption chiller with SHX and LVHX
As can be seen in Figure 8, an LVHX has been integrated into this prototype of a single-effect absorption chiller in order to investigate the impact that this component has on the overall performance of the cycle.
The procedure for mathematical modelling stays similar to that described in the previous sub section (3.1), with the addition of an adequate energy balance at the LVHX.
Figure 8. Schematic diagram of the single effect NH3H2O absorption cooling system with LVHX
The energy balance and effectiveness of the liquid-vapor heat exchanger can be described using the equations that are shown below:
$\dot{Q}_{L V H X}=\dot{m}_r *\left(h_7-h_{7 "}\right)$ (29)
$\dot{Q}_{L V H X}=\dot{m}_r *\left(h_{9 "}-h_9\right)$ (30)
$\varepsilon_{L V H X}=\frac{T_7-T_{7 "}}{T_7-T_9}$ (31)
3.3 Simulation validation
Validation is the process of evaluating a simulation model to ensure that it accurately represents a real-world system. The goal of validation is to determine how closely the simulation results match actual measurements or data from the physical system being modelled.
There are various methods for quantifying the error between simulation results and experimental data. One common approach is to use the Error equation, which calculates the difference between the simulation results and experimental data as follow:
Error $=\frac{\text { Exp-Sim }}{\text { Exp }} \times 100 \%$ (32)
It was found that the model and the experiment's findings were fairly consistent. While the largest recorded disparity for both values was 20%, the difference between the two figures was less than 4.64% for the cooling capacity and 5.78% for the COP according to all data presented in Figures 9-13.
Discrepancies between simulations and experimental results in evaluating the absorption cooling system may stem from several factors. Idealized assumptions and simplified models in simulations might not fully capture the complexities of real-world systems, leading to inaccuracies. Variability in parameter estimation, boundary conditions, and control system dynamics can contribute to differences between simulated and experimental outcomes. Additionally, discrepancies may arise from assumptions about heat transfer, fluid dynamics, material degradation, sensor accuracy, and uncertainties in input data. Neglecting transient effects and discrepancies in assumed operating conditions can further contribute to the observed differences.
4.1 The system's response to evaporator temperature
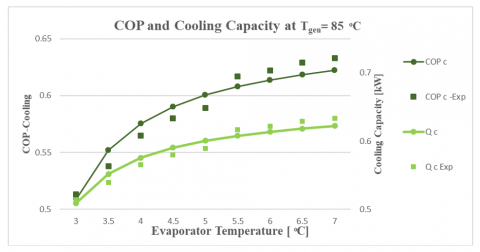
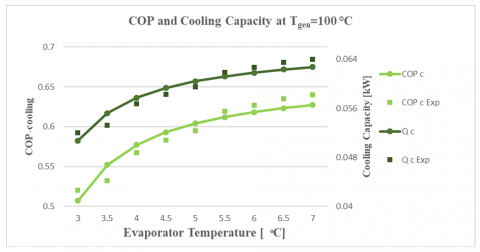
The impact of evaporator temperature on the system's COP and cooling capacity is shown in Figures 9, 10, and 11 at different generator temperature. These results' overall pattern agrees with the data found in the literature [31]. Figure 9 represents the effect of evaporator temperature on the COP of cooling effect and the cooling capacity at 85°C generator temperature, it can be seen that the COP increased with increasing the evaporator temperature, the theoretical cooling COP reaches to 0.62, while the experimental cooling COP reaches to 0.63 at 7°C evaporator temperature. The theoretical and experimental cooling capacity values are 0.62 and 0.63, respectively at the same temperature.
Figure 9. The cooling capacity and COP change for different evaporator temperatures at generator temperature 85℃
Raising the evaporator temperature could potentially explain this by improving the weak solution's absorption efficiency. As a result, the absorber and generator's thermal loads are decreased, which raises the COP.
Figure 10 illustrates the influence of evaporator temperature on the COP of cooling effect and the cooling capacity at generator temperature of 95℃, the theoretical COP and cooling capacity reach to 0.629 at 7℃ evaporator temperature. The experimental values reach to 0.637 for the COP and cooling capacity, at 7℃ evaporator temperature.
Figure 10. The cooling capacity and COP change for different evaporator temperatures at 95°C generator temperature
Figure 11 depicts the variation in cooling capacity and COP for different evaporator temperatures at a generating temperature of 100℃, at 7℃ evaporator temperature, the experimental COP and cooling capacity approach their maximum values of approximately 0.064, Whereas the theoretical COP and cooling capacity reach to 0.0627 at 7℃ evaporator temperature.
Figure 11. The cooling capacity and COP change for different evaporator temperatures at 100℃ generator temperature
4.2 The system's response to generator temperature
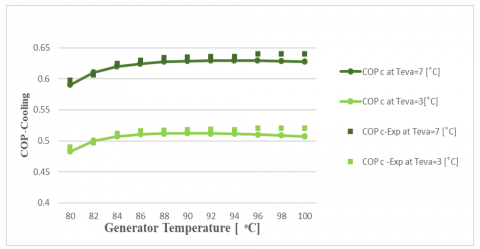
Figures 12 and 13 illustrate the influence of generator temperature on COP and cooling capacity at different evaporator temperature. Figure 12 depicts the variation in the COP for various generator temperatures at 7℃ and 3℃ evaporator temperature. As can be observed, COP initially rises as generator temperature rises, reaches a maximum value, and then tends to steady before slightly falling, this might have been caused by variations in ammonia concentration caused due to increased generator temperature.
At a generator temperature of about [90℃-94℃], a little improvement in COP was also noted. This is because the water entering and leaving the generator has a greater temperature difference, which increases the load on the generator and causes more irreversibility at higher generator temperatures.
The highest theoretical cooling COP can be obtained at 7℃ evaporator temperature is 0.6295 at [92℃, 94℃] generator temperature, while the highest experimental cooling COP can be obtained is 0.64 at [96℃, 98℃, 100℃] generator temperature.
The highest theoretical COP can be achieved at 3°C evaporator temperature is 0.512 at [90℃, 92℃] generator temperature. Whereas the experimental COP reaches to 0.52 at [96℃, 98℃, 100℃] generator temperature.
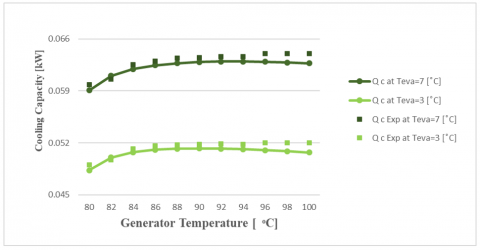
Figure 13 illustrates the variance in cooling capacity across a range of generator and evaporator temperatures. Clearly, the evaporator temperature influences the cooling capacity, the maximum theoretical and experimental cooling capacity can be obtained is (0.0629, 0.064), respectively at 7℃ evaporator temperature.
Figure 12. COP changes for different generator temperatures at 7℃ and 3℃ evaporator temperature
Figure 13. The variation of cooling capacity for different generator at 7℃, 3℃ evaporator temperature
Figures 14 and 15 illustrate the contour plots of COP and cooling capacity against the temperatures of the generator and evaporator, it can be seen that the highest COP and cooling capacity can be achieved at [92℃, 94℃] generator temperature and 7℃ evaporator temperature.
An absorption chiller with a higher COP is more efficient and may deliver more cooling for each unit of input energy. Increased COP values are typically linked to lower energy consumption, which can help reduce greenhouse gas emissions and have a smaller environmental impact. Additionally, as the COP grows, the energy consumption for a given cooling load reduces.
Figure 14. The contour plot of the COP of cooling effect plotted against the generator and evaporator temperatures
Figure 15. The contour plot of the cooling capacity plotted against the generator and evaporator temperatures
4.3 The system's response to solution heat exchanger temperature
The influence of solution heat exchanger temperature at point 2 (T2) on T4, the effectiveness of the solution heat exchanger and the COP of cooling effect at 95℃ generator temperatures and 7℃ evaporator temperatures is depicted in figure 16. It is clear to see that raising T2 not only raises the COP but also raises the effectiveness of the solution heat exchanger, all while causing a drop in the temperature of the heat exchanger at point 4 (T4). At a temperature of 74℃ T2, the highest cooling COP that can be reached is 0.6293, whereas the highest effectiveness ratio that can be achieved at this temperature is 0.9.
Figure 16. The effect of T2 on the T4, the solution heat exchanger effectiveness and COP of cooling effect at 95℃ generator temperatures and 7℃ evaporator temperature
4.4 Effect of LVHX on the performance of the absorption chiller cycle
The impact that the utilization of LVHX on the performance of the absorption chiller cycle is depicted in Figures 17, 18, and 19. Figure 17 illustrates the variation in COP at a 95℃ generator temperature for various evaporator temperatures when utilization SHX and when utilization LVHX+SHX. It is clear that when using SHX alone, the highest COP that can be attained is 0.629; however, when using LVHX and SHX together, the COP can reach 0.7. It can be seen that the utilization of LVHX improves the performance of the cycle by around 7.5%.
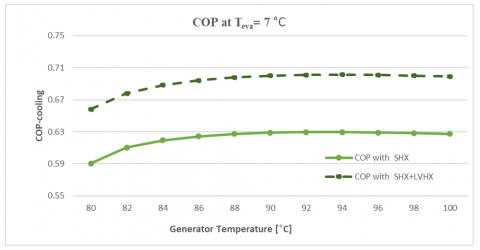
Figure 18 illustrates the change in COP that occurs for different generator temperatures at an evaporator temperature of 7℃ when SHX is utilized and when LVHX+SHX is utilized. The highest COP that can be achieved with SHX alone is 0.627, but with LVHX and SHX together, the COP can rise to 0.699, therefore it is apparent that the use of LVHX increases the performance of the cycle by roughly 7%.
Figure 19 depicts the influence of liquid vapour heat exchanger effectiveness on the COP, LVHX temperature at point 7" (T 7"), and LVHX temperature at point 9" (T 9") at 95℃ generator and 7°C evaporator temperatures. When the effectiveness of LVHX is increased, it is clear that the COP and the LVHX temperature at point 9" (T 9") both rise, however the LVHX temperature at point 7" (T 7") falls. Increasing the efficiency of LVHX causes an increase in the thermal load on the evaporator, which causes the COP to also go up.
Figure 17. The COP change for different evaporator temperatures at 95℃ generator temperature with SHX and with utilizing LVHX+SHX
Figure 18. The COP changes for different generator temperatures at 7℃ evaporator temperature with SHX and with utilizing LVHX+SHX
Figure 19. Effect the effectiveness of liquid vapour heat exchanger on the COP, T [7"] and T [9"] at 95℃ generator temperatures and 7℃ evaporator temperature
A single effect of 100 W NH3-H2O absorption cooling system's performance has been investigated by theoretical and experimental evaluations at a variety of different operating conditions. Thermodynamic characteristics of the NH3-H2O absorption cooling system were calculated using the EES program. The mathematical model is split into two parts: the first part incorporates SHX without LVHX, while the second part incorporates SHX and LVHX as part of the cycle. The impact of evaporator temperatures, generator temperatures, solution heat exchanger and liquid vapour heat exchanger on the system performance are investigated.
The result shows that the COP increased with increasing the evaporator and generator temperatures, the theoretical and experimental cooling COP reaches to 0.62 and 0.63 respectively, at 7℃ evaporator temperature and 85℃ generator temperature, while it is 0.629 and 0.637 at 95℃ generator temperature for the same evaporator temperature. The highest theoretical COP achievable at 3℃ evaporator temperature is 0.512 at 90℃ generator temperature, while the experimental COP approaches 0.52 at 96℃, 98v, and 100℃ generator temperatures. For every unit of input energy, an absorption chiller with a greater COP is more effective and might provide more cooling. Lower energy use is often associated with higher COP values, which can assist cut greenhouse gas emissions and have a reduced environmental effect. Furthermore, for a given cooling demand, the energy consumption decreases as the COP increases.
An LVHX has been incorporated into the module of a single-effect absorption chiller in order to examine the effect this component has on the overall performance of the cycle. It is found that the utilization of LVHX improves the performance of the cycle by around 7-7.5%.
Enhancements to the absorption system can be achieved through the development of a multi-stage absorption chiller, effectively increasing overall capacity and improving the COP of the cycle. Further exploration is warranted to investigate the impact of key parameters, including evaporator temperature, generator temperature, absorber temperature, and condenser temperature, particularly in the context of large-scale systems. Additionally, the integration of solar energy sources, such as Parabolic Trough Collectors (PTC) or PV modules, presents an avenue to reduce power consumption in large-scale absorption systems, showcasing a potential avenue for sustainable and energy-efficient operation.
|
SHX |
Solution Heat Exchanger |
|
LVHX |
Liquid Vapour Heat Exchanger |
|
EES |
Engineering equation solver |
|
COP |
Coefficient of performance |
|
ṁ |
Mass flow rate (kg/s) |
|
Q̇ |
Heat transfer rate (kW) |
|
T |
Temperature (°C) |
|
ε |
Effectiveness of heat exchanger |
|
Q |
Capacity (kW) |
|
µ |
dynamic viscosity, kg. m-1.s-1 |
|
Subscripts |
|
|
abs |
Absorber |
|
con |
Condenser |
|
eva |
Evaporator |
|
gen |
Generator |
|
SS |
Strong solution |
|
WS |
Weak solution |
|
C,c |
Cooling |
|
HP |
Heat pump |
|
h |
Enthalpy |
|
r |
Refrigerant |
|
X |
Solution concentration |
Figure A1. Sample EES code snippet
[1] Rapson, D. (2014). Durable goods and long-run electricity demand: Evidence from air conditioner purchase behavior. Journal of Environmental Economics and Management, 68(1): 141-160. https://doi.org/10.1016/j.jeem.2014.04.003
[2] Davis, L.W., Gertler, P.J. (2015). Contribution of air conditioning adoption to future energy use under global warming. Proceedings of the National Academy of Sciences, 112(19): 5962-5967. https://doi.org/10.1073/pnas.1423558112
[3] Sivak, M. (2013). Will ac put a chill on the global energy supply? Several developing nations could soon lead the world in use of air-conditioning. American Scientist, 101(5): 330-334.
[4] Prakash, R., Bhat, I.K. (2012). Life cycle greenhouse gas emissions estimation for small hydropower schemes in India. Energy, 44(1): 498-508. https://doi.org/10.1016/j.energy.2012.05.052
[5] Rosenfield, J.E., Douglass, A.R., Considine, D.B. (2002). The impact of increasing carbon dioxide on ozone recovery. Journal of Geophysical Research: Atmospheres, 107(D6): ACH-7. https://doi.org/10.1029/2001JD000824
[6] Gielen, D., Gorini, R., Wagner, N., et al. (2019). Global Energy Transformation: A Roadmap to 2050. International Renewable Energy Agency (IRENA).
[7] Sovacool, B. K., Griffiths, S., Kim, J., Bazilian, M. (2021). Climate change and industrial F-gases: A critical and systematic review of developments, sociotechnical systems and policy options for reducing synthetic greenhouse gas emissions. Renewable and Sustainable Energy Reviews, 141: 110759. https://doi.org/10.1016/j.rser.2021.110759
[8] Lee, H., Lee, J.D., Kim, Y. (2018). Effect of nonionic surfactants on f-gases (HFC-134a and SF6) hydrate formation. Industrial & Engineering Chemistry Research, 57(39): 12980-12986. https://doi.org/10.1021/acs.iecr.8b02651
[9] Pachauri, R.K., Allen, M.R., Barros, V.R., Broome, J., Cramer, W., Christ, R., Church, J.A., Clarke, L., Dahe, Q., Dasgupta, P. and Dubash, N.K. (2014). Climate change 2014: Synthesis report. Contribution of Working Groups I, II and III to the Fifth Assessment Report of the Intergovernmental Panel on Climate Change. Ipcc.
[10] Velders, G.J., Fahey, D.W., Daniel, J.S., McFarland, M., Andersen, S.O. (2009). The large contribution of projected HFC emissions to future climate forcing. Proceedings of the National Academy of Sciences, 106(27): 10949-10954. https://doi.org/10.1073/pnas.0902817106
[11] Wan, K.K., Li, D.H., Liu, D., Lam, J.C. (2011). Future trends of building heating and cooling loads and energy consumption in different climates. Building and Environment, 46(1): 223-234. https://doi.org/10.1016/j.buildenv.2010.07.016
[12] Makahleh, F.M., Badran, A.A., Attar, H., Amer, A., Al-Maaitah, A.A. (2022). Modeling and simulation of a two-stage air cooled adsorption chiller with heat recovery part I: Physical and mathematical performance model. Applied Sciences, 12(13): 6542. https://doi.org/10.3390/app12136542
[13] Makahleh, F.M., Badran, A.A., Attar, H., Amer, A., Al-Maaitah, A.A. (2022). Modeling and simulation of a two-stage air-cooled adsorption chiller with heat recovery part II: Parametric study. Applied Sciences, 12(10): 5156. https://doi.org/10.3390/app12105156
[14] Taleb, H.M. (2015). Natural ventilation as energy efficient solution for achieving low-energy houses in Dubai. Energy and Buildings, 99: 284-291. https://doi.org/10.1016/j.enbuild.2015.04.019
[15] Mohamed, A., Hasan, A. (2016). Energy matching analysis for net-zero energy buildings. Science and Technology for the Built Environment, 22(7): 885-901. https://doi.org/10.1080/23744731.2016.1176850
[16] Astaraei, F.R., Sameti, M., Jokar, M.A., Pourfayaz, F. (2018). Numerical simulation of solar-driven Kalina cycle performance for centralized residential buildings in Iran. Intelligent Buildings International, 10(4): 197-219. https://doi.org/10.1080/17508975.2016.1197092
[17] Bellos, E., Tzivanidis, C., Moschos, K., Antonopoulos, K.A. (2016). Energetic and financial evaluation of solar assisted heat pump space heating systems. Energy Conversion and Management, 120: 306-319. https://doi.org/10.1016/j.enconman.2016.05.004
[18] Iodice, P., Cardone, M. (2020). Impact of a trigeneration power system fuelled by vegetable oil on environmental air pollution by numerical simulations. Energy & Environment, 31(7): 1200-1213. https://doi.org/10.1177/0958305X19888879
[19] Abrudan, A.C., Pop, O.G., Serban, A. and Balan, M.C., 2019. New perspective on performances and limits of solar fresh air cooling in different climatic conditions. Energies, 12(11): p.2113. https://doi.org/10.3390/en12112113
[20] Fopah Lele, A. (2015). A Thermochemical Heat Storage System for Households: Thermal Transfers Coupled to Chemical Reaction Investigations. Springer Cham. https://doi.org/10.1007/978-3-319-41228-3
[21] Romero, R.J., Rodríguez-Martínez, A. (2008). Optimal water purification using low grade waste heat in an absorption heat transformer. Desalination, 220(1-3): 506-513. https://doi.org/10.1016/j.desal.2007.05.026
[22] Quoilin, S., Aumann, R., Grill, A., Schuster, A., Lemort, V., Spliethoff, H. (2011). Dynamic modeling and optimal control strategy of waste heat recovery Organic Rankine Cycles. Applied Energy, 88(6): 2183-2190. https://doi.org/10.1016/j.apenergy.2011.01.015
[23] Javani, N., Dincer, I., Naterer, G.F. (2012). Thermodynamic analysis of waste heat recovery for cooling systems in hybrid and electric vehicles. Energy, 46(1): 109-116. https://doi.org/10.1016/j.energy.2012.02.027
[24] Li, Z.F., Sumathy, K. (2000). Technology development in the solar absorption air-conditioning systems. Renewable and Sustainable Energy Reviews, 4(3): 267-293. https://doi.org/10.1016/S1364-0321(99)00016-7
[25] Crofoot, L., Harrison, S. (2012). Performance evaluation of a liquid desiccant solar air conditioning system. Energy Procedia, 30: 542-550. https://doi.org/10.1016/j.egypro.2012.11.064
[26] Wu, S., Eames, I.W. (2000). Innovations in vapour-absorption cycles. Applied Energy, 66(3): 251-266. https://doi.org/10.1016/S0306-2619(99)00128-2
[27] Kadam, S.T., Kyriakides, A.S., Khan, M.S., Shehabi, M., Papadopoulos, A.I., Hassan, I., Rahman, M.A., Seferlis, P. (2022). Thermo-economic and environmental assessment of hybrid vapor compression-absorption refrigeration systems for district cooling. Energy, 243: 122991. https://doi.org/10.1016/j.energy.2021.122991
[28] Amaris, C., Rodriguez, A., Sagastume, A., Bourouis, M. (2022). Performance Assessment of a solar/gas driven NH3/LiNO3 absorption cooling system for malls. In Recent Advances in Energy Technologies: Select Proceedings of ICEMT 2021, Singapore: Springer Nature Singapore, pp. 311-328. https://doi.org/10.1007/978-981-19-3467-4_19
[29] Kumar, G.P., Ayou, D.S., Narendran, C., Saravanan, R., Maiya, M.P., Coronas, A. (2023). Renewable heat powered polygeneration system based on an advanced absorption cycle for rural communities. Energy, 262: 125300. https://doi.org/10.1016/j.energy.2022.125300
[30] Koronaki, I.P., Rogdakis, E., Kakatsiou, T. (2013). Experimental assessment and thermodynamic analysis of a solar desiccant cooling system. International Journal of Sustainable Energy, 32(2): 121-136. https://doi.org/10.1080/14786451.2012.666551
[31] Al-Rbaihat R., Alahmer H., Alahmer A., Altork Y., Al-Manea A., Awwad K.E. (2023). Energy and exergy analysis of a subfreezing evaporator environment ammonia-water absorption refrigeration cycle: Machine learning and parametric optimization. International Journal of Refrigeration. 154(1): 182-204. https://doi.org/10.1016/j.ijrefrig.2023.07.010