Xuan L. Nguyen![]() | Yoora Choi
| Yoora Choi![]() | Huu L. Nguyen
| Huu L. Nguyen![]() | Sangseok Yu*
| Sangseok Yu*![]()
© 2024 The authors. This article is published by IIETA and is licensed under the CC BY 4.0 license (http://creativecommons.org/licenses/by/4.0/).
OPEN ACCESS
The uncertainty analysis of moisture measurements in the hollow fiber membrane was conducted in this study to ensure the reliability of a design for membrane humidifiers. As moisture is pivotal for proton exchange membrane fuel cell durability and performance, it is necessary to humidify the reactant gases. In vehicular fuel cells, membrane humidifiers have been implemented to regulate the water content levels of cathode air, thereby avoiding fuel cell operation limitations, particularly in high-temperature environments. Minimized error in measurements of water exchange is required to improve the effectiveness of shell-tube membrane humidifier design. The uncertainty analysis was conducted through parametric experiments under isothermal conditions with varying conditional parameters, including temperature, pressure, and inlet relative humidity. The transport metric is represented by the vapor transfer rate from wet to dry air through the membrane, which is affected by the sensitivity of the corresponding operating parameters and sensor reliability. Therefore, the error of each conditional (input) parameter and the overall error of the measured result (water transfer rate) were determined to evaluate the quality of measurements. From the analysis, the most sensitive factor was discovered to be the inlet relative humidity, with error increasing as temperature increased. The uncertainty of water transport measurements was highest at 90℃, amounting to 3.97%. Consequently, it can be concluded that the measurement of water transport in the membrane humidifier meets good reliability for further design and investigation.
fuel cell, hollow fiber membrane, membrane humidifier, reliability, uncertainty analysis, vapor transport
The management of water content in an automotive fuel cell is a highly critical aspect of its functionality. A humidifier is indispensable to ensure that the fuel cell maintains adequate levels of humidity during regular operation [1-5]. The majority of automotive fuel cell systems adopt an external humidifier that provides precise control over the humidity and temperature of the reactant gases [6]. This strategy not only improves fuel cell performance but also prolongs its lifespan. In the absence of proper humidification, the hydration in the proton exchange membrane may solely rely on the product water from the cathode-side electrochemical reaction, which can cause dehydration on the anode side due to the electro-osmotic drag of hydrogen migration. Furthermore, high water activity can cause flooding on the cathode side, which diminishes performance at high current densities. Therefore, an efficient humidification strategy is essential for optimal automotive fuel cell operation.
To control effectively the humidification in fuel cell systems, external membrane humidifiers are used without increasing parasitic power. The membrane installed in fuel cell systems could be classified by shape, including flat sheet, hollow fiber, and hollow capsule [7, 8]. The flat sheet has very high specific surface areas and can be stacked with many layers to be a module; however, it cannot withstand high pressure. The hollow capsule structure is generally used for viscous and low-quality fluids because it is not easily fouled. The drawback of this membrane structure is that it is not self-supporting and has a low packing density [9]. On the other hand, the hollow fiber membrane, or shell and tube hollow fiber membrane, has been widely used for humidifiers in automotive applications due to their high packing efficiency. A self-contained and compact structure can provide a versatile design to optimize humidifier performance [10-13]. This type of humidifier has dry air and moistened air channels separated by a permeable membrane that allows only water vapor particles to pass through.
The hollow fiber membrane enables water vapor to transfer from humid gas to dry gas by diffusion. The moisture permeation through the membrane, driven by concentration or pressure gradients, is crucial in regulating the water content. The axial convective flow of working fluids also affects water vapor diffusion through the membrane. Since the water transport capacity of the hollow fiber membrane determines the performance of the membrane humidifier, it is necessary to investigate it precisely in fuel cell systems. The main parameters of the water transport experiment through the hollow fiber membrane are water vapor concentrations on the humid and dry sides. These parameters depend on the operating pressures, flow rates, temperature, and relative humidity of gases. Besides the experimental parameters, water transport experiments are also affected by sensor errors, the error of the humidifying device, water accumulation through pipes and fittings, and unexpected controller malfunction. Even though these factors should be avoided to improve measurement accuracy, some factors might be inevitable.
In this study, the reliability of vapor transport measurements in a hollow fiber membrane humidifier was investigated. A shell and tube configuration of the humidifier was designed to facilitate mass transfer through the membrane in diffusion and convection mechanisms. The water transport rate in this system is influenced by several conditional parameters (inputs), such as temperature, flow rate, relative humidity, and pressure. Since errors of these parameters affect the overall error of the experimental result (output), a thorough analysis of the uncertainty in vapor transport measurements was first performed for each parameter, and then the overall uncertainty of the water transport rate was evaluated by employing the root-squared-sum method. The uncertainty analysis should be conducted to assess the reliability of water transfer measurement in a hollow fiber membrane humidifier. The minimized error of experimental results allows the design of experiment and the method of investigation to be acceptable to find a reliable membrane humidifier in fuel cell systems.
A reliable measurement of water transport is crucial to analyze and evaluate the performance of the membrane humidifier so that the water management system in a fuel cell system can be designed as perfectly as possible. Consequently, uncertainty analysis is the must-do process before further conducting the experiment and modeling for the membrane humidifier. The error concept and evaluation method are first reviewed to understand the experimental research's reliability.
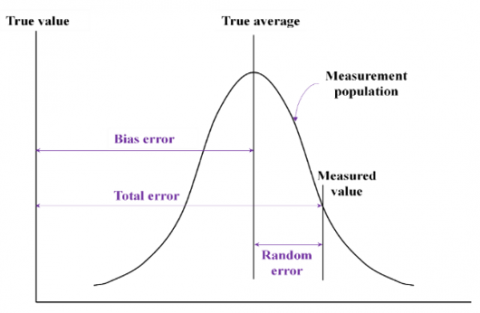
Errors are unavoidable in every measurement; an error is a difference between the measured and true values, as shown in Figure 1. An error is defined as:
$\operatorname{Error}(U)=X_{\text {measured }}-X_{\text {true }}$ (1)
As in Figure 1, the total errors can be expressed by two primary components: a bias (systematic) error and a precision (random) error. While the bias error is the difference between the true value and the true average (the average of all data points, the random error is the deviation between the true value and each measured data. An error is classified as precision if it contributes to the scatter of the data; otherwise, it is a bias error [14, 15].
Figure 1. Diagram of the measurement error
A bias error is a systematic error caused by sensors and experimental system design that appears consistently in each successive measurement. Each measurement of a given set has the same bias in repeated measurements.
A precision error arises from non-repeatable and unpredictable fluctuations caused by unknown factors in various experimental conditions. It is typically quantified by the standard deviation in statistical analysis. This error can be reduced by averaging over a large number of observations using the Gaussian distribution assumption.
$P=\left(\frac{\sum_{i=1}^N\left(X_i-\bar{X}\right)^2}{N-1}\right)^{1 / 2}$ (2)
where, $\bar{X}$ is the average of a data set, including N repeated measurements, and i is the index of the measured data.
As seen in Figure 1, the total of errors combines the bias and random errors using the root-sum-square method. Even though an experimental error may arise from various sources, such as calibration errors, data acquisition errors, or data reduction errors, each contains bias and precision components. The bias and precision errors should be determined separately and then combined at the last step of computing [16].
$\begin{gathered}B=\left[\sum_{i=1}^N\left(B_i\right)^2\right]^{1 / 2} ; P=\left[\sum_{i=1}^N\left(P_i\right)^2\right]^{1 / 2} ; \\ U=\left(B^2+P^2\right)^{1 / 2}\end{gathered}$ (3)
The concept of normal distribution of randomly distributed measurements was mentioned in most of the literature on uncertainty analysis, that is, approximately 68% of all measured data fall within ±σ of the mean, 95% are within ±2σ of the mean, and 99.7% are within ±3σ of the mean of the individual measurements. Here, σ is the standard deviation. The confidence interval of 95% is commonly used for the uncertainty analysis of experiments.
For a better understanding of uncertainty, the concept of accuracy and precision of a measurement is distinguished as in Figure 2. The smallest circle stores the true values, and when the measured data stay far from this circle, they can be stated as high errors. The dots represent the data in each measurement. The accuracy of a measurement is the difference between measured results and the true value, while the precision of a measurement is the difference between repeated data points during the same measurement. A measurement is considered to be precise when the random error is small. On the other hand, a small bias error results in an accurate measurement. The perfect results will be obtained if an experiment is accurate and precise, as shown in Figure 2(d).
Figure 2. Distribution of uncertainty
As far as the uncertainty of a result is concerned, suppose that n independent parameters contribute to the magnitude of the results as follows:
$R=f\left(x_1, x_2, \ldots x_n\right)$ (4)
The uncertainty of a dependent variable cannot be measured directly as an independent variable. Individual quantities of the variable measurements and their errors are measured in the first step, and then the uncertainty of the final results is propagated via the data reduction equation [17].
$u_R=\left[\left(\frac{\partial R}{\partial x_1} u_1\right)^2+\left(\frac{\partial R}{\partial x_2} u_2\right)^2+\cdots+\left(\frac{\partial R}{\partial x_n} u_n\right)^2\right]^{1 / 2}$ (5)
where, $\frac{\partial R}{\partial x_i}$ is the sensitivity factor; $u_1, u_2, \ldots, u_n$ are uncertainty of independent variables (inputs); $u_R$ is the uncertainty of the dependent variable R (output).
3.1 Measuring equipment
The error in equipment is systematic and is caused by fundamental flaws in the setup. The cause could be the equipment itself or improper equipment use, such as incorrect calibration and electronic noises. The sensor manufacturer includes this uncertainty in the specification sheet. The measured physical parameters of gas flow, such as temperature, pressure, flow rate, and humidity, influence vapor transport in a membrane humidifier. Table 1 shows the specifications and uncertainty of the sensors used to measure those parameters.
Table 1. Uncertainties of the measuring devices
|
Measuring Device |
Model |
Accuracy (%) |
|
Mass flow controller |
M3030VA |
±1 |
|
Humidity sensor |
Vaisala HMT337 |
±1 |
|
Thermocouple |
T type |
±0.4 |
|
Pressure transmitter |
P126 |
±0.25 |
3.2 Data acquisition
3.2.1 Design of a hollow fiber membrane humidifier
In this study, the water transport was measured for a 21-tube membrane module made of polytetrafluoroethylene (PTFE) polymer. Two tube holders properly distributed the membrane tubes, as in Figure 3(a). These holders were filled with epoxy resin to support the membrane module configuration and prevent air leakage. The membrane tubes were installed within an effective shell with a length of 110 mm and a diameter of 17.5 mm, where wet air was induced to make proper contact with each tube (shell side). Pure dry air entered directly from an air compressor for the tube side to exchange moisture with outer wet air through the membranes. Table 2 contains information on the designed membrane module and test jig.
Figure 3 presents a functional diagram and a photograph of the humidifier jig. It was built with a wet air compartment sandwiched between two dry air compartments. The effective shell is only the long and narrow section directly in contact with the membrane tubes, but two extra volume sections were created to achieve a stable condition and increase the resident time of the induced wet air. Stabilizing gas flows reduced process noise, making the data more reliable. The gas flow on the shell side was parallel to the membrane tubes in this jig configuration.
Table 2. Dimensions of the test jig and hollow fiber membrane module
|
Parameter |
Value (mm) |
|
Length of membrane module (Lt) |
230 |
|
Length of the effective membrane (Le) |
110 |
|
Tube holder diameter |
15 |
|
Membrane outer diameter |
1.1 |
|
Membrane thickness |
0.1 |
|
Dry & extra wet chamber width |
40 |
|
Dry & extra wet chamber diameter |
90 |
|
Effective shell width |
110 |
|
Inner diameter of the shell |
17.5 |
(a) A hollow fiber membrane module
(b) Diagram of test jig design
(c) Actual shell and tube test jig
Figure 3. Design of a hollow fiber membrane humidifier
3.2.2 Experimental apparatus
Figure 4 depicts the schematic diagram of the experimental apparatus and the actual system for measuring the vapor transport in the humidifier. An air flow delivered by a compressor passed through a drier to eliminate its moisture, then flowed over a filter before entering the test jig with two separate streams. One was introduced as dry air into an inlet compartment and flowed inside the membrane tubes. For the other stream, extra water vapor was added by controlling the temperature of a bubble humidifier, which was indicated by a wet air flow. This moist air then flowed into the inlet wet air compartment of the jig and contacted the outer surface of the membranes. To balance the air flow rates of the inlet streams, Linetech M3030VA mass flow controllers were used. The physical properties of each air stream were meticulously measured in order to investigate the vapor transport phenomenon. Therefore, four chambers were set up at inlets and exits of the air flows to measure their temperature and relative humidity. These chambers had large enough volumes to prevent unexpected disturbances that could affect the reliability of the measurements. Vaisala Sensors HMT337 were used to measure the temperature and relative humidity at the inlet and outlet points of dry and wet air, while Wise Sensor P126 pressure transmitters were chosen to obtain air pressures and T-type thermocouples were set up in the temperature control loop. Line heaters and insulation material also aided in keeping the mass exchange experiments isothermal. Two required valves at the stream outlets were used to adjust the back pressure. A Compact FieldPoint device was used to collect experimental results, which were then monitored using LabVIEW codes.
Figure 4. Diagram and actual experimental apparatus
3.2.3 Process of measurement
This research was conducted to analyze the uncertainty of vapor transport measurement. A minimized error means that the study is good enough to develop, and the data is reliable sufficient to analyze the vapor transport behavior and design the best version of the hollow fiber membrane humidifier. Experiments were carried out to measure the water vapor transport rate through the membrane based on the increase in water vapor mass from the inlet to the outlet of the dry air stream. The stabilization of gas mixture conditions is vitally important to obtain precise data. Therefore, the thermal mass of the test jig was designed to be large enough to maintain the gas temperature inside. The heating lines also eliminated the temperature fluctuation along the air streams. The relative humidity of the wet air inlet was controlled using a gas-bubbling humidifier and bypass valve. The water amount in this humidifier was also large enough to maintain the steady state of the inlet relative humidity signal. When the experimental conditions were stable, the relative humidity and temperature of air streams were recorded at the inlet and outlet chambers. Finally, the water transport rate was determined using the data reduction equations.
The procedure for recording measurement data is illustrated in Figure 5. The sensor is used to detect the physical quantity being measured. The transducer converts the measured data into an electrical signal so that electronic devices can record it. The signal conditioning system can filter the electrical signal noise, shape the signal, or amplify the signal magnitude to make it suitable for the data acquisition system (DAQ) hardware. In the next stage, the conditioned analog signal is transformed into a digital signal compatible with digital computers. LabVIEW codes were built up to read the recording data.
Figure 5. Data acquisition system
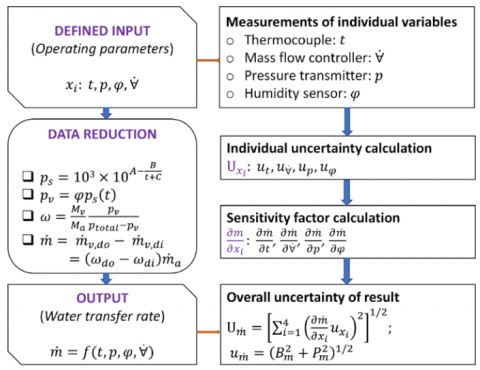
3.3 Data reduction
An objective of vapor transport measurement in a membrane humidifier is determining the vapor transfer rate through the membrane. There is no sensor to measure this rate directly, but it can be calculated via the data reduction process in Figure 6. In this study, the vapor transfer rate is determined by the increment of the water content on the dry air side. This water content can be measured via absolute humidity of the inlet and outlet air using the dewpoint sensor. In addition to the uncertainty from the measuring equipment, the data reduction uncertainty was provided by the relationship between the calculated data and each independent variable.
Figure 6. Data reduction process and uncertainty analysis scheme
4.1 Propagation of uncertainty
The water transport rate is a key characteristic to estimate the performance of a membrane humidifier and then propose an efficient strategy to optimize the humidifier design and its operational parameter conditions. In this study, both air sides of the membrane were set up with the same inlet temperature, flow rate, and pressure conditions but different inlet relative humidity. Therefore, the main driving force of water vapor transport in the test jig was the concentration gradient between the dry air and wet air. The water transport rate determination was based on the variation in the physical properties of dry air streams to minimize the noise caused by water vapor molecule movement. The dry inlet air contained about 1% relative humidity and remained so in all the experiments, while the relative humidity of the wet inlet air was controlled up to 98%. The higher amount of water in the inlet air-water vapor mixture or the water droplet generated at very high humidity conditions resulted in higher measurement uncertainty. The uncertainty of the water transfer rate through the membrane in this study was 3.97% and 4.62%, based on the dry and wet sides.
Figure 6 provides the propagation of the water transport rate uncertainty through the hollow fiber membrane. The water transport was captured using the recorded data from sensors installed at the inlet and outlet air streams, and then the transport rate was calculated via the data reduction equations. The initial operating parameters were set up using sensors and controllers. The sensitivity of these sensors and working conditions affected the measured data, expressed by experimental errors. The true values here are the desired parameters or the setpoints. The uncertainties of independent variables were calculated after the experimental data were recorded. The sensitivity and uncertainty of the dependent variable were also calculated according to the root-sum-squared method. The component and overall uncertainties have a confidence level of 95% as the ideal reliability.
4.2 Error estimation of vapor transport rate
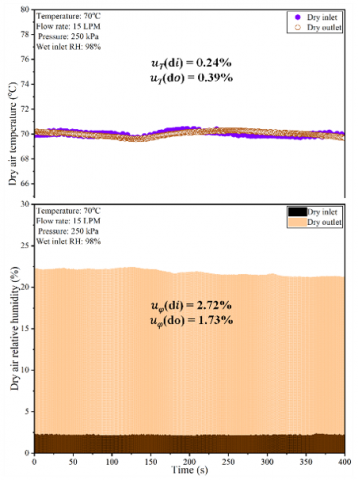
The determination of the water vapor transport rate was based on the enhancement of vapor concentration on the dry air side. Therefore, the data of the dry air streams were captured to calculate the measurement uncertainty of each parameter at three temperature conditions. Figure 7 shows the temperature and relative humidity signals measured by the Vaisala sensor in the inlet and outlet chambers. The chamber temperatures were set up using PID controllers and solid-state relays integrated with heating lines. Insulation material was also used to ensure the heat loss was minimized. The steady-state with minimal fluctuation can be observed throughout the experiments at 50℃, 70℃, and 90℃. The uncertainty of temperature measurement was less than 0.4%. The relative humidity in the inlet and outlet chamber varied with increasing operating temperature. The inlet air relative humidity decreased from around 6.5% to 0.5% as the temperature increased from 50℃ to 90℃, while the relative humidity of the outlet air changed slightly. However, the main force of water transport was absolute humidity, which is a function of relative humidity and temperature. Another error of relative humidity also influenced the transport rate uncertainty. At 90℃, the most significant fluctuation of the relative humidity signal was captured because the high temperature accelerates the kinetic of gas molecules. The uncertainty was about 11.69% and 2.16% at the dry inlet and outlet chamber. The uncertainty of the inlet dry air was high, but it was the relative uncertainty calculated in the chamber at 0.5% relative humidity condition. These huge uncertainties were reduced when multiplied by the sensitivity coefficient in the overall uncertainty equation.
The uncertainty of the air flow rate controlled by the mass flow controllers in this study was less than 0.05%, so it could be ignored to simplify the sensitivity factor determination using partial derivation.
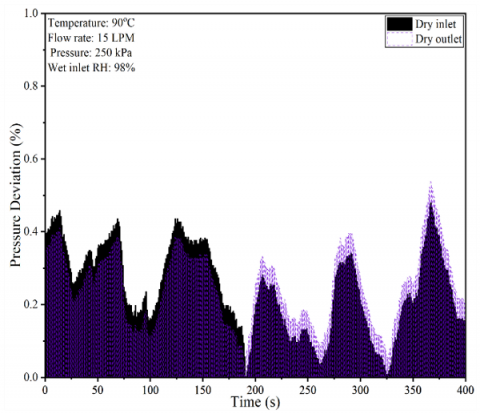
Pressure also affected the water transport rate through the membrane, and hence the uncertainty of the pressure measurement contributed to the overall uncertainty. The operating conditions were set up with a counter-current flow, so the wet air inlet and dry air outlet were balanced at the desired 250 kPa using the back valves. Figure 8 shows the deviation in measuring the inlet and outlet pressure. The deviation was always less than 1% even though the increased temperature resulted in signal disturbance.
(a) 50℃
(b) 70℃
(c) 90℃
Figure 7. Measurement of the temperature and relative humidity of the dry air
(a) 50℃
(b) 70℃
(c) 90℃
Figure 8. Measurement of the pressure of the dry air
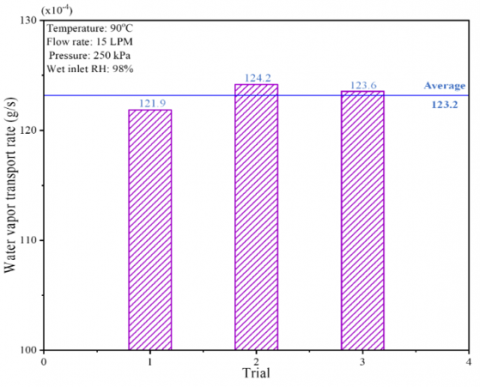
The experimental research was done with an isothermal condition so that only the mass transfer through the membrane was taken into account. The temperature of the test jig was collected by a T-type thermocouple as a feedback signal and a PID control module allowed to reach the setpoint using the heating line. The error of this temperature and the random error of operational inlet parameters made the water transport rate sensitive when we repeated the experiments with three trials, as shown in Figure 9. The difference in the results indicates the precision error of the water transport rate, which was a portion of the overall uncertainty that would be provided at the last stage. The best estimation of the water transport rate was the average value, which was 123.2×10⁻⁴g/s.
Figure 10 shows the water transport rate through the membrane and the total error over three temperature conditions. Both of them increased as the temperature increased from 50℃ to 90℃. The trend of the water transport rate agreed with Nguyen et al.’s [11] previous research, which proposed that the transport rate through the membrane had an exponential relation with the temperature. The water transport rate was 17.76×10⁻⁴g/s at 50℃, then it was raised by 2.8 times and 7.4 times at 70℃ and 90℃. The highest uncertainty of the water transport measurement was 3.97%, meaning that this experimental investigation has high reliability in measuring the water vapor transport through the membrane of a humidifier.
Figure 9. Sensitivity of the water vapor transport rate through the membrane
Figure 10. Water vapor transport rate and its uncertainty at different temperatures
The minimized error of humidification performance of the membrane humidifier was determined to optimize the system design and improve the reliability of experimental research on water management in fuel cells. This reliable measurement method can be used for testing and proposing empirical correlations of the hollow fiber membrane, such as diffusivity and permeability, or to evaluate and predict the performance of a practical humidifier. To further investigate a fuel cell system using an analytical model, this reliable experiment is essential for validation. The validated model can be used as a feasible approach to predict the operation of a dynamic fuel cell system and then enhance the flexibility for applications.
This paper provided a strategy for uncertainty analysis of vapor transport observation through a membrane based on the sensitivity of key operating parameters. The analysis was a principle for optimizing the experiment design before conducting a series of parametric tests. It substituted for the error confirmation method in the previous research on a similar system for vapor transport experiments, in which a test was done repeatedly to confirm the deviation of the water transfer rate. Even though several sources of error were not analyzed, they could be neglected due to the minor effect on the overall uncertainty. The uncertainty of each parameter measurement was determined through a combination of bias uncertainty and precision uncertainty. Then, the total uncertainty of the experimental results was finally computed using the root-sum-squared equation. The reliability of the water transport rate through the membrane was influenced by all input parameter errors, with the most significant sensitivity being observed for relative humidity and temperature due to the movement of the air-vapor mixture, while flow rate and pressure measurements had only slight uncertainty. The maximum uncertainty of the water transport rate in this study was 3.97%. This error confirms that the design of experiment was acceptable for measuring and estimating the performance of a hollow fiber membrane humidifier for real-world fuel cell systems. From the reliable measurement method, the membrane characteristics can be determined in correlation with operating conditions, contributing to research on mass transfer through the membrane. The analysis procedure can also be used for many other studies to assess their reliability and improve the research method.
This work was partly supported by the Korea Institute of Energy Technology Evaluation and Planning (KETEP) grant funded by the Korean government (MOTIE) (No. 20203010030010) and the Technology Innovation Program (20024961) funded by the Ministry of Trade, Industry & Energy (MOTIE, Korea).
|
A, B, C |
empirical coefficients (A=7.16728, B=1716.984, C=232.538) |
|
B |
bias error |
|
M |
molar mass, kg/mol |
|
$\dot{m}$ |
local Nusselt number along the heat source |
|
p |
pressure, Pa |
|
P |
precision error |
|
t |
temperature, ℃ |
|
U, u |
total/overall error |
|
X |
measured value |
|
Greek symbols |
|
|
$\dot{\forall}$ |
volumetric flow rate, LPM |
|
ω |
absolute humidity |
|
φ |
relative humidity, % |
|
x |
independent parameter |
|
Subscripts |
|
|
a |
air |
|
d |
dry |
|
i |
inlet |
|
mix |
mixture |
|
o |
outlet |
|
s |
saturation |
|
v |
vapor |
[1] Yu, S., Im, S., Kim, S., Hwang, J., Lee, Y., Kang, S., Ahn, K. (2011). A parametric study of the performance of a planar membrane humidifier with a heat and mass exchanger model for design optimization. International Journal of Heat and Mass Transfer, 54(7-8): 1344-1351. https://doi.org/10.1016/j.ijheatmasstransfer.2010.11.054
[2] Afshari, E., Baharlou Houreh, N. (2014). An analytic model of membrane humidifier for proton exchange membrane fuel cell. Energy Equipment and Systems, 2(1): 83-94. https://doi.org/10.22059/ees.2014.5011
[3] Firouzjaei, V.K., Rahgoshay, S.M., Khorshidian, M. (2020). Planar membrane humidifier for fuel cell application: Numerical and experimental case study. International Journal of Heat and Mass Transfer, 147: 118872. https://doi.org/10.1016/j.ijheatmasstransfer.2019.118872
[4] Chen, C.Y., Su, J.H., Ali, H.M., Yan, W.M., Amani, M. (2020). Effect of channel structure on the performance of a planar membrane humidifier for proton exchange membrane fuel cell. International Journal of Heat and Mass Transfer, 163: 120522. https://doi.org/10.1016/j.ijheatmasstransfer.2020.120522
[5] Yan, W.M., Lee, C.Y., Li, C.H., Li, W.K., Rashidi, S. (2020). Study on heat and mass transfer of a planar membrane humidifier for PEM fuel cell. International Journal of Heat and Mass Transfer, 152: 119538. https://doi.org/10.1016/j.ijheatmasstransfer.2020.119538
[6] Houreh, N.B., Ghaedamini, M., Shokouhmand, H., Afshari, E., Ahmaditaba, A.H. (2020). Experimental study on performance of membrane humidifiers with different configurations and operating conditions for PEM fuel cells. International Journal of Hydrogen Energy, 45(7): 4841-4859. https://doi.org/10.1016/j.ijhydene.2019.12.017
[7] Ulbricht, M. (2006). Advanced functional polymer membranes. Polymer, 47(7): 2217-2262. https://doi.org/10.1016/j.polymer.2006.01.084
[8] Trinh, N.V., Nguyen, X.L., Kim, Y., Yu, S. (2022). Characteristics of water transport of membrane electrolyte over selected temperature for proton exchange membrane fuel cell. Polymers, 14(15): 2972. https://doi.org/10.3390/polym14152972
[9] Amin, S.K., Roushdy, M.H., El-Sherbiny, C.A. (2016). An overview of production and development of ceramic membranes. International Journal of Applied Engineering Research, 7708-7721.
[10] Zhang, L.Z. (2011). Heat and mass transfer in a randomly packed hollow fiber membrane module: A fractal model approach. International Journal of Heat and Mass Transfer, 54(13-14): 2921-2931. https://doi.org/10.1016/j.ijheatmasstransfer.2011.03.005
[11] Nguyen, X.L., Vu, H.N., Kim, Y., Yu, S. (2022). An experimental study on vapor transport of a hollow fiber membrane module for humidification in proton exchange membrane fuel cells. International Journal of Hydrogen Energy, 47(42): 18518-18529. https://doi.org/10.1016/j.ijhydene.2022.04.056
[12] Bakeri, G., Naeimifard, S., Matsuura, T., Ismail, A.F. (2015). A porous polyethersulfone hollow fiber membrane in a gas humidification process. RSC Advances, 5(19): 14448-14457. https://doi.org/10.1039/C4RA14180F
[13] Park, S.K., Choe, S.Y., Choi, S.H. (2008). Dynamic modeling and analysis of a shell-and-tube type gas-to-gas membrane humidifier for PEM fuel cell applications. International Journal of Hydrogen Energy, 33(9): 2273-2282. https://doi.org/10.1016/j.ijhydene.2008.02.058
[14] Moffat, R.J. (1988). Describing the uncertainties in experimental results. Experimental Thermal and Fluid Science, 1(1): 3-17. https://doi.org/10.1016/0894-1777(88)90043-X
[15] Coleman, H.W., Steele, W.G. (1995). Engineering application of experimental uncertainty analysis. AIAA Journal, 33(10): 1888-1896. https://doi.org/10.2514/3.12742
[16] Price, B.A., Smith, T.F., Suby, A.A., Klaassen, C.J. (2001). Calibration and uncertainty analysis of temperature sensors [HVAC DDC system]. In SIcon/01. Sensors for Industry Conference. Proceedings of the First ISA/IEEE. Sensors for Industry Conference (Cat. No. 01EX459), Rosemont, IL, USA, pp. 286-289. https://doi.org/10.1109/SFICON.2001.968545
[17] Spedding, G.R., Pennycuick, C.J. (2001). Uncertainty calculations for theoretical flight power curves. Journal of Theoretical Biology, 208(2): 127-139. https://doi.org/10.1006/jtbi.2000.2208